. 2025 Jun 23:13:RP103403.
doi: 10.7554/eLife.103403.

PDZ-directed substrate recruitment is the primary determinant of specific 4E-BP1 dephosphorylation by PP1-Neurabin

Affiliations

PDZ-directed substrate recruitment is the primary determinant of specific 4E-BP1 dephosphorylation by PP1-Neurabin

Roman O Fedoryshchak et al. Elife. .

Abstract

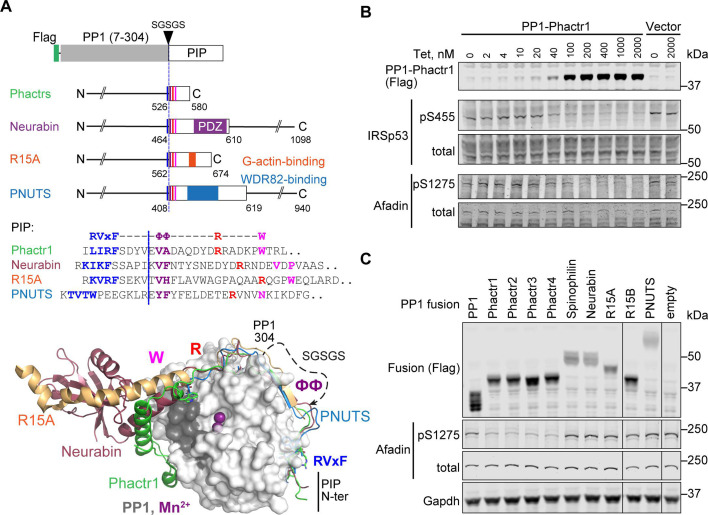
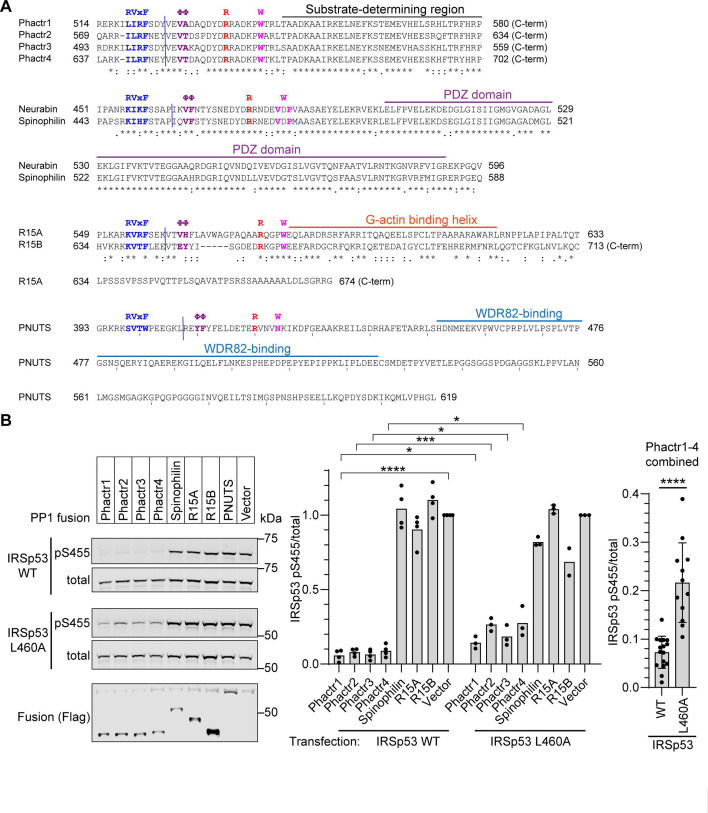
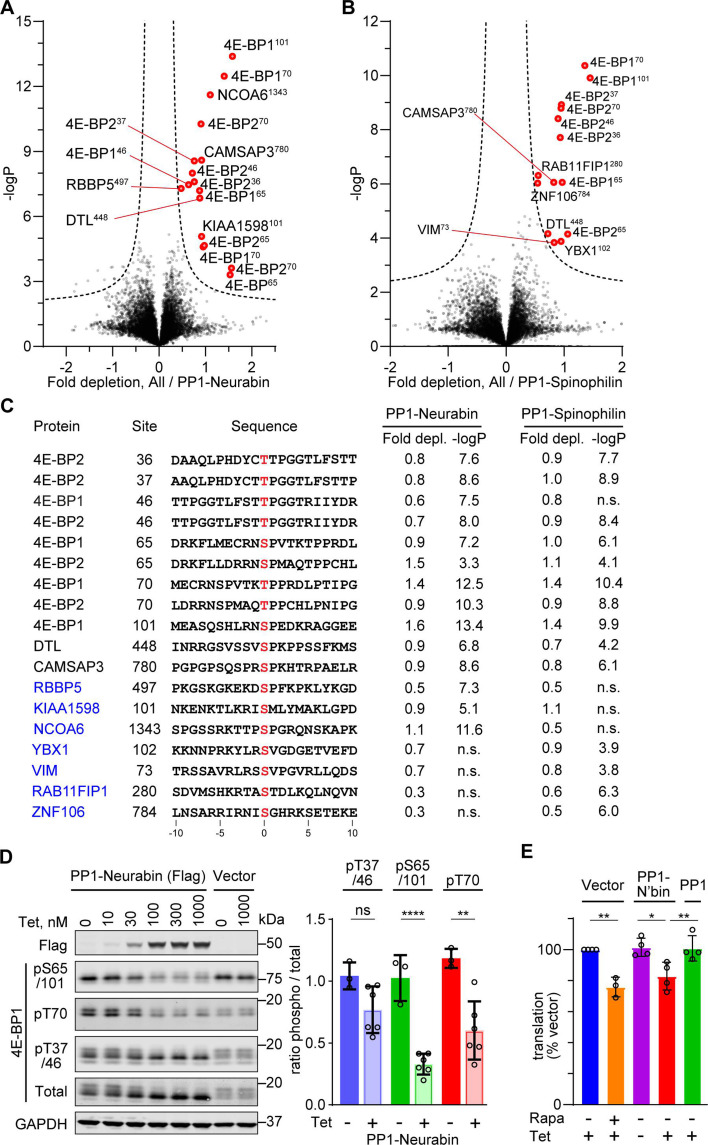
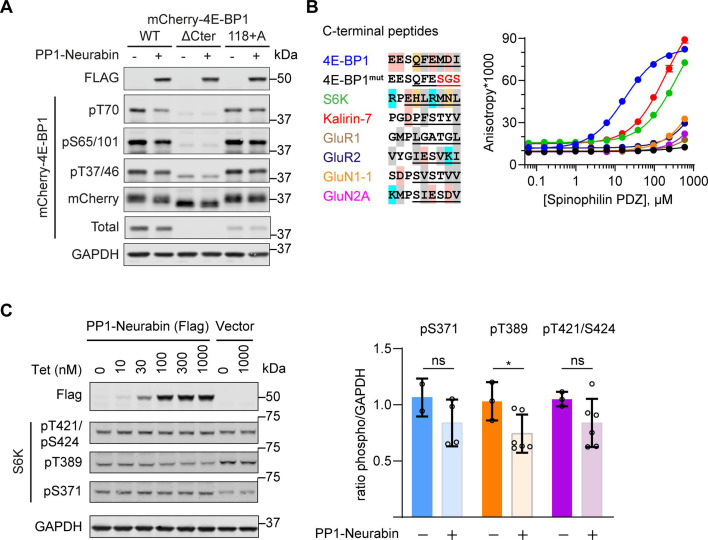
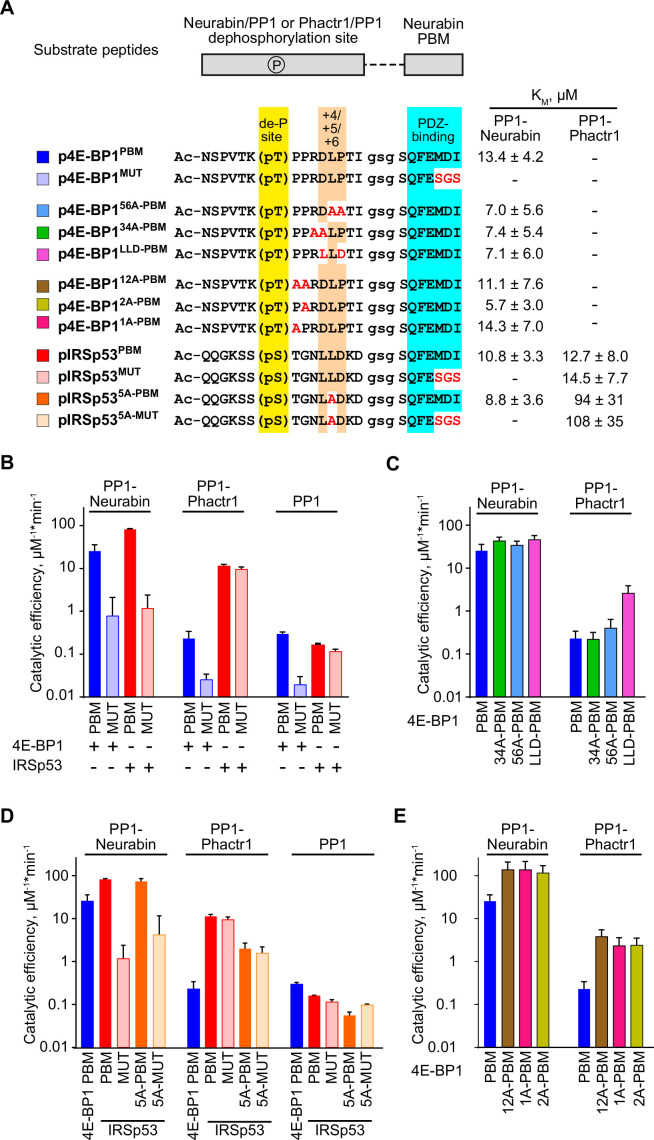
Phosphoprotein phosphatase 1 (PP1) relies on association with PP1-interacting proteins (PIPs) to generate substrate-specific PIP/PP1 holoenzymes, but the lack of well-defined substrates has hindered elucidation of the mechanisms involved. We previously demonstrated that the Phactr1 PIP confers sequence specificity on the Phactr1/PP1 holoenzyme by remodelling the PP1 hydrophobic substrate groove. Phactr1 defines a group of 'RVxF-ΦΦ-R-W' PIPs that all interact with PP1 in a similar fashion. Here, we use a PP1-PIP fusion approach to address sequence specificity and identify substrates of the RVxF-ΦΦ-R-W family PIPs. We show that the four Phactr proteins confer identical sequence specificities on their holoenzymes. We identify the 4E-BP and p70 S6K translational regulators as substrates for the Neurabin/Spinophilin PIPs, implicated in neuronal plasticity, pointing to a role for their holoenzymes in mTORC1-dependent translational control. Biochemical and structural experiments show that in contrast to the Phactrs, substrate recruitment and catalytic efficiency of the PP1-Neurabin and PP1-Spinophilin fusions is primarily determined by substrate interaction with the PDZ domain adjoining their RVxF-ΦΦ-R-W motifs, rather than by recognition of the remodelled PP1 hydrophobic groove. Thus, even PIPs that interact with PP1 in a similar manner use different mechanisms to ensure substrate selectivity.

Keywords: 4E-BP1; Neurabin; PIP; Phactr; biochemistry; chemical biology; human; mTORC1; molecular biophysics; phosphatase; structural biology.


Conflict of interest statement

RF, KE, DJ, SM, RT No competing interests declared

Figures

Figure 1.
Figure 1.. PP1-PIP fusion proteins.
(A) Structures of fusion proteins. N-terminally Flag-tagged PP1α(7–304) is linked to sequences from each of the four families of RVxF-ΦΦ-R-W PIPs, shown as an open box. Each fusion contains sequences immediately C-terminal to the PP1 interaction motif (coloured lines), including known protein interaction domains previously implicated in potential substrate interactions (coloured blocks). For PIP sequences in each fusion, see Figure 1—figure supplement 1A and Methods. Middle, sequences of the RVxF-ΦΦ-R-W string in each PIP, with motifs coloured. Each fusion contains the sequences C-terminal to the dashed line, representing the position of PP1-SGSGS linker insertion. Bottom, structures of PP1/PIP complexes. Crystal structures of different PIP/PP1 complexes superimposed, aligned on PP1. Grey: PP1 (PDB: 4MOV), with PIP sequences as follows; green, Phactr1 (PDB: 6ZEE); magenta, Neurabin (PDB: 3HVQ); orange, R15A (PDB: 7NZM); blue, PNUTS (PDB: 4MOY). Dashed line, GSGSG linker. (B) Activity of PP1-Phactr1 expressed in Flp-In T-REx 293 cells. PP1-Phactr1 expression was induced by tetracycline as indicated. Phosphorylation of Phactr1/PP1 substrates IRSp53 S455 and Afadin S1275 is shown below. (C) Analysis of Phactr1/PP1 substrate Afadin pS1275 phosphorylation in Flp-In T-REx 293 cells expressing PP1 and PP1-fusion proteins.
Figure 1—figure supplement 1.
Figure 1—figure supplement 1.. Sequences and functional validation of PP1-PIP fusions.
(A) PIP sequences in each fusion. Sequences of the PP1-binding and C-terminal sequences in each RVxF-ΦΦ-R-W PIP fusion are shown. Blue line indicates fusion point. Known interaction domains are overlined. (B) IRSp53 WT or L460A mutant was transfected into 293 Flp-In T-REx cells expressing the different fusion proteins, and fusion expression induced by tetracycline. Immunoblotting for total and S455-phosphorylated IRSp53 is shown. Flag tag indicates the expression of the fusion phosphatases. For each of the four PP1-Phactr fusions, the IRSp53 L460A peptide is significantly less reactive than the IRSp53WT peptide (p<0.05 for each fusion). Since the specificity of the four PP1-Phactr fusions is the same, combination of data for all four fusions is shown at the right. Bars are plotted as averages of 3 or 4 replicates. Statistical significance by Student’s t-test: *, p<0.05; ***, p<0.001; ****, p<0.0001.
Figure 1—figure supplement 2.
Figure 1—figure supplement 2.. Structural alignments of RVxF-ΦΦ-R-W PIP complexes with PP1.
(A) Crystal structure of the PP1/Phactr1 complex (PDB 6ZEE). PP1 in white surface representation, with the hydrophobic substrate groove residues C127, A128, S129, I130, I133, Y134, V195, L205, W206, V223 coloured in grey and PP1 active site presumptive Mn2+ ions in purple spheres. Phactr1 is in green surface representation. (B) Crystal structure of the PP1/Spinophilin complex (PDB 3EGG). PP1 is shown as in A, and Spinophilin shown in light pink surface representation. (C) Crystal structure of the PP1/Neurabin complex (PDB 3HVQ). PP1 is shown as in A, and Neurabin shown in red surface representation. (D) Crystal structure of the PP1/PNUTS complex (PDB 4MOY). PP1 is shown as in A, and PNUTS shown in blue surface representation. (E) Crystal structure of the PP1/R15A/Actin/DNAse1 complex (PDB 7NZM). PP1 is shown as in A, and R15A shown in wheat surface representation, and actin as yellow ribbons. (F) Crystal structure of the PP1/R15B complex (PDB 4V0X). PP1 is shown as in A, and R15B shown in orange surface representation. (G) Superposition of all the PIP/PP1 complex structures shown in A–F. A close-up for the PP1 hydrophobic groove is shown, with PP1 as in A and each PIP shown as ribbon representation, coloured as in panels A–F, with the W motif residues shown in sticks. (H) Same as (F) in a different orientation to highlight the alternative orientations of the W PP1/R15A/Actin/DNAse1 and PP1/R15B complexes.
Figure 2.
Figure 2.. PP1-PIP fusion phosphoproteomics.
(A) Tandem mass tag (TMT) phosphoproteomics workflow. (B) Average sample-to-sample correlations between triplicates from cells expressing the different fusion proteins, PP1α(7–304)-SGSGS alone, or empty vector. For the same fusion-expressing cell lines, the average of Pearson coefficients of correlation within a triplicate are shown. (C) Specific phosphosite depletion in cells expressing PP1-Phactr1 as opposed to PP1 alone. Abundances of specific phosphosites in PP1 and PP1-Phactr1 samples were determined, log-transformed, and expressed as Z-scores. For each phosphosite, depletion in cells expressing PP1-Phactr1 as opposed to PP1 alone was quantified as the difference between the PP1 and PP1-Phactr1 Z-scores, and plotted versus -log10p. Dashed line, 5% false discovery rate cut-off. Purple, phosphosites conforming to the Phactr1/PP1 substrate motif S/T-x2,3-Φ-L. Red, Phactr1/PP1 substrates identified previously (Fedoryshchak et al., 2020). (D) Enrichment of hits conforming to the Phactr1 substrate motif S/T-x2,3-Φ-L and of hits identified in the previous study in all Phactr samples calculated using Fisher’s exact test. (E) Venn diagram showing overlap between hits identified as potential Phactr1-4 substrates.
Figure 2—figure supplement 1.
Figure 2—figure supplement 1.. Detailed analysis of PP1 and PP1-Phactr1-4 phosphoproteomics.
(A) Phosphorylation sites depleted in PP1-expressing samples compared with control empty-vector samples. Dashed line, 1% false discovery rate cut-off. (B) Frequency plots for residues identified as PP1 hits in (A) and for all phosphorylation sites in the analysis. Enrichment is broadly consistent with published findings (Hoermann et al., 2020). (C) The top Phactr1/PP1 substrate sites previously identified in mouse NIH3T3 cells (Fedoryshchak et al., 2020) are listed and compared with the candidate substrates for the four PP1-Phactr fusions identified here in human 293 Flp-In T-REx cells. Phosphorylation sites that could not be identified or that were not detectable in 293 Flp-In T-REx cells are indicated. ‘+’ and ‘no‘ indicate phosphorylation sites identified in 293 Flp-In T-REx cells that were either sensitive (+) or insensitive (no) to PP1-Phactr fusion expression. (D–F) Specific phosphorylation site depletion in cells expressing PP1-Phactr2 (C), PP1-Phactr3 (D), or PP1-Phactr4 (E) fusion proteins as opposed to PP1 alone. Abundances of specific phosphorylation sites in PP1 and the different PP1-Phactr fusion samples were determined, log-transformed, and expressed as Z-scores. For each phosphorylation site, depletion in cells expressing each fusion as opposed to PP1 alone was quantified as the difference between the PP1 and PP1-Phactr fusion Z-scores, and plotted versus -log10p. Dashed line, 5% false discovery rate cut-off. Purple, phosphorylation sites conforming to the Phactr1/PP1 substrate motif S/T-x2,3-Φ-L. Red, top Phactr1/PP1 hits identified previously (Fedoryshchak et al., 2020).
Figure 2—figure supplement 2.
Figure 2—figure supplement 2.. Detailed analysis of PP1-R15A, PP1-R15B and PP1-PNUTS phosphoproteomics.
(A) Identification of PP1-R15A substrates. Abundances of specific phosphorylation sites in PP1-R15A samples were determined, log-transformed, and expressed as Z-scores. For each phosphorylation site, the average abundance in the remaining datasets, excluding PP1-R15B, was quantified in the same way. Depletion of phosphorylation sites in cells expressing PP1-R15A was quantified as the difference between the PP1-R15A and the dataset average Z-scores, and plotted versus -log10p. Dashed line, 5% false discovery threshold. (B) Identification of PP1-R15B substrates. Depletion of each phosphorylation site in cells expressing PP1-R15B, relative to its average abundance in the other datasets, excluding PP1-R15A, was quantified and plotted as in (A). Significantly depleted phosphorylation sites are highlighted in red. (C) Identification of PP1-PNUTS substrates. Depletion of each phosphorylation site in cells expressing PP1-PNUTS, relative to its average abundance in all the other datasets, was quantified and plotted as in (D). Significantly depleted phosphorylation sites are highlighted in red. PNUTS phosphorylation sites exhibiting increased abundance, presumably reflecting PP1-PNUTS fusion expression, are highlighted in blue.
Figure 3.
Figure 3.. Phosphoproteomics of PP1-Neurabin and PP1-Spinophilin.
(A) Identification of PP1-Neurabin substrates. Abundances of specific phosphorylation sites in PP1-Neurabin samples were determined, log-transformed, and expressed as Z-scores. For each phosphosite, the abundance in the remaining datasets, excluding PP1-Spinophilin, was quantified in the same way. Depletion of phosphosites in cells expressing PP1-Neurabin was quantified as the difference between the PP1-Neurabin and the dataset average Z-scores, and plotted versus -log10p. Dashed line, 5% false discovery threshold; significantly depleted phosphosites are highlighted in red. (B) Identification of PP1-Spinophilin substrates. Depletion of each phosphorylation site in cells expressing PP1-Spinophilin, relative to its average abundance in the other datasets, excluding PP1-Neurabin, was quantified and plotted as in (A). (C) Sequences of significantly depleted phosphorylation sites identified in (A and B). (D) Immunoblot analysis of 4E-BP1 phosphorylation sites in 293 Flp-In T-REx cells upon induced expression of PP1-Neurabin or empty vector. Note that the low level of PP1-Neurabin expression in uninduced cells (see Figure 3—figure supplement 1C) alters the relative abundance of the different phosphorylated forms compared with 293 Flp-In T-REx cells expressing vector alone. (E) Protein synthesis quantification assay. 293 Flp-In T-REx cells expressing vector alone, PP1-Neurabin, or PP1, were induced with tetracycline (50 nM) and/or treated with rapamycin (50 nM) for 16 hr as indicated before treatment with O-propargyl puromycin to label nascent polypeptides, which were conjugated to Alexa Fluor-488 azide and quantified by flow cytometry. Fluorescence intensities were normalised to untreated cells.
Figure 3—figure supplement 1.
Figure 3—figure supplement 1.. Additional details for the identification of 4E-BP1 as PP1-Neurabin target.
(A) 4E-BP1 and 4E-BP2 levels are unaffected by PP1-Neurabin expression. Protein abundances in PP1-Neurabin cells before and after induction of PP1-Neurabin expression were determined, log-transformed, and normalised to median. Change in relative abundance upon induction was scored as the difference between the induced and uninduced samples, and plotted versus -log10p. Dashed line, 5% false discovery threshold. Neurabin and the 4E-BPs are highlighted in red. (B) Specificity analysis of the commercial anti-phospho-S65 antibody. (C) Basal expression of PP1-Neurabin in uninduced 293 Flp-In T-REx cells. Data are contrast-enhanced blots from Figure 3D. (D) mTORC1 pathway schematic (see Hoeffer and Klann, 2010; Liu and Sabatini, 2020).
Figure 4.
Figure 4.. 4E-BP1 is a substrate of PP1-Neurabin.
(A) mCherry-tagged wildtype 4E-BP1 or 4E-BP1(118+A) were expressed and purified from 293 cells, incubated with increasing amounts of recombinant PP1-Neurabin. Phosphorylation of the indicated sites was analysed by immunoblotting. (B) Quantification of (A). (C) Left, sequence alignment of potential Neurabin/Spinophilin PDZ domain ligands. Grey shading, hydrophobic residues; pink, acidic residues; cyan, basic residues; orange, hydrophilic residues. Underlining shows sequences N-terminally linked to 6-carboxyfluorescein (FAM) for use in fluorescence polarisation (FP) assay. Right, binding affinities for the Neurabin and Spinophilin PDZ domains as determined in the FP assay. (D) FP assay. FAM-labelled peptides (see C) were titrated with increasing concentrations of recombinant Neurabin PDZ domain and affinity estimated from change in fluorescence anisotropy. For Spinophilin data, see Figure 4—figure supplement 1B.
Figure 4—figure supplement 1.
Figure 4—figure supplement 1.. 4E-BP1 is a substrate of both PP1-Neurabin and PP1-Spinophilin.
(A) Immunoblotting analysis of wildtype mCherry-4E-BP1 or mutants either lacking the six C-terminal residues (ΔCter) or containing an additional C-terminal alanine (118+A) upon expression in 293 cells with or without PP1-Neurabin expression as indicated. (B) Left, sequence alignment of potential Neurabin/Spinophilin PDZ domain ligands. Grey shading, hydrophobic residues; pink, acidic residues; cyan, basic residues; orange, hydrophilic residues. Underlining shows sequences N-terminally linked to 6-carboxyfluorescein (FAM) for use in fluorescence polarisation (FP) assay. FAM-labelled peptides were titrated with increasing concentrations of recombinant Spinophilin PDZ domain and affinity estimated from change in fluorescence anisotropy (for summary, see Figure 4C). (C) Immunoblotting analysis of S6K phosphorylation in 293 Flp-In T-REx cells upon expression of PP1-Neurabin or empty vector.
Figure 5.
Figure 5.. Substrate specificity determinants of PP1-Neurabin.
(A) Top, synthetic substrate peptides contain either the 4E-BP1 T70 or IRSp53 S455 phosphorylation sites, joined by a GSG linker to the Neurabin PDZ-binding C-terminal sequences. PBM, PDZ-binding motif (FEMDI); MUT, mutated PBM (FEsgs). Below, sequences of the different peptides analysed; highlights indicate the dephosphorylation site (yellow), the +4/+6 region (orange), and the PDZ-binding sequence (cyan), with alanine and other substitutions indicated in red. Peptides were treated with recombinant PP1-Neurabin, PP1-Phactr1, or PP1 in the presence of the phosphate sensor, and KM and catalytic efficiencies determined. KM are shown at the right; for catalytic efficiency quantification, see Figure 5—figure supplement 1A. For raw and processed data, see Supplementary file 3. (B–E) Panels show relative catalytic efficiencies as determined from data displayed in Figure 5—figure supplement 1B–E. Each panel shows different subsets of the data to highlight comparison between different enzymes and/or substrates. For raw and processed data, see Supplementary file 3. (B) Comparison of Neurabin-PP1 and Phactr1-PP1 substrates 4E-BP1 and IRSp53 to assess the role of the Neurabin PDZ domain in substrate recognition. (C) Role of the +4/+6 region in 4E-BP1 substrate recognition. (D) Role of the +5 residue in IRSp53 substrate recognition. (E) Role of 4E-BP1+1/+2 residues.
Figure 5—figure supplement 1.
Figure 5—figure supplement 1.. Substrate dephosphorylation by PP1-Neurabin, PP1-Phactr1 and PP1.
(A) Catalytic efficiencies for the various peptide dephosphorylation reactions by PP1-Neurabin, PP1-Phactr1, and PP1 are shown. For raw and processed data, see Supplementary file 3. (B–E) Dephosphorylation reaction rates plotted against substrate concentration for different sets of phosphopeptides with PP1-Neurabin, PP1-Phactr1, or PP1.
Figure 5—figure supplement 2.
Figure 5—figure supplement 2.. Schematic showing the mechanisms of substrate binding by Phactr1/PP1 and Neurabin/PP1 complexes.
Phosphate groups are indicated by red lollipops, the Phactr1 consensus in orange, and the Neurabin PBM motif in cyan.
Figure 6.
Figure 6.. Structural analysis of 4E-BP1 interactions with PP1-Neurabin.
(A) Schematic of the PP1-4E-BP1 chimera and of Neurabin PP1-interacting and PDZ domain sequences. (B) Crystal structure of the PP1-4E-BP1/Neurabin complex. PP1 in white surface representation, Neurabin in lilac surface representation, 4E-BP1 in blue stick representation, with unresolved sequences indicated by dashed line. PP1 active site presumptive Mn2+ ions in purple. (C) Comparison of PP1-4E-BP1/Neurabin complex structure with the previously published Neurabin/PP1 holophosphatase structure (9PDB 3HVQ) (Ragusa et al., 2010). PP1 in white surface representation, Neurabin in ribbon representation (lilac, PP1-4E-BP1/Neurabin; red, Neurabin/PP1). 4E-BP1 in blue stick representation, unresolved sequences not shown. Structures are superimposed on PP1 residues 7–298 (rmsd = 0.21 Å, 277 alpha carbons). (D) Close-up view of interactions between 4E-BP1 C-terminal sequences (blue sticks) with the Neurabin PDZ domain (lilac cartoons). (E) AlphaFold3 model of the phosphorylated PP1-4E-BP1 chimera/Neurabin(423–593) interaction. A close-up view of predicted interaction of pT70 with the PP1 catalytic site is shown. For PAE and pLDDT plots, see Figure 6—figure supplement 2A. PP1 and Neurabin are shown respectively in white and lilac surface representation, with PP1 active site Mn2+ ions in purple. 4E-BP1 sequences are in stick representation, colour-coded according to the AlphaFold3 pLDDT score (inset). See also Figure 6—figure supplement 2C. (F) AlphaFold3 modelling of the Neurabin(423–593)/PP1-5x phospho-4E-BP1 interaction. PP1 and Neurabin are shown respectively in white and lilac surface representation, with PP1 active site Mn2+ ions in purple. 4E-BP1 sequences are in ribbon and stick representation, colour-coded according to the AlphaFold3 pLDDT score (inset), with the 4E-BP1 phosphorylations at T37, T46, S65, T70, and S101 shown in spheres. For PAE and pLDDT plots, see Figure 6—figure supplement 2F.
Figure 6—figure supplement 1.
Figure 6—figure supplement 1.. Additional characterisation of the PP1-4E-BP1/Neurabin complex.
(A) Crystal structure of the PP1-4E-BP1/Neurabin complex. PP1 in white surface representation, with active site presumptive Mn2+ ions in purple, Neurabin in lilac cartoon representation, and 4E-BP1 in blue stick representation. PP1 2Fo-Fc electronic density contoured at 1 sigma level is displayed around Neurabin. (B) Comparison of the PBM-liganded Neurabin PDZ domain (pink ribbons) with the previously published structure of the unliganded Neurabin PDZ domain (red ribbons) (PDB 3HVQ, Ragusa et al., 2010). The 4E-BP1 PBM is shown in blue stick representation.
Figure 6—figure supplement 2.
Figure 6—figure supplement 2.. AlphaFold3 predictions for phosphorylated 4E-BP1 binding to PP1 and Neurabin.
(A, B) AlphaFold3 models of the phosphorylated (A) and unphosphorylated (B) PP1-4E-BP1 chimera/Neurabin(423–593) interaction. Left, PAE plots; right, pLDDT plots, with confidence boundaries indicated by dashed lines (>90%, very high [side chains]; 70–90%, high [main chain]; 50–70%, low). (C, D) AlphaFold3 models of the phosphorylated (C) and unphosphorylated (D) PP1-4E-BP1 chimera/Neurabin(423–593) interaction. PP1 and Neurabin are shown respectively in white and lilac surface representation with PP1 active site Mn2+ ions in purple. 4E-BP1 sequences are in stick representation, colour-coded according to the AlphaFold3 pLDDT score (inset), with pT70 and T70 in space-fill; linker residues are in black. Below are shown close-up views of predicted interactions with the PP1 catalytic site. For PAE and pLDDT plots, see (A, B). (E) Comparison of crystal structure and AlphaFold3 model of 4E-BP1/PDZ interactions in phosphorylated and unphosphorylated PP1-4E-BP1 chimera/Neurabin(423–593) interaction. Predicted structures are oriented by superposition of the PDZ domain, shown in lilac ribbon representation. 4E-BP1 sequences are in stick representation, colour-coded according to the AlphaFold3 pLDDT score as in panels C and D. Note that AlphaFold3 does not predict any interaction between the Neurabin PDZ domain and the 4E-BP1(118+A) PBM mutant characterised in Figure 4. (F) AlphaFold3 modelling of the Neurabin(423–593)/PP1-5x phospho-4E-BP1 interaction. Left, PAE plots; right, pLDDT plots, with confidence boundaries indicated by dashed lines (>90%, very high [side chains]; 70–90%, high [main chain]; 50–70%, low).

Update of

  • doi: 10.1101/2024.09.23.614477
  • doi: 10.7554/eLife.103403.1
  • doi: 10.7554/eLife.103403.2

Similar articles

References

    1. Abramson J, Adler J, Dunger J, Evans R, Green T, Pritzel A, Ronneberger O, Willmore L, Ballard AJ, Bambrick J, Bodenstein SW, Evans DA, Hung C-C, O’Neill M, Reiman D, Tunyasuvunakool K, Wu Z, Žemgulytė A, Arvaniti E, Beattie C, Bertolli O, Bridgland A, Cherepanov A, Congreve M, Cowen-Rivers AI, Cowie A, Figurnov M, Fuchs FB, Gladman H, Jain R, Khan YA, Low CMR, Perlin K, Potapenko A, Savy P, Singh S, Stecula A, Thillaisundaram A, Tong C, Yakneen S, Zhong ED, Zielinski M, Žídek A, Bapst V, Kohli P, Jaderberg M, Hassabis D, Jumper JM. Accurate structure prediction of biomolecular interactions with AlphaFold 3. Nature. 2024;630:493–500. doi: 10.1038/s41586-024-07487-w. - DOI - PMC - PubMed
    1. Adams PD, Afonine PV, Bunkóczi G, Chen VB, Davis IW, Echols N, Headd JJ, Hung LW, Kapral GJ, Grosse-Kunstleve RW, McCoy AJ, Moriarty NW, Oeffner R, Read RJ, Richardson DC, Richardson JS, Terwilliger TC, Zwart PH. PHENIX: a comprehensive Python-based system for macromolecular structure solution. Acta Crystallographica. Section D, Biological Crystallography. 2010;66:213–221. doi: 10.1107/S0907444909052925. - DOI - PMC - PubMed
    1. Aguilar-Valles A, Matta-Camacho E, Khoutorsky A, Gkogkas C, Nader K, Lacaille JC, Sonenberg N. Inhibition of group I metabotropic glutamate receptors reverses autistic-like phenotypes caused by deficiency of the translation repressor eIF4E binding protein 2. The Journal of Neuroscience. 2015;35:11125–11132. doi: 10.1523/JNEUROSCI.4615-14.2015. - DOI - PMC - PubMed
    1. Allen PB, Ouimet CC, Greengard P. Spinophilin, a novel protein phosphatase 1 binding protein localized to dendritic spines. PNAS. 1997;94:9956–9961. doi: 10.1073/pnas.94.18.9956. - DOI - PMC - PubMed
    1. Artemenko M, Zhong SSW, To SKY, Wong AST. p70 S6 kinase as a therapeutic target in cancers: More than just an mTOR effector. Cancer Letters. 2022;535:215593. doi: 10.1016/j.canlet.2022.215593. - DOI - PubMed

LinkOut - more resources