. 2025 Jun 2;66(6):67.
doi: 10.1167/iovs.66.6.67.

Three-Dimensional Culture of Orbital Fibroblasts From Thyroid Eye Disease Induce In Vivo-Like Tissue Remodeling and Fibrosis

Affiliations

Three-Dimensional Culture of Orbital Fibroblasts From Thyroid Eye Disease Induce In Vivo-Like Tissue Remodeling and Fibrosis

Xiaoli Bao et al. Invest Ophthalmol Vis Sci. .

Abstract

Purpose: This study aimed to investigate the characteristics and molecular mechanisms of orbital fibroblasts under three-dimensional (3D)-culture conditions.

Methods: Orbital connective tissue was collected from patients with thyroid eye disease (TED) and normal controls. Primary fibroblasts were cultured and used to generate 3D microspheres via the hanging drop. These spheroids were cultured for nine days, followed by biomechanical testing, transmission electron microscopy (TEM), and RNA sequencing for transcriptomic analysis. Multiplex immunofluorescence staining was used to assess fibrosis markers, and quantitative PCR validated gene expression changes. TED and normal control (NC) tissues, as well as primary cultured fibroblasts, were also subjected to transcriptomic sequencing.

Results: TED-3D microspheres exhibited enhanced contractility, denser fiber deposition, and a characteristic fibrous ring at the periphery. TEM revealed more extracellular matrix (ECM) deposition and stronger tissue remodeling in TED-3D. Fibrosis markers (α-SMA, COL1A1, FN1) increased significantly in TED-3D. Biomechanical testing showed higher stiffness in TED-3D compared to NC-3D. Transcriptomic analysis revealed significant differences, with genes involved in ECM remodeling and fibrosis pathways enriched in TED-3D. Transcriptomic comparison of TED-tissue, TED-2D, and TED-3D revealed that TED-3D is closer to tissue than TED-2D.

Conclusions: The 3D culture of orbital fibroblasts from TED induces in vivo-like tissue remodeling and fibrosis features. Compared to traditional two-dimensional culture, the expression pattern of TED-3D is closer to tissue, making it a more effective model for studying the mechanisms of TED-related fibrosis.


Conflict of interest statement

Disclosure: X. Bao, None; Z. Xu, None; X. Wang, None; T. Zhang, None; H. Ye, None; H. Yang, None

Figures

Figure 1.
Figure 1.
Experimental design process. (A) Establishment of 3D microspheres using the hanging drop method. (B) Experimental group.
Figure 2.
Figure 2.
Establishment of 3D culture of orbital fibroblasts. (A) Light microscope image of microsphere culture. (B) Quantitative analysis of microsphere diameter. (C) H&E staining of microspheres. (D) Quantitative analysis of microsphere density. (E) Masson staining of microspheres. **P < 0.01, ***P < 0.001, ns: not significant, compared to the control group. Scale bar: 50 µm
Figure 3.
Figure 3.
Microscopic structural changes in TED-3D and NC-3D culture.
Figure 4.
Figure 4.
Fibrosis marker staining in TED microspheres. (A) Multicolor fluorescence staining of TED at different culture times. (B) Quantitative fluorescence analysis. **P < 0.01, ***P < 0.001, ns: not significant, compared to the control group. Scale bar: 50 µm.
Figure 5.
Figure 5.
Fibrosis marker staining in TED and NC microspheres. (A) Multicolor fluorescence staining of TED and NC microspheres in six days. (B) Quantitative fluorescence analysis. *P < 0.05, compared to the control group. Scale bar: 50 µm.
Figure 6.
Figure 6.
Biomechanical analysis of microspheres. (A) Nanoindentation experiments of TED-3D and NC-3D cultures. On the right, force-displacement and force-time curves for TED-3D. (B) Quantitative analysis of stiffness and elasticity of the 3D cultures. ***P < 0.001.
Figure 7.
Figure 7.
Transcriptomic analysis at different time points of TED-3D vs TED-2D and NC-3D vs NC-2D. (A) Volcano plot of differential gene analysis between TED-3D and TED-2D. (B) GO analysis of differential genes between TED-3D and TED-2D. (C) KEGG analysis of differential genes between TED-3D and TED-2D. (D) Volcano plot of differential gene analysis between NC-3D and NC-2D. (E) GO analysis of differential genes between NC-3D and NC-2D. (F) KEGG analysis of differential genes between NC-3D and NC-2D. (G) UpSet plot of differential genes between TED and NC.
Figure 8.
Figure 8.
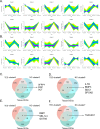
Time trend analysis of TED-3D and NC-3D. (A) Time trend analysis of TED-3D. (B) Time trend analysis of NC-3D. (C) Intersection of differential genes between TED-cluster9, NC-cluster2, and tissue sequencing. (D) Intersection of differential genes between TED-cluster8, NC-cluster8, and tissue sequencing. (E) Intersection of differential genes between TED-cluster2, NC-cluster6, and tissue sequencing. (F) Intersection of differential genes between TED-cluster5, NC-cluster7, and tissue sequencing.
Figure 9.
Figure 9.
Comparison of TED tissue transcriptomic sequencing, TED-3D transcriptomic sequencing, and TED-2D transcriptomic sequencing. (A) Trend analysis of differential genes from TED tissue sequencing in 3D and 2D cultures. (B) Comparison of the correlation between 3D culture, 2D culture, and tissue samples. (C) Intersection of GO pathways for differential genes in TED tissue sequencing, TED-3D sequencing, and TED-2D sequencing. (D) GO analysis of TED tissue sequencing. (E) GO analysis of TED-2D sequencing. (F) GO analysis of TED-3D sequencing.

Similar articles

References

    1. Bahn RS. Graves’ ophthalmopathy. N Engl J Med. 2010; 362: 726–738. - PMC - PubMed
    1. Lazarus JH. Epidemiology of Graves’ orbitopathy (GO) and relationship with thyroid disease. Best Pract Res Clin Endocrinol Metab. 2012; 26: 273–279. - PubMed
    1. Sahli E, Gunduz K. Thyroid-associated ophthalmopathy. Turk J Ophthalmol. 2017; 47: 94–105. - PMC - PubMed
    1. Taylor PN, Zhang L, Lee RWJ, et al.. New insights into the pathogenesis and nonsurgical management of Graves orbitopathy. Nat Rev Endocrinol. 2020; 16: 104–116. - PubMed
    1. Smith TJ, Hegedus L, Douglas RS, Role of insulin-like growth factor-1 (IGF-1) pathway in the pathogenesis of Graves’ orbitopathy. Best Pract Res Clin Endocrinol Metab. 2012; 26: 291–302. - PMC - PubMed

LinkOut - more resources