. 2025 Jul 22;10(7):e0027125.
doi: 10.1128/msystems.00271-25. Epub 2025 Jun 23.

Microbial diagnostic features identified across populations possess potential antitumor properties in breast cancer

Affiliations

Microbial diagnostic features identified across populations possess potential antitumor properties in breast cancer

Min Zhou et al. mSystems. .

Abstract

The consistency of the associations between the breast microbiome and breast cancer (BC) across various studies remains uncertain. Publicly accessible data sets from five BC studies, comprising 16S rRNA gene sequencing data from 161 BC tissues (BC_tissue), 195 BC adjacent non-cancerous tissues (BC_adjacent), and 451 normal breast tissues (normal_tissue), were retrieved from the European Nucleotide Archive. Overall, the microbial composition across the three breast tissue statuses was predominantly characterized by the phyla Proteobacteria and Firmicutes, a distribution likely attributable to the fatty acid-rich environment of the breast tissue. Comparative analysis revealed that the relative abundances of the genera Cutibacterium and Burkholderia were significantly increased in both BC_adjacent and normal_tissue compared to BC_tissue. This observation suggested a potential anticancer effect associated with these genera. Our analysis revealed a significant reduction in the abundance of Cutibacterium and Cutibacterium acnes in BC tissues, which served as specific diagnostic features for BC. This finding was corroborated by our in-house data set (n = 28), which yielded similar conclusions. Subsequent in vitro and in vivo experiments verified the potential antitumor effects of C. acnes supernatant in BC. In conclusion, our study highlighted the predictive capacity of microbial biomarkers in the onset of BC. Notably, specific bacterial species within the breast microbiome, such as Cutibacterium and C. acnes, exhibited potential as diagnostic markers for BC and may contribute significantly to antitumor activity. Nevertheless, the molecular mechanisms governing their interactions with cancer cells are not yet fully understood, necessitating further research to investigate their viability as targets for tumor prevention.IMPORTANCEAlthough a growing number of studies have highlighted the significant role of microorganisms in BC, there is a lack of consensus regarding the specific microbial genera consistently associated with breast cancer. While some studies have identified certain genera in the breast cancer environment, the results are often inconsistent and influenced by factors such as study design, population, or methodologies used. Through a comprehensive analysis of five publicly available breast cancer studies, along with validation from an in-house cohort, we found a significantly reduced abundance of Cutibacterium and C. acnes in BC tissues. In vivo and in vitro experiments demonstrated the antitumor effects of C. acnes in BC. Understanding the antitumor mechanisms of C. acnes in BC may provide potential avenues for developing novel therapeutic strategies for this disease.

Keywords: Cutibacterium acnes; antitumor properties; breast cancer; culturomics; propanoate metabolism; random forest; specific microbial feature.


Conflict of interest statement

The authors declare no conflict of interest.

Figures

Fig 1
Fig 1
Compositional overview of the breast microbiota between BC_tissue, BC_adjacent, and normal_tissue samples. (A) Composition of microbial communities at the phylum level. (B) Composition of microbial communities at the genus level. (C–F) Alpha diversity, as measured by Shannon’s index, of patients with BC_tissue (blue), BC_adjacent (green), or normal_tissue (red) across the studies by Esposito_2022 (C), Hoskinson_2022 (D), Kartti_2023 (E), and German_2023 (F). (G–J) Alpha diversity, as measured by Simpson’s index, of patients with BC_tissue (blue), BC_adjacent (green), or normal_tissue (red) across the studies by Esposito_2022 (G), Hoskinson_2022 (H), Kartti_2023 (I), and German_2023 (J). (K) Principal coordinate analysis (PCoA) revealed a substantial variation in microbial composition among the five study populations (PERMANOVA R2 = 23.6% in “study,” P = 0.001; PERMANOVA R2 = 6.0% in “disease,” P = 0.001). The study was color-coded, and the group was indicated by different shapes. The upper and right boxplots depict the samples projected onto the first two principal coordinates, categorized by study and disease statuses, respectively. All boxplots illustrate the interquartile range (25th–75th percentile) of the distribution, with the median represented by a thick line at the center of the box. The whiskers extend to values within 1.5 times the interquartile range, and outliers are indicated by dots.
Fig 2
Fig 2
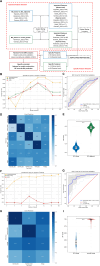
Prediction performance of specific features in BC studies at the genus level. (A) Flowchart for microbial model construction. (B) The average area under the curve (AUC) values for 10-fold random forest (RF) cross-validation, study-to-study transfer validation classifiers, and leave-one-study-out (LOSO) validation were evaluated for distinguishing between BC_tissue and BC_adjacent, utilizing varying numbers of features. (C) The AUC of the optimized models constructed with the 20 specific microbial features for distinguishing BC_tissue from BC_adjacent. Mean AUC and standard deviation of stratified 10-fold cross-validation are shown. (D) The prediction performance of specific features was assessed using study-to-study and LOSO validation methodologies. The heatmap illustrates the area under the receiver operating characteristic curve (AUROC) derived from cross-validations within each individual study (represented by blue boxes along the diagonal) and from study-to-study model transfer (external validations, represented by off-diagonal elements). The final column presented the average AUROC for study-to-study predictions. The bottom row indicates the AUROC for a model trained on all studies except one, corresponding to the LOSO validation approach. (E) A comparative analysis of RF score distributions, as determined by the BC_tissue and BC_adjacent-related classifier, was conducted between BC_tissue and BC_adjacent samples. Two-sided P values were computed utilizing the Wilcoxon rank-sum test. (F) The average AUC values for 10-fold RF cross-validation, study-to-study transfer validation classifiers, and LOSO validation were evaluated for distinguishing between BC_tissue and normal_tissue, utilizing varying numbers of features. (G) The AUC of the optimized models constructed with the 14 specific microbial features for distinguishing BC_tissue from normal_tissue. (H) The prediction performance of specific features was assessed using study-to-study and LOSO validation methodologies. (I) Comparison of RF score distributions calculated by the BC_tissue vs. normal_tissue-related classifier between BC_tissue and normal_tissue. ****P < 0.0001.
Fig 3
Fig 3
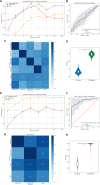
Prediction performance of specific features in BC studies at the species level. (A) The average AUC values for 10-fold RF cross-validation, study-to-study transfer validation classifiers, and LOSO validation were evaluated for distinguishing between BC_tissue and BC_adjacent, utilizing varying numbers of features. (B) The AUC of the optimized models constructed with the 14 specific microbial features for distinguishing BC_tissue from BC_adjacent. (C) The prediction performance of specific features was assessed using study-to-study and LOSO validation methodologies. (D) A comparative analysis of RF score distributions, as determined by the BC_tissue and BC_adjacent-related classifier, was conducted between BC_tissue and BC_adjacent samples. (E) The average AUC values for 10-fold RF cross-validation, study-to-study transfer validation classifiers, and LOSO validation were evaluated for distinguishing between BC_tissue and normal_tissue, utilizing varying numbers of features. (F) The AUC of the optimized models constructed with the 14 specific microbial features for distinguishing BC_tissue from normal_tissue. (G) The prediction performance of specific features was assessed using study-to-study and LOSO validation methodologies. (H) Comparison of RF score distributions calculated by the BC_tissue vs. normal_tissue-related classifier between BC_tissue and normal_tissue. ****P < 0.0001.
Fig 4
Fig 4
Abundance of Cutibacterium and Cutibacterium acnes varies between BC tissues and peritumoral or normal breast tissues. (A) The abundance difference of Cutibacterium in patients with BC_tissue, BC_adjacent, and normal_tissue. (B) The abundance difference of C. acnes in patients with BC_tissue, BC_adjacent, and normal_tissue. (C–G) The abundance of the top 10 species subsequent to the exclusion of Esposito_2022 (C), Hoskinson_2022 (D), Kartti_2023 (E), Liu_2023 (F), or German_2023 (G), respectively. (H) The abundance of Cutibacterium in patients with BC_tissue, BC_adjacent, and benign_tissue in our in-house data set.
Fig 5
Fig 5
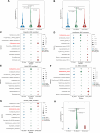
Microbial functional alterations in different breast conditions. (A) Visualization of differential pathways between BC_tissue and BC_adjacent by volcano plot, with specific emphasis on marking the fatty acid-related pathways (fatty acid biosynthesis, propanoate metabolism, butanoate metabolism, biosynthesis of unsaturated fatty acids, and fatty acid degradation). The red dots indicated the upregulation of the differential pathway in BC_adjacent, whereas the blue dots indicated the upregulation of the differential pathway in BC_tissue. (B) Visualization of differential pathways between BC_tissue and normal_tissue by volcano plot, with specific emphasis on marking the fatty acid-related pathways. The red dots indicate the upregulation of the differential pathway in normal_tissue, whereas the blue dots indicated the upregulation of the differential pathway in BC_tissue. (C) Comparison of the differences in abundance between BC_tissue (blue) and BC_adjacent (green) fatty acid pathways. (D) Comparison of the differences in abundance between BC_tissue (blue) and normal_tissue (red) fatty acid pathways. (E) Schematic representation of the propanoate biosynthesis pathway, highlighting its rate-limiting enzymes, including acdA (acetate-CoA ligase [ADP-forming], EC:6.2.1.13), ackA (acetate kinase, EC:2.7.2.1), acs (ACSS, acetyl-CoA synthetase, EC:6.2.1.1), pct (propionate CoA-transferase, EC:2.8.3.1), pduW (propionate kinase, EC:2.7.2.15), and prpE (propionyl-CoA synthetase, EC:6.2.1.17). (F–I) Comparison of the differences in abundance of acs (F), prpE (G), ackA (H), and pct (I) in patients with BC_tissue, BC_adjacent, and normal_tissue. **P < 0.01, and ****P < 0.0001.
Fig 6
Fig 6
Culture and identification of C. acnes. (A) Cultureomics workflow for C. acnes. (B) Colonies of breast microbes on Columbia blood agar. The yellow arrows indicate the traces of the colonies selected for MALDI-TOF MS. The red arrow indicates that the colony had been preliminarily confirmed as C. acnes by MALDI-TOF MS. (C) Analysis of the SCFAs (acetate, propionate, and butanoate) in the supernatant of C. acnes using HPLC-MS.
Fig 7
Fig 7
C. acnes inhibited BC cell growth. (A) Colony formation assays showed the proliferation of MDA-MB-231 and MCF-7 cells treated in either the absence or the presence of 20% C. acnes supernatant or 1 mM sodium propionate (SP). (B) Scratch assays of MDA-MB-231 cells (upper panel) and MCF-7 cells (lower panel) conducted in the absence or presence of either 20% C. acnes supernatant or 1 mM SP. (C) Transwell assays of MDA-MB-231 cells and MCF-7 cells conducted in the absence or presence of either 20% C. acnes supernatant or 1 mM SP (scale bar, 100 µm). **P < 0.01, and ***P < 0.001.
Fig 8
Fig 8
C. acnes exhibited an antitumor effect in vivo. (A) Experiment flowchart. MDA-MB-231 cells were subcutaneously implanted into BALB/c mice. After implantation, the mice were intratumorally injected with C. acnes or BHI every 3  days for 2  weeks. (B) Representative in situ images of tumors. The tumor growth in the C. acnes group was significantly inhibited. (C) Representative quantified graph of tumor weights. (D) Representative Ki-67 immunostaining of xenograft tumor tissues. Original magnification, ×20. Scale bar, 100  µm. *P <  0.05, *P < 0.01, and ***P <  0.001.

Similar articles

References

    1. Bray F, Laversanne M, Sung H, Ferlay J, Siegel RL, Soerjomataram I, Jemal A. 2024. Global cancer statistics 2022: GLOBOCAN estimates of incidence and mortality worldwide for 36 cancers in 185 countries. CA Cancer J Clin 74:229–263. doi: 10.3322/caac.21834 - DOI - PubMed
    1. Fernández MF, Reina-Pérez I, Astorga JM, Rodríguez-Carrillo A, Plaza-Díaz J, Fontana L. 2018. Breast Cancer and Its Relationship with the Microbiota. Int J Environ Res Public Health 15:1747. doi: 10.3390/ijerph15081747 - DOI - PMC - PubMed
    1. Nasir A, Bullo MMH, Ahmed Z, Imtiaz A, Yaqoob E, Jadoon M, Ahmed H, Afreen A, Yaqoob S. 2020. Nutrigenomics: epigenetics and cancer prevention: a comprehensive review. Crit Rev Food Sci Nutr 60:1375–1387. doi: 10.1080/10408398.2019.1571480 - DOI - PubMed
    1. Bodai BI, Nakata TE. 2020. Breast cancer: lifestyle, the human gut microbiota/microbiome, and survivorship. Perm J 24:19. doi: 10.7812/TPP/19.129 - DOI - PMC - PubMed
    1. Tzeng A, Sangwan N, Jia M, Liu C-C, Keslar KS, Downs-Kelly E, Fairchild RL, Al-Hilli Z, Grobmyer SR, Eng C. 2021. Human breast microbiome correlates with prognostic features and immunological signatures in breast cancer. Genome Med 13:60. doi: 10.1186/s13073-021-00874-2 - DOI - PMC - PubMed

LinkOut - more resources