. 2025 Aug 5;13(8):e0017325.
doi: 10.1128/spectrum.00173-25. Epub 2025 Jun 23.

Isolation, identification, and pathogenicity of Pseudoalteromonas aliena associated with oyster disease outbreaks in summer

Affiliations

Isolation, identification, and pathogenicity of Pseudoalteromonas aliena associated with oyster disease outbreaks in summer

Shuyi Mu et al. Microbiol Spectr. .

Abstract

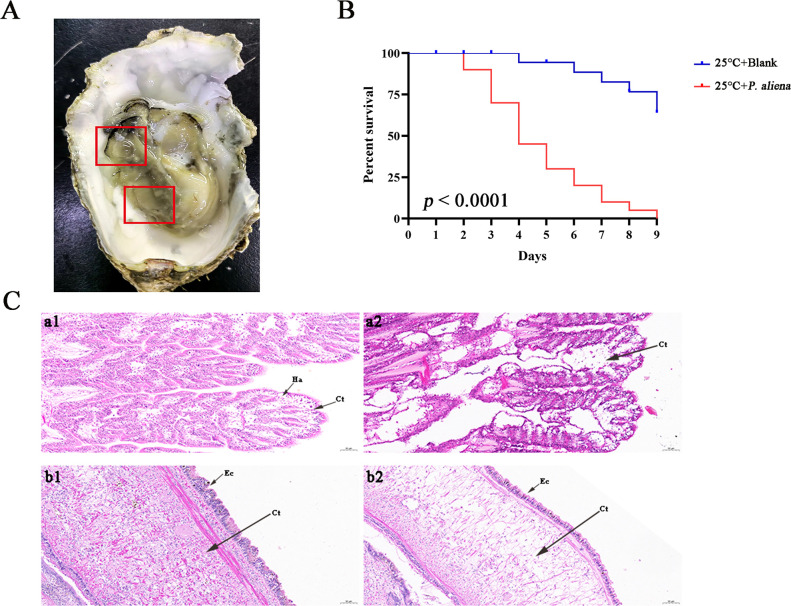
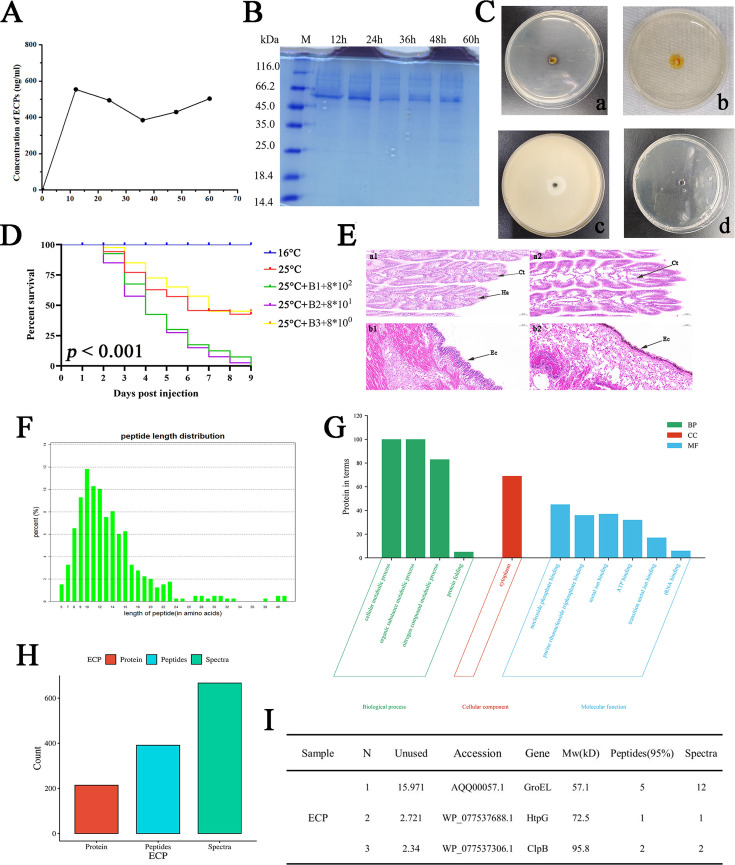
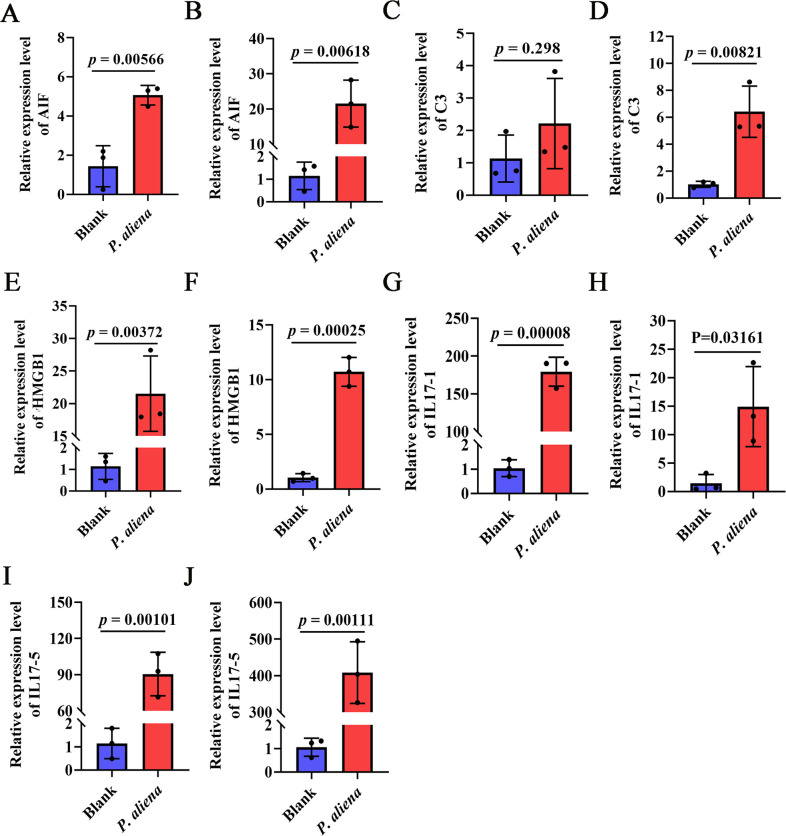
With the continuous expansion of oyster farming scale, disease has become one of the main obstacles to restricting the development of oyster farming. In the present study, 20 bacterial strains were identified from Crassostrea gigas with pustulosis, among which Pseudoalteromonas aliena emerged as the predominant strain, characterized by its rod-shaped morphology and possession of flagella. P. aliena exhibited α-hemolytic activity at 28°C and displayed high susceptibility to all 20 chemotherapeutic agents tested. After P. aliena infection, the oyster mortality rate increased. The gills were swollen and eroded, and the mantle was green with pustules after P. aliena infection. The gill filaments exhibited swelling and necrotic cells, and the mantle showed a loose histological structure with cavities and disruption of epithelial cells. The extracellular products (ECPs) from P. aliena had urease, protease, and amylase activities. The potential virulence proteins identified from ECPs were GroL, ClpB, and HtpG proteins. After injection with ECPs, there was an increase in the oyster mortality rate, and the observed symptoms in gill filaments and mantle were consistent with those observed after P. aliena infection. In addition, the mRNA expressions of inflammation- and programmed cell death-related genes were significantly upregulated in gills and mantle. The relative abundances of Vibrio, Arcobacter, and Pseudoalteromonas also exhibited a significant increase in the gills and mantle. The results demonstrated that P. aliena was the pathogenic bacterium for oysters, and its pathogenicity mechanism was systematically clarified, which provided valuable insights for the prevention and control of bacterial disease in oysters.IMPORTANCEDisease has currently emerged as one of the principal impediments to restricting the development of the oyster breeding industry. In the present study, Pseudoalteromonas aliena was identified from Crassostrea gigas with pustulosis. After P. aliena infection, the oyster mortality rate increased. The gills were swollen and eroded, and the mantle was green with pustules. Extracellular products (ECPs) from P. aliena had urease, protease, and amylase activities. The potential virulence proteins identified from ECPs were GroL, ClpB, and HtpG proteins. After injection with ECPs, the oyster mortality rate increased. The mRNA expressions of inflammation- and programmed cell death-related genes in gills and mantle increased significantly, and the relative abundances of Vibrio, Arcobacter, and Pseudoalteromonas exhibited a significant increase after P. aliena infection. The results demonstrated that P. aliena was the pathogenic bacterium for oysters, and its pathogenicity mechanism was systematically clarified, which provided valuable insights for the prevention and control of bacterial disease in oysters.

Keywords: 16S rRNA; Crassostrea gigas; Pseudoalteromonas aliena; inflammation; pathogenicity.


Conflict of interest statement

The authors declare no conflict of interest.

Figures

Fig 1
Fig 1
Identification, isolation, and physiological and biochemical characteristics of P. aliena. (A) The bacterial strains were isolated from diseased oysters. (B) The phylogenetic tree was constructed using the nucleotide sequence of P. aliena and those from the other 10 Pseudoalteromonas species. The scale bar corresponds to 0.05 substitutions per site. (C) The morphological characteristics of P. aliena were observed by TEM. (D) The growth curve of P. aliena under the cultivation conditions at 28°C. (E) The hemolysis assay of P. aliena cultured at 28°C and 37°C for 72 h. (F) Physiological and biochemical indices of P. aliena. Note: “+,” positive; “−,” negative. (G) Drug sensitivity of P. aliena. Note: R, resistant; I, weak sensitive; S, sensitive. A value represents the mean ± S.D. (N = 3).
Fig 2
Fig 2
The appearance, mortality rate, and tissue sections of oysters after P. aliena infection. (A) The symptoms of oyster after immersion experiment with P. aliena. (B) Survival curves of oyster infected with P. aliena at 25°C. X axis, days. Y axis, oyster survival rate. The survival rate was recorded every day, n = 20. (C) H&E-stained histological sections of tissues in the immersion experiment. a, Gills; b, mantle; 1, untreated group; 2, infection group; Ha, hemocyte; Ct, connective tissue; Ec, epithelial cell.
Fig 3
Fig 3
Extraction and analysis of ECPs from P. aliena, as well as the oyster mortality rate and tissue sections after ECP stimulation. (A) Concentration of ECPs under different culture times. (B) The SDS-PAGE analysis of ECPs. (C) The enzyme activity assay of ECPs. a, Amylase detection plate; b, urease detection plate; c, proteinase detection plate; d, lipase detection plate. (D) Cumulative survival rate of oysters after ECPs stimulation. X axis, days post-infection. Y axis, oyster survival rate. The survival rate was recorded every day for 9 days, n = 40. (E) Histological sections of oysters after ECPs stimulation. a, Gills; b, mantle; 1, untreated group; 2, ECPs stimulation group; Ha, hemocyte; Ct, connective tissue; Ec, epithelial cell. (F) Peptide mass deviation distribution of ECPs. (G) The statistics of ECPs by GO analysis. (H) The total protein of ECPs. (I) Pathogenesis-related proteins in ECPs.
Fig 4
Fig 4
The relative mRNA expression levels of non-inflammatory programmed cell death-related genes in gills and mantle after P. aliena infection. (A, C, E, G, I, and K) The mRNA expression levels of CgFerritin, CgGPX4, CgSLC40A1, CgDLAT, CgFDX1, and CgSLC31A1 in gills. (B, D, F, H, J, and L) The mRNA expression levels of CgFerritin, CgGPX4, CgSLC40A1, CgDLAT, CgFDX1, and CgSLC31A1 in the mantle. P. aliena: P-1. Error bars represent the mean ± S.D. (N = 3).
Fig 5
Fig 5
The relative mRNA expression levels of inflammatory programmed cell death-related genes in gills and mantle after P. aliena infection. (A, C, E, G, and I) The mRNA expression levels of CgATG5, CgLC3, CgP62, CgCaspase3, and CgCaspase8 in gills. (B, D, F, H, and J) The mRNA expression levels of CgATG5, CgLC3, CgP62, CgCaspase3, and CgCaspase8 in mantle. P. aliena: P-1. Error bars represent the mean ± S.D. (N = 3).
Fig 6
Fig 6
The relative mRNA expression levels of inflammation-related genes in gills and mantle after P. aliena infection. (A, C, E, G, and I) The mRNA expression levels of CgAIF1, CgC3, CgHMGB1, CgIL17-1, and CgIL17-5 in gills. (B, D, F, H, and J) The mRNA expression levels of CgAIF1, CgC3, CgHMGB1, CgIL17-1, and CgIL17-5 in mantle. P. aliena: P-1. Error bars represent the mean ± S.D. (N = 3).
Fig 7
Fig 7
Analysis of the bacterial communities in gills and mantle after P. aliena infection. (A and G) Venn diagram analysis depicting the numbers of shared and unique ASVs among the control and challenged groups in the gills and mantle. (B and H) Alpha diversity of the Chao1 index comparisons in gills and mantle microbiota among the control and challenged groups. (C and I) Alpha diversity of Shannon index comparisons in gills and mantle microbiota among the control and challenged groups. (D and J) PCoA analysis of microbiota in gills and mantle among the control and challenged groups based on the Bray-Curtis distance metrics. (E and K) The composition of the microbiota in gills and mantle among the control and challenged groups at the phylum level. The top ten abundant phyla were shown, and the rest were indicated as “Others.” (F and L) Composition of microbiota in gills and mantle among the control and challenged groups at the genus level. The top ten abundant genera were shown, and the rest were indicated as “Others.”

Similar articles

References

    1. Zhang G, Li L, Meng J, Qi H, Qu T, Xu F, Zhang L. 2016. Molecular basis for adaptation of oysters to stressful marine intertidal environments. Annu Rev Anim Biosci 4:357–381. doi: 10.1146/annurev-animal-022114-110903 - DOI - PubMed
    1. Morita M, Schmidt EWJNPR. 2018. Parallel lives of symbionts and hosts: chemical mutualism in marine animals. Nat Prod Rep 35:357–378. doi: 10.1039/c7np00053g - DOI - PMC - PubMed
    1. De Schryver P, Vadstein O. 2014. Ecological theory as a foundation to control pathogenic invasion in aquaculture. ISME J 8:2360–2368. doi: 10.1038/ismej.2014.84 - DOI - PMC - PubMed
    1. Beaz-Hidalgo R, Balboa S, Romalde JL, Figueras MJ. 2010. Diversity and pathogenecity of Vibrio species in cultured bivalve molluscs. Environ Microbiol Rep 2:34–43. doi: 10.1111/j.1758-2229.2010.00135.x - DOI - PubMed
    1. Gómez-León J, Villamil L, Lemos ML, Novoa B, Figueras A. 2005. Isolation of Vibrio alginolyticus and Vibrio splendidus from aquacultured carpet shell clam (Ruditapes decussatus) larvae associated with mass mortalities. Appl Environ Microbiol 71:98–104. doi: 10.1128/AEM.71.1.98-104.2005 - DOI - PMC - PubMed

MeSH terms

LinkOut - more resources