

Characterizing PET CT patterns and bacterial dissemination features of tuberculosis relapse in the macaque model
- PMID: 40548727
- PMCID: PMC12341373
- DOI: 10.1128/iai.00177-25
Characterizing PET CT patterns and bacterial dissemination features of tuberculosis relapse in the macaque model
Abstract
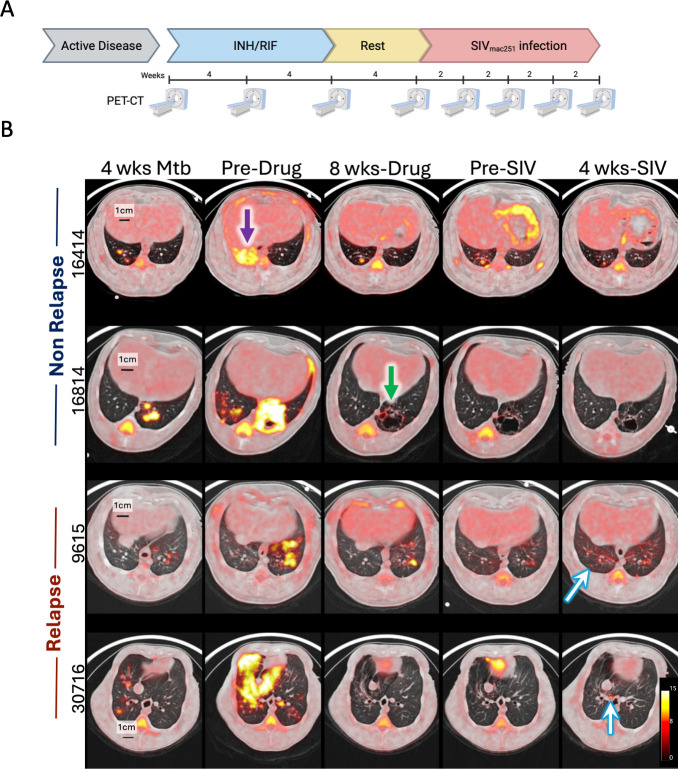
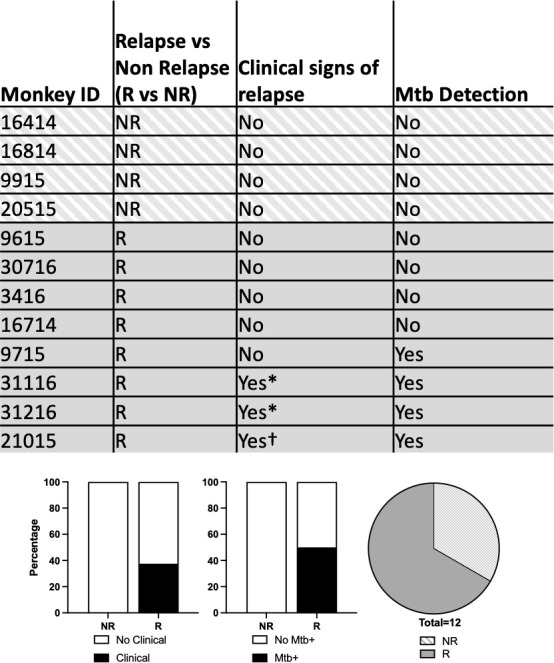
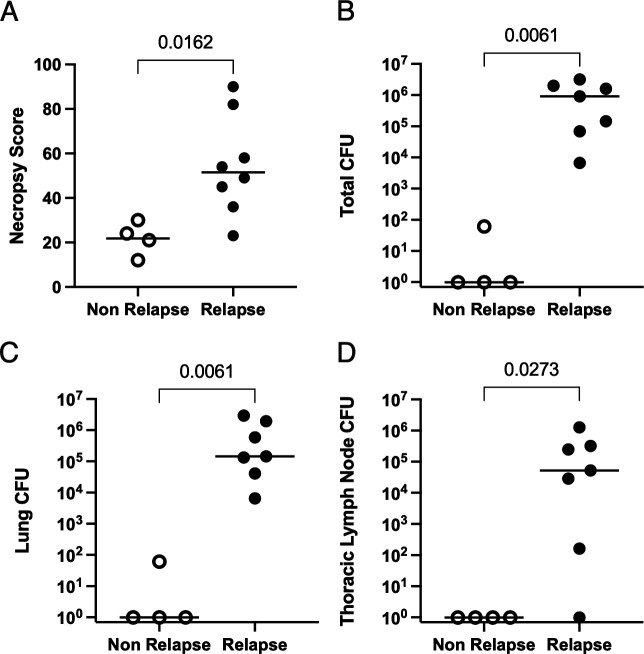
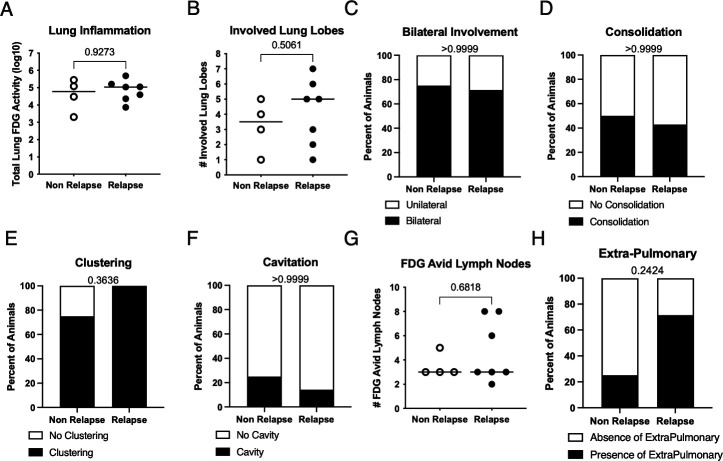
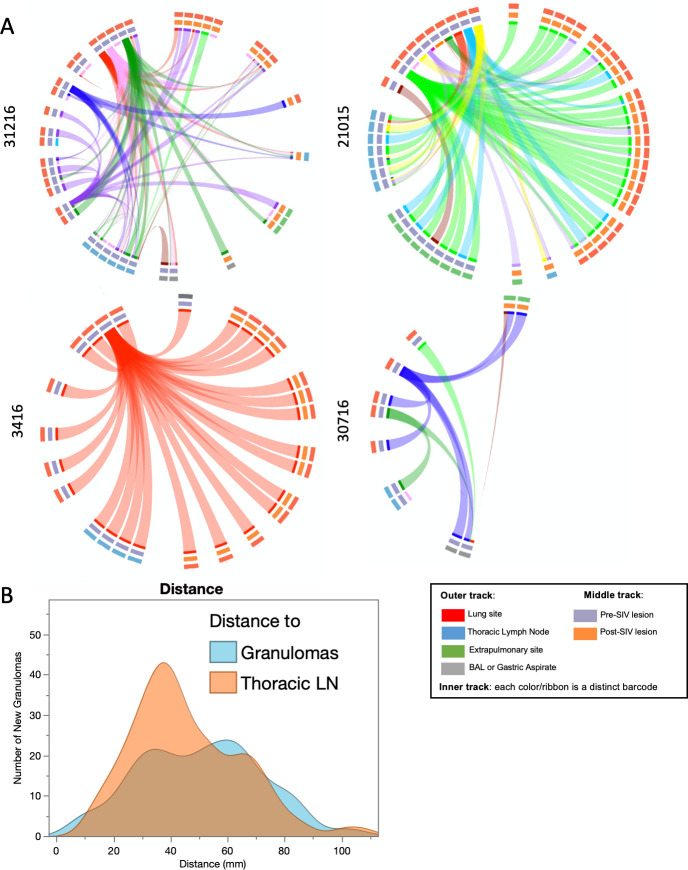
Tuberculosis (TB) relapse after appropriate drug treatment is poorly understood but critical to developing shorter treatment regimens. Using a cynomolgus macaque model of human TB, macaques with active TB disease were treated with a short course of isoniazid and rifampin and subsequently infected with SIV. Serial clinical, microbiologic, immunologic, and position emission and computed tomography (PET CT) assessments were performed to identify risk factors of relapse. Of the 12 animals, eight developed radiologically defined relapse, including four that had clinical and/or microbiologic signs. Greater gross pathology and bacterial burden were observed in relapse animals. PET CT characteristics before, during, and at the end of the treatment were similar among relapse and non-relapse animals. We show that complete sterilization or very low Mtb burden is protective against SIV-induced TB relapse but cannot be predicted by PET CT. Using barcoded M. tuberculosis, we found that Mtb dissemination during relapse originated from both lung and thoracic lymph nodes, underscoring the importance of lymph nodes as a reservoir. By matching barcoded Mtb and serial PET CT, we also demonstrate that not every site of persistent Mtb growth after drug treatment is capable of dissemination and relapse, underscoring the complex nature of drug treatment and relapse.
Keywords: HIV; PET CT; relapse; tuberculosis.
Conflict of interest statement
The authors declare no conflict of interest.
Figures
Update of
-
Characterizing PET CT patterns and bacterial dissemination features of tuberculosis relapse in the macaque model.bioRxiv [Preprint]. 2025 Apr 5:2025.03.31.646419. doi: 10.1101/2025.03.31.646419. bioRxiv. 2025. Update in: Infect Immun. 2025 Aug 12;93(8):e0017725. doi: 10.1128/iai.00177-25. PMID: 40236101 Free PMC article. Updated. Preprint.
Similar articles
-
Characterizing PET CT patterns and bacterial dissemination features of tuberculosis relapse in the macaque model.bioRxiv [Preprint]. 2025 Apr 5:2025.03.31.646419. doi: 10.1101/2025.03.31.646419. bioRxiv. 2025. Update in: Infect Immun. 2025 Aug 12;93(8):e0017725. doi: 10.1128/iai.00177-25. PMID: 40236101 Free PMC article. Updated. Preprint.
-
Six-month therapy for abdominal tuberculosis.Cochrane Database Syst Rev. 2016 Nov 1;11(11):CD012163. doi: 10.1002/14651858.CD012163.pub2. Cochrane Database Syst Rev. 2016. PMID: 27801499 Free PMC article.
-
Host Immunity to Mycobacterium tuberculosis Infection Is Similar in Simian Immunodeficiency Virus (SIV)-Infected, Antiretroviral Therapy-Treated and SIV-Naïve Juvenile Macaques.Infect Immun. 2023 May 16;91(5):e0055822. doi: 10.1128/iai.00558-22. Epub 2023 Apr 11. Infect Immun. 2023. PMID: 37039653 Free PMC article.
-
Xpert MTB/XDR for detection of pulmonary tuberculosis and resistance to isoniazid, fluoroquinolones, ethionamide, and amikacin.Cochrane Database Syst Rev. 2022 May 18;5(5):CD014841. doi: 10.1002/14651858.CD014841.pub2. Cochrane Database Syst Rev. 2022. PMID: 35583175 Free PMC article.
-
Xpert® MTB/RIF assay for extrapulmonary tuberculosis and rifampicin resistance.Cochrane Database Syst Rev. 2018 Aug 27;8(8):CD012768. doi: 10.1002/14651858.CD012768.pub2. Cochrane Database Syst Rev. 2018. Update in: Cochrane Database Syst Rev. 2021 Jan 15;1:CD012768. doi: 10.1002/14651858.CD012768.pub3. PMID: 30148542 Free PMC article. Updated.
Cited by
-
Using Imaris to rigorously track PET-defined sites of lung inflammation in Mycobacterium tuberculosis-exposed non-human primates.bioRxiv [Preprint]. 2025 Jul 7:2025.07.04.663191. doi: 10.1101/2025.07.04.663191. bioRxiv. 2025. PMID: 40672288 Free PMC article. Preprint.
References
-
- World Health Organization . 2024. Global tuberculosis report 2024. World Health Organization, Geneva, Switzerland.
MeSH terms
Substances
Grants and funding
LinkOut - more resources
Full Text Sources
Medical
