. 2025 Aug 5;13(8):e0197324.
doi: 10.1128/spectrum.01973-24. Epub 2025 Jun 23.

Integrating taxonomic and phenotypic information through FISH-enhanced flow cytometry for microbial community dynamics analysis

Affiliations

Integrating taxonomic and phenotypic information through FISH-enhanced flow cytometry for microbial community dynamics analysis

Valérie Mattelin et al. Microbiol Spectr. .

Abstract

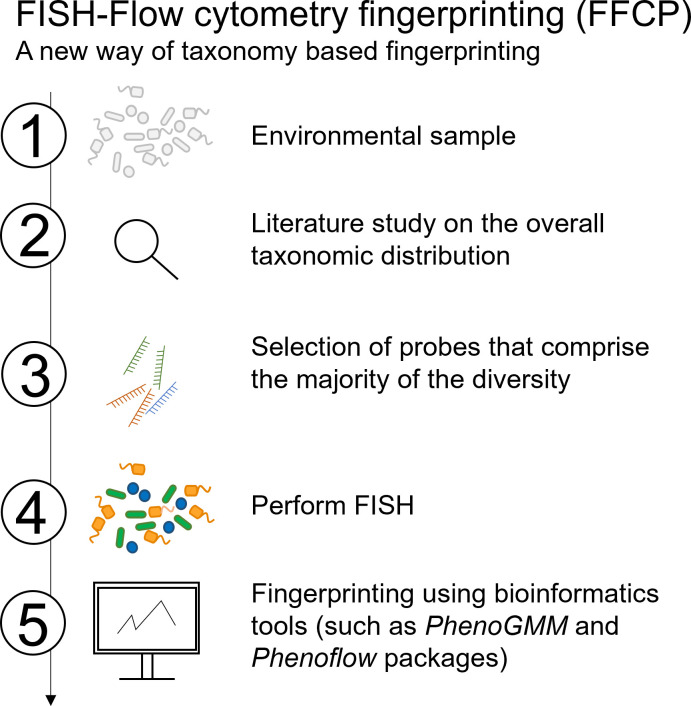
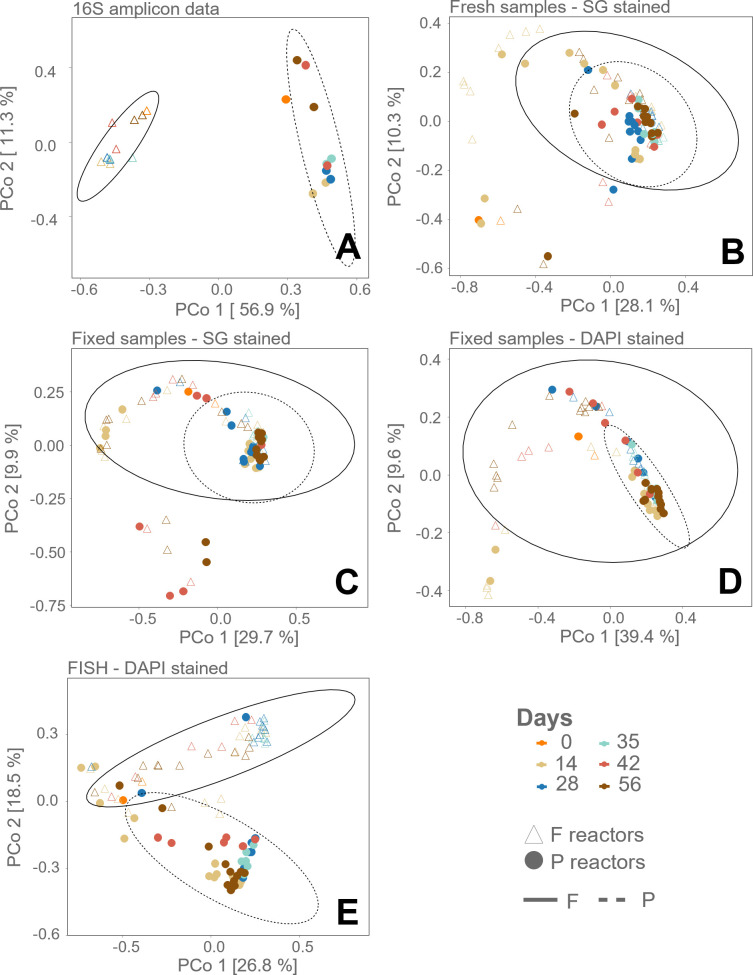
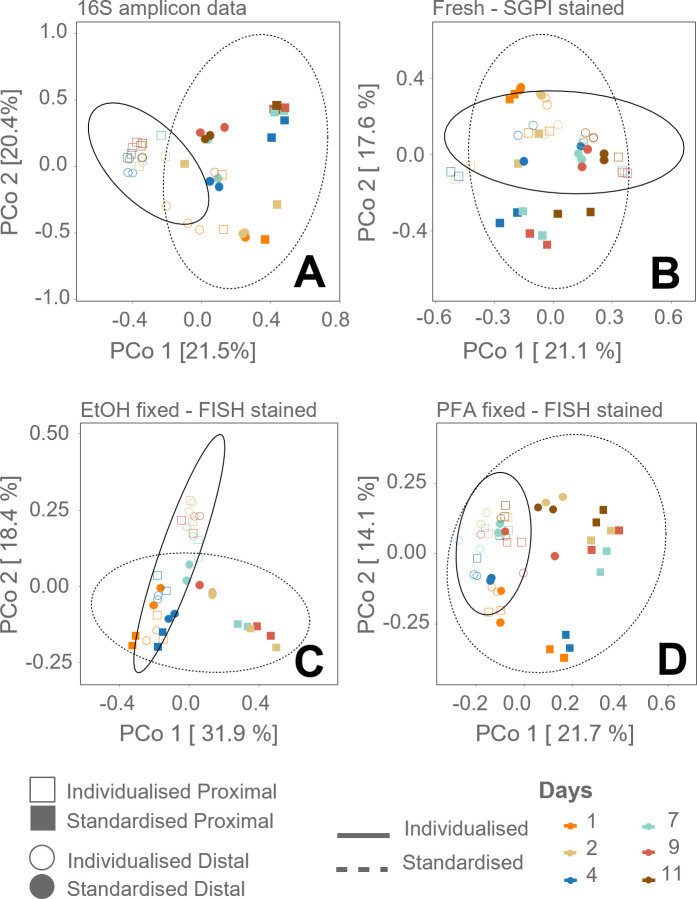
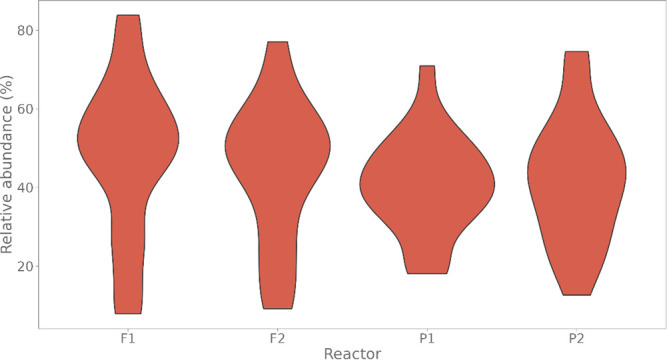
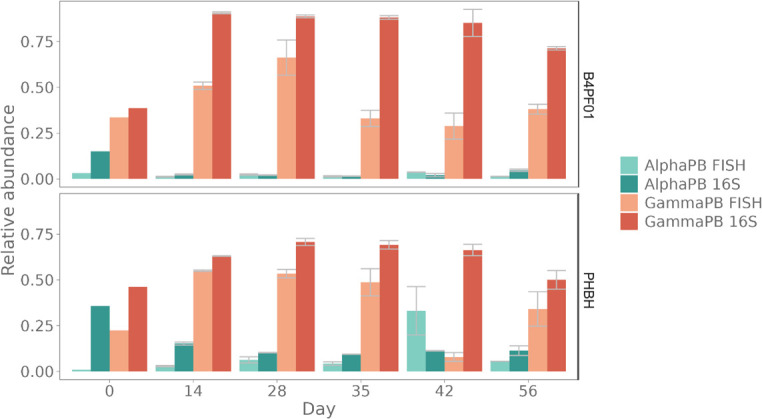
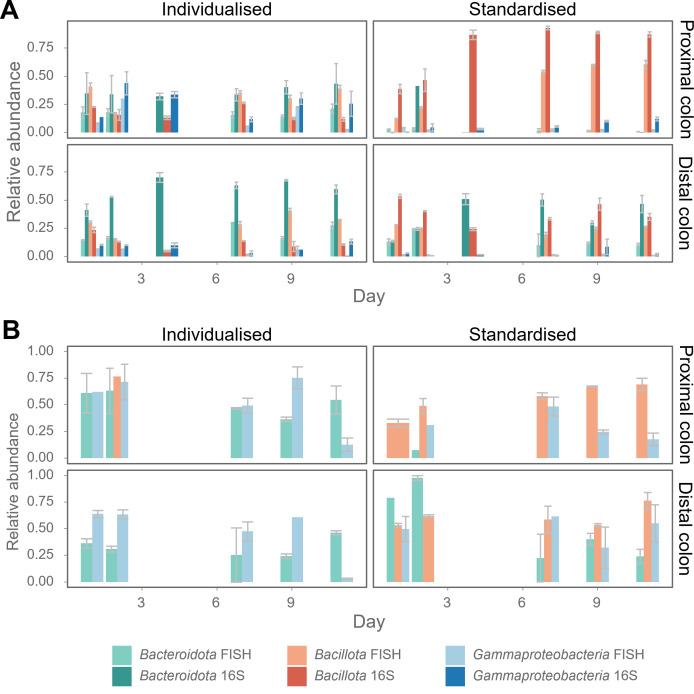
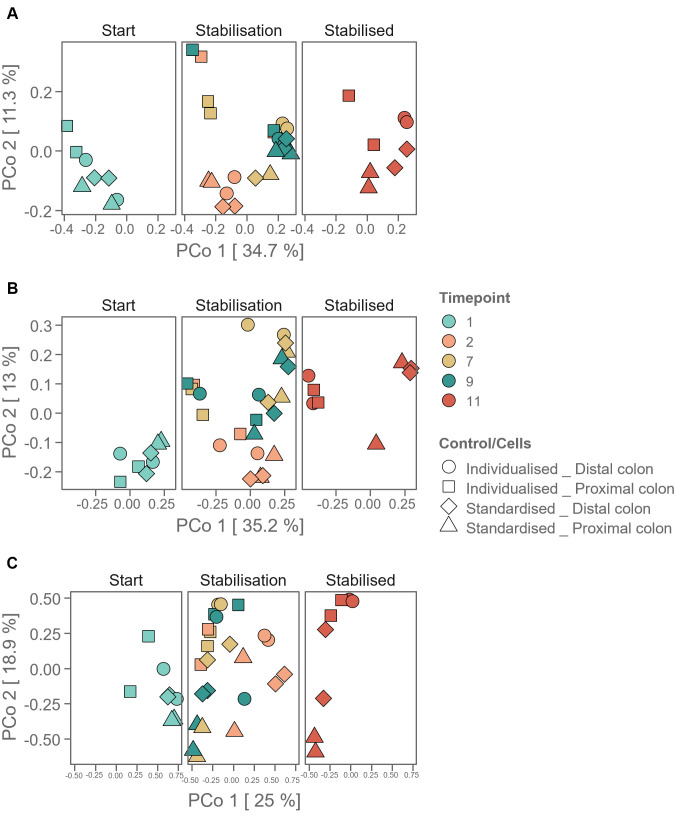
Flow cytometry is a powerful tool to monitor microbial communities, as it allows tracking both changes in the subpopulations and cell numbers at high throughput and a low sample cost. This information can be combined in a phenotypic fingerprint that can be leveraged for diversity analysis. However, as isogenic individuals can manifest phenotypic diversity, for example, due to differing physiological state and phenotypic plasticity, combining the phenotypic information with taxonomic information adds an extra dimension for describing the dynamics of a microbial community. In this research, taxonomic information was incorporated in the microbial fingerprint through fluorescent in situ hybridization (FISH) at a single-cell level. To validate this concept and explore its versatility, two ecosystems with different micro-biodiversity were considered. In the first environment, marine bacteria were monitored for plastic biodegradation in a trickling filter, and in the second, an in vitro simulated human gut microbiome was followed over time. Samples were prepared using different (staining) methods, including FISH, and beta diversity analysis was used to evaluate the level of distinction between differently treated groups in both environments. As a reference to correlate increased distinction with the incorporation of taxonomic information, 16S rRNA gene sequencing was used. Finally, a predictive algorithm was trained to correctly classify samples in the differently treated groups. The results showed that the implementation of FISH in flow cytometry provides more information on a single-cell level to answer specific scientific questions, like distinguishing between phenotypically similar communities or following a specific taxonomic group over time.

Importance: Understanding microbial communities is crucial for elucidating their role in maintaining ecosystem health and stability. Researchers are increasingly interested in studying microbial communities by looking at not just their genetic makeup but also their physical traits and functions. In our study, we used common techniques like fluorescence in situ hybridization and flow cytometry, along with advanced data analysis, to better understand these communities. This combination allowed us to gather and use data more effectively, demonstrating that these easy-to-use methods, when paired with proper analysis, can enhance our understanding of changing microbial ecosystems.

Keywords: flow cytometry; fluorescence in situ hybridization; microbial community dynamics; phenotypic fingerprinting.


Conflict of interest statement

The authors declare no conflict of interest.

Figures

Fig 1
Fig 1
Proposed workflow when applying FISH-enhanced flow cytometry starting from (1) (environmental) mixed-culture samples (2). Screening the overall taxonomic structure of the samples based on literature (3), followed by a selection of probes covering the most important taxa (4), performing FISH and flow cytometry measurements, after which (5) packages such as Phenoflow (4) and PhenoGMM (30) can be applied. Modified from Mermans et al. (31).
Fig 2
Fig 2
PCoA diversity analysis of the marine trickling filter samples, based on Bray-Curtis dissimilarity matrix calculated from (A) 16S rRNA gene amplicon sequencing, (B) SG staining of live cells, (C) SG staining of PFA-fixed cells, (D) DAPI staining of PFA-fixed cells, and (E) FISH and DAPI staining of PFA-fixed cells. The different reactors, based on plastic material (P: PHBH-fed, F: B4PF01-fed), are displayed by empty (○) and full (●) circles. The ellipse is drawn on the 95% confidence level.
Fig 3
Fig 3
PCoA diversity analysis of the simulated gut samples, based on Bray-Curtis dissimilarity matrix calculated based on (A) 16S rRNA gene amplicon sequencing, (B) SGPI staining, (C) DAPI and FISH labeling of EtOH-fixed cells, and (D) DAPI and FISH labeling of PFA-fixed cells. The different reactors, based on individualized/standardized SHIME operation and distal/proximal colon vessel, are displayed by empty (○,□) and full (●, ■) circles and squares. Biological duplicates are shown. The ellipse is drawn on the 95% confidence level (based only on SHIME operation settings: individualized and standardized).
Fig 4
Fig 4
The relative amount of FISH-positive cells of the marine trickling filter samples (FISH stained by EUBmix, which consists of a mixture of EUBI, EUBII, and EUB III in a ratio of 1:1:1, targeting all cells), compared to the DAPI-stained cells. The different reactors are displayed on the x-axis: communities were grown in two separate trickling filter bioreactors, with two different plastic types, in duplicate (PHBH, referred to as P1 and P2, and a bioplastic, referred to as F1 and F2) (n = 24).
Fig 5
Fig 5
Comparison of cells of the marine trickling filter samples classified as Alpha- (AlphaPB) and Gammaproteobacteria (GammaPB) by copy number corrected, identified reads from 16S rRNA gene amplicon sequencing and FISH. Biological duplicate reactors were averaged, and the standard error is shown.
Fig 6
Fig 6
(A) Comparison of 16S rRNA gene amplicon sequencing data (copy number corrected, identified reads) and FISH data of in vitro simulated gut samples. These samples were derived from a SHIME either individualized (with individualized feeding frequencies, media, and transit time based on each fecal donor, Supporting Information S1) or using the standardized protocol (with fixed feeding frequencies, media, and transit time, Supporting Information S1) (24). Biological replicates were averaged, and standard error is shown. In blue, two different taxonomic levels are displayed. The Gammaproteobacteria were targeted by FISH, while the sequencing abundance displays the higher classification rank of Proteobacteria. However, the sequencing data reveal that almost 100% of the Proteobacteria are classified as Gammaproteobacteria. (B) The ratio of FISH/16S rRNA gene amplicon sequencing relative abundances representing the potentially active fraction of the population. Values exceeding 1 were omitted.
Fig 7
Fig 7
PCoA diversity analysis of the simulated gut samples calculated on the FISH-stained cells of the taxonomic group Bacillota (Bary-Curtis dissimilarity matrix) by Phenoflow (4). The different vessels and conditions are indicated by different shapes, and different time points by color. The panels represent the different phases that occur during the start-up of a SHIME system (start—stabilization and stabilized). (A) Fingerprinting of all cells, including the FISH labeling; (B) Fingerprinting of the FISH-labeled Bacillota cells (C) Fingerprinting of the Bacillota classified ASVs.

Similar articles

References

    1. Koch C, Fetzer I, Schmidt T, Harms H, Müller S. 2013. Monitoring functions in managed microbial systems by cytometric bar coding. Environ Sci Technol 47:1753–1760. doi: 10.1021/es3041048 - DOI - PubMed
    1. Ludwig J, Zu Siederdissen CH, Liu Z, Stadler PF, Müller S. 2019. flowEMMi: an automated model-based clustering tool for microbial cytometric data. BMC Bioinformatics 20:643. doi: 10.1186/s12859-019-3152-3 - DOI - PMC - PubMed
    1. Özel Duygan BD, van der Meer JR. 2022. Recent advances in microbial community analysis from machine learning of multiparametric flow cytometry data. Curr Opin Biotechnol 75:102688. doi: 10.1016/j.copbio.2022.102688 - DOI - PubMed
    1. Props R, Monsieurs P, Mysara M, Clement L, Boon N. 2016. Measuring the biodiversity of microbial communities by flow cytometry. Methods Ecol Evol 7:1376–1385. doi: 10.1111/2041-210X.12607 - DOI
    1. De Vrieze J, Boon N, Verstraete W. 2018. Taking the technical microbiome into the next decade. Environ Microbiol 20:1991–2000. doi: 10.1111/1462-2920.14269 - DOI - PubMed

Substances

LinkOut - more resources