. 2025 Jun;29(12):e70643.
doi: 10.1111/jcmm.70643.

Circadian Gene NPAS2 Relieves Hypertrophic Scar Formation via CDC25A-Mediated Fibroblasts Activity

Affiliations

Circadian Gene NPAS2 Relieves Hypertrophic Scar Formation via CDC25A-Mediated Fibroblasts Activity

Pei Wei et al. J Cell Mol Med. 2025 Jun.

Abstract

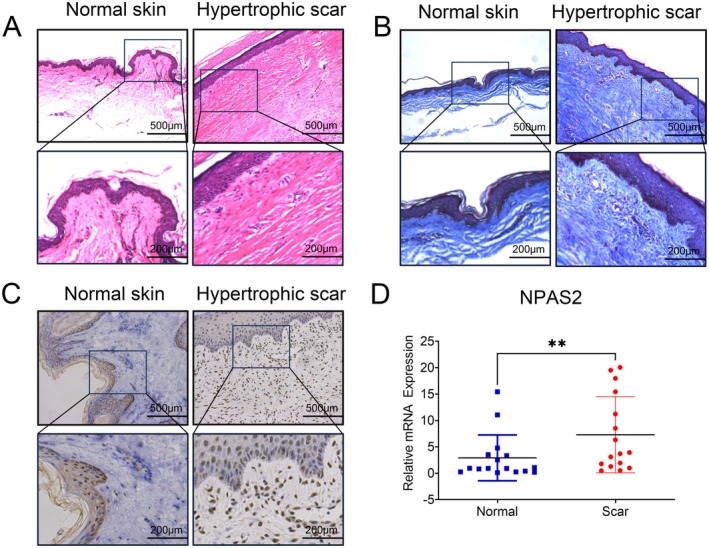
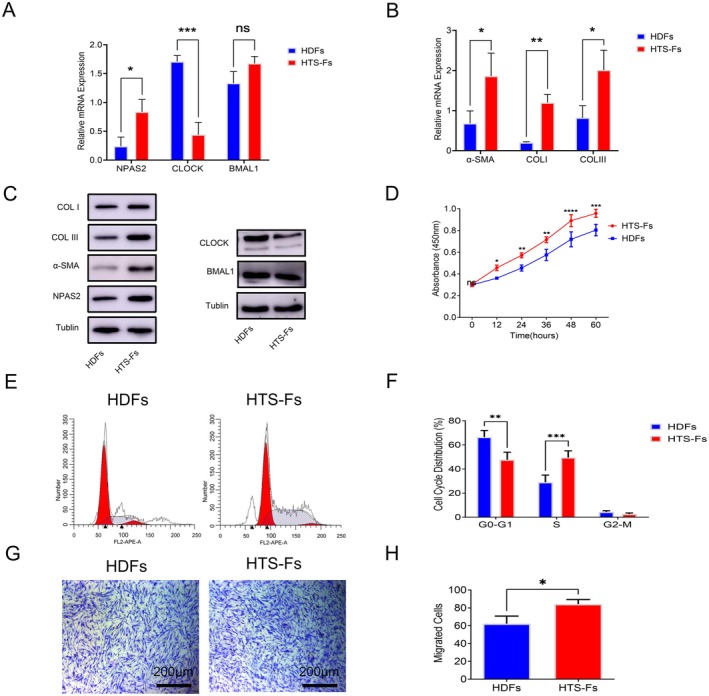
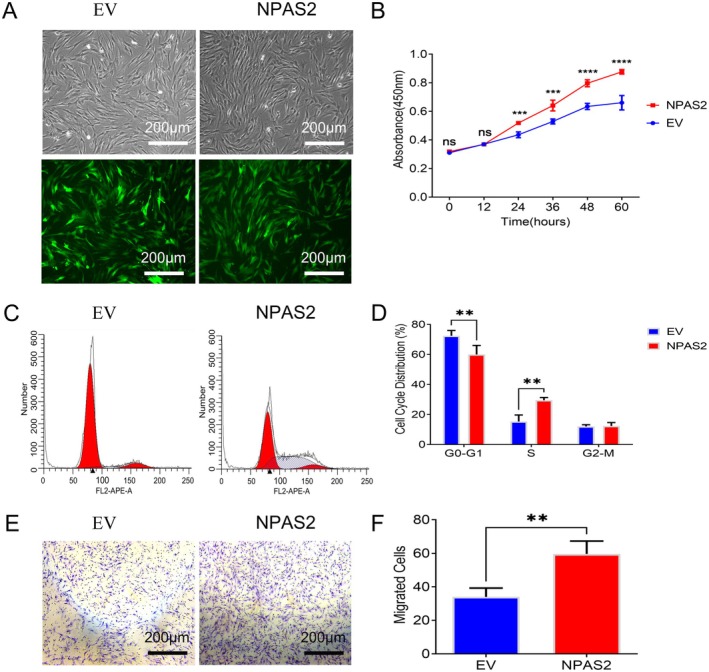
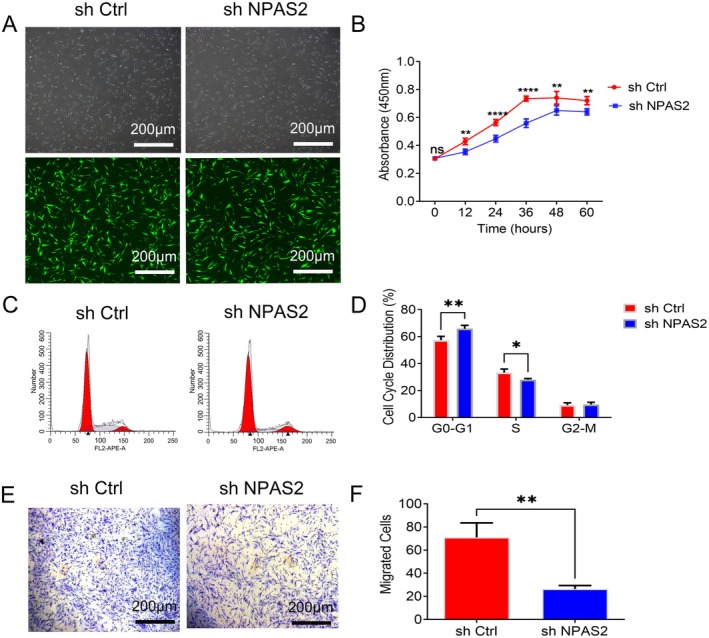
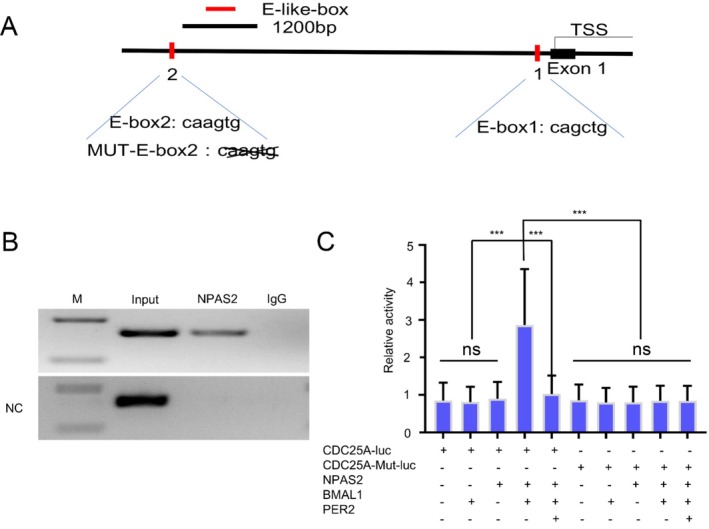
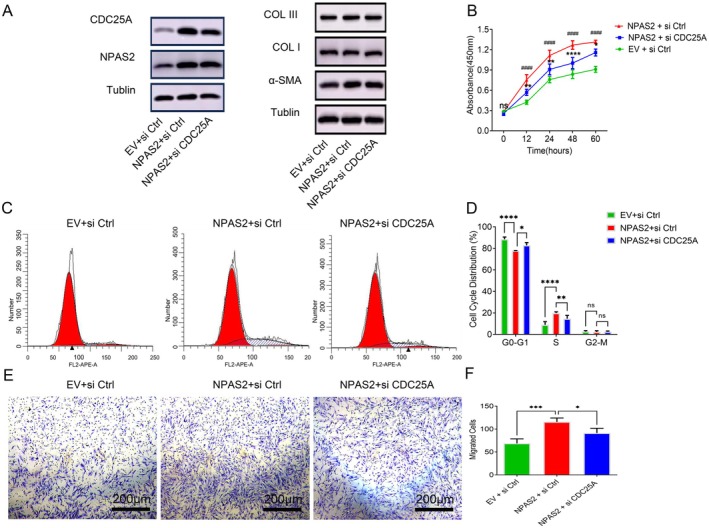
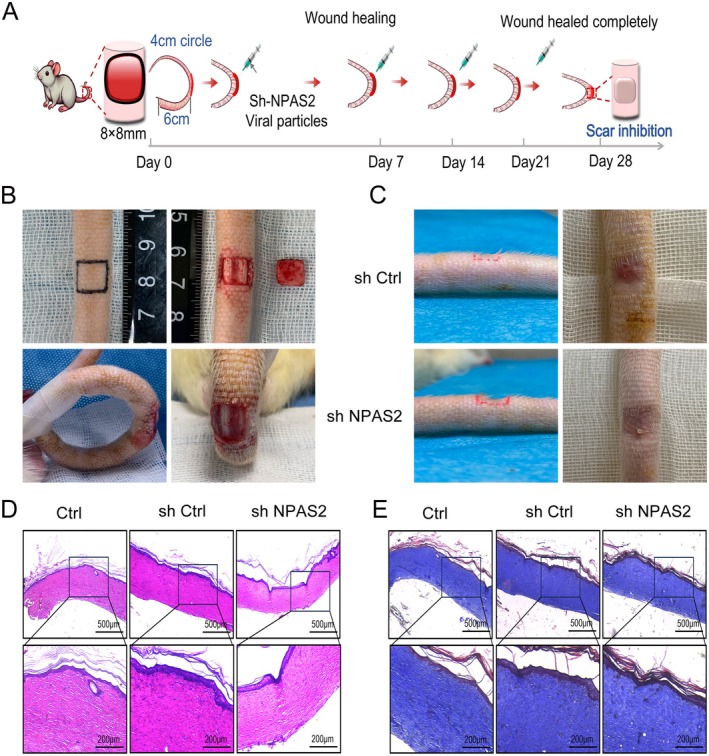
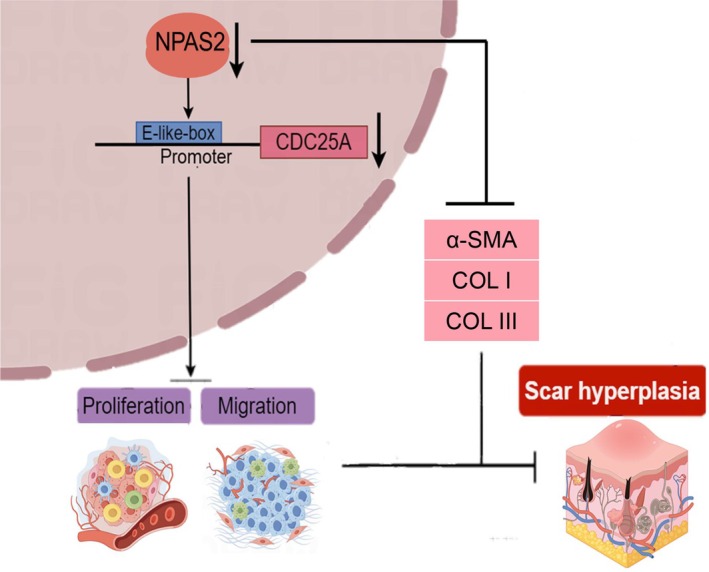
Neuronal PAS domain protein 2 (NPAS2) is critical in tissue fibrosis. Hypertrophic scars (HTS), a form of skin fibrosis, are characterised by excessive myofibroblast proliferation and abnormal extracellular matrix (ECM) deposition. However, whether NPAS2 contributes to skin fibrosis and the development of HTS remains unclear. In this study, the expression of NPAS2 between normal skin and hypertrophic scars (HTS) was assessed using RT-qPCR and immunohistochemistry (IHC). Human dermal fibroblasts (HDFs) and HTS-derived fibroblasts (HTS-Fs) were isolated from normal skin and HTS, respectively. NPAS2 was knocked down in HTS-Fs and overexpressed in HDFs via gene transfection. Cell proliferation and migration of transfected HTS-Fs and HDFs were analysed using flow cytometry, CCK-8 and transwell assays. The expressions of NPAS2, CLOCK, BMAL1, COL I, COL III, α-SMA and CDC25A were evaluated by western blotting and RT-qPCR. Dual-luciferase reporter assays and chromatin immunoprecipitation (ChIP) identified the regulatory effect of NPAS2 on CDC25A. In vivo, an 8 × 8 mm full-thickness skin defect was created on the tail of SD rats, with viral particles (1 × 10⁷) of r-plenR-sh-NPAS2 or r-plenR-NPAS2-NC injected subcutaneously at the wound edges weekly. Tissue samples, histopathological analyses and photographs were taken until the wound healed completely. The results indicated that NPAS2 was significantly upregulated in HTS. The proliferation, migration, and expression of COL I, COL III, and α-SMA were higher in HDFs overexpressing NPAS2 than those of HDFs themselves. In contrast, the behaviours mentioned above of HTS-Fs knocking down NPAS2 were lower than that of HTS-Fs. Mechanistically, the migration and proliferation promoting effect of NPAS2 was mediated by the binding of NPAS2 to the E-like-box of CDC25A. In vivo, compared with the r-plenR-NPAS2-NC group, the re-epithelialised regions of r-plenR-sh-NPAS2 were pink, flat and as large as the initial wound. In addition, their dermal structures were similar to skin and possessed loose and regular collagen arrangement which was parallel to the epidermis. Take together, these findings suggested that compared with HDFs, NPAS2 was upregulated in HTS-Fs. NPAS2 promoted the activation of HDFs, which is characterised by stronger proliferation and migration and the higher level of α-SMA, COL I and COL III. In which, the proliferation and migration effects of NPAS2 were mediated by CDC25A. Furthermore, NPAS2 knocked down in rat tail wounds inhibited the HTS formation. Therefore, NPAS2 may serve as a potential therapeutic target for HTS in the future.

Keywords: CDC25A; NPAS2; circadian clock; fibrosis; hypertrophic scar.


Conflict of interest statement

The authors declare no conflicts of interest.

Figures

FIGURE 1
FIGURE 1
NPAS2 was upregulated in HTS tissues. (A, B) H&E staining and Masson's trichrome staining of HTS and normal skin tissues. (C) IHC staining for NPAS2 of HTS and normal skin tissues. (D) RT‐qPCR analyses for the mRNA expression level of NPAS2 in 16 paired tissues of normal skin and HTS. Scale bar, 500 and 200 μm. **p < 0.01.
FIGURE 2
FIGURE 2
The heterogeneity in biological property of HDFs and HTS‐Fs. (A–C) RT‐qPCR and Western blot analyses for the expression levels of NPAS2, CLOCK, BMAL1, α‐SMA, COL I and COL III in HDFs and HTS‐Fs. (D) Proliferative activity of HDFs and HTS‐Fs was evaluated by CCK‐8 assay. (E, F) Cell cycle distribution of HDFs and HTS‐Fs was performed by flow cytometry. (G, H) Migration of HDFs and HTS‐Fs was assessed by transwell assay. Data shown are the mean ± SD. Scale bar, 200 μm. ns, not significant; *p < 0.05; **p < 0.01; ***p < 0.001; ****p < 0.0001.
FIGURE 3
FIGURE 3
NPAS2 overexpression in HDFs promoted its biological characteristics. (A) Green fluorescent labelled lentiviral vectors overexpressed NPAS2 and control were successfully transfected into HDFs. (B) Proliferative activity of EV and NPAS2 was evaluated by CCK‐8 assay. (C, D) Cell cycle distribution of EV and NPAS2 was assessed by flow cytometry. (E) Transwell assay was applied to detect the migratory ability of EV and NPAS2. (F) Quantitative analysis of the migrated cells in (E). NPAS2, HDFs transfected with lentiviral vector overexpression NPAS2; EV, HDFs transfected with control vector. Data shown are the mean ± SD. Scale bar, 200 μm. ns, not significant; **p < 0.01; ***p < 0.001; ****p < 0.0001.
FIGURE 4
FIGURE 4
NPAS2 knocking down in HTS‐Fs inhibited its biological characteristics. (A) Green fluorescent labelled lentiviral vectors knocked down NPAS2 and control ones were successfully transfected into HSFs. (B) Proliferative activity of sh Ctrl and sh NPAS2 was evaluated by CCK‐8 assay. (C, D) Cell cycle distribution was performed for sh Ctrl and sh NPAS2 groups. (E, F) Transwell assay for the migrated cells of sh Ctrl and sh NPAS2. sh NPAS2, HTS‐Fs transfected with lentiviral vector knocking out NPAS2; sh Ctrl, HTS‐Fs transfected with control vector. Data shown are the mean ± SD. Scale bar, 200 μm. ns, not significant; *p < 0.05; **p < 0.01; ***p < 0.001; ****p < 0.0001.
FIGURE 5
FIGURE 5
NPAS2 transcriptionally upregulated CDC25A. (A) Schematic of the E‐like boxes in the CDC25A promoter, in which NO. 1 represents −66 to −72 bp and NO. 2 represents −866 to −872 bp. (B) PCR amplification products of the CDC25A promoter sequence from ChIP DNA were detected by gel electrophoresis. Input and IgG served as positive and negative controls, respectively. In the NC (negative control) group, the CDC25A promoter lacked NO. 2 E‐like box. (C) CDC25A luciferase activity was detected by dual luciferase reporter assay. CDC25A‐luc, CDC25A‐mut‐luc, BMAL1, NPAS2 and PER2 were cotransfected into HDFs as shown above. CDC25A‐luc represents luciferase‐labelled CDC25A promoter; CDC25A‐mut‐luc represents luciferase‐labelled CDC25A promoter without NO. 2 E‐like box. Data shown are the mean ± SD. ns, not significant; ***p < 0.001.
FIGURE 6
FIGURE 6
NPAS2 promoted the proliferation and migration of HDFs via CDC25A. (A) Protein expression levels of CDC25A, NPAS2, α‐SMA, COL I, COL III were detected in different cotransfection systems. (B) Proloferative activity was evaluated by CCK8 assay for cotransfected HDFs. (C, D) Flow cytometry was performed to identify the cell cycle distribution for cotransfected HDFs. (E, F) The migratory ability of cotransfected HDFs was detected by transwell assay. EV + si Ctrl represents HDFs cotransfected with control vector and control si RNA; NPAS2 + si Ctrl represents HDFs cotransfected lentiviral vector overexpressing NPAS2 and control si RNA; NPAS2 + si CDC25A represents HDFs cotransfected with lentiviral vector overexpressing NPAS2 and si RNA knocking down CDC25A. Data shown are the mean ± SD. Scale bar, 200 μm. ns, not significant; *p < 0.05; **p < 0.01; ***p < 0.001; ****p < 0.0001.
FIGURE 7
FIGURE 7
NPAS2 knocked down in rat tail wound inhibited scar formation. (A, B) Schematic illustration of moulding and treatment of rat tail scar. (C) Representative images of rat tail wound healed models. (D, E) H&E staining and Masson's trichrome staining of rat tail wounds. Ctrl, normal SD tail tissues; sh‐Ctrl, SD tail wounds interfered with control lentiviral vector; sh‐NPAS2, SD tail wounds interfered with lentiviral vector knocking out NPAS2. Scale bar, 500 and 200 μm.
FIGURE 8
FIGURE 8
The mechanism diagram of NPAS2 inhibiting HTS. NPAS2 restrained the cell proliferation and migration, and decreased the expression of ECM.

Similar articles

References

    1. Manjula P. M., Kelly A. H., Ryan H., Amir H. D., and Sasha H. S., “An Updated Review of Hypertrophic Scarring,” Cells 12, no. 5 (2023): 678–700. - PMC - PubMed
    1. John W. L., Shawn T. M., Katherine S., and Matthew B. K., “Epidemiology and Impact of Scarring After Burn Injury: A Systematic Review of the Literature,” Journal of Burn Care & Research 33, no. 1 (2011): 136–146. - PubMed
    1. Peter O. K. and Edward E. T., “Biological Principles of Scar and Contracture,” Hand Clinics 33, no. 2 (2017): 277–292. - PubMed
    1. E. Edward, T , Benjamin L., and B. Matthias, D , “Biology and Principles of Scar Management and Burn Reconstruction,” Surgical Clinics of North America 94, no. 4 (2014): 793–815. - PMC - PubMed
    1. Frech F. S., Hernandez L., Urbonas R., Zaken G. A., Dreyfuss I., and Nouri K., “Hypertrophic Scars and Keloids: Advances in Treatment and Review of Established Therapies,” American Journal of Clinical Dermatology 24, no. 2 (2023): 225–245. - PubMed

MeSH terms

Substances

LinkOut - more resources