. 2025 Aug;12(29):e15032.
doi: 10.1002/advs.202415032. Epub 2025 Jun 23.

The Non-Canonical ChREBPα Activity Suppresses the Activation of Hepatic Stellate Cells and Liver Fibrosis by Antagonizing TGF-β-E2F1 Axis

Affiliations

The Non-Canonical ChREBPα Activity Suppresses the Activation of Hepatic Stellate Cells and Liver Fibrosis by Antagonizing TGF-β-E2F1 Axis

Jian Zhang et al. Adv Sci (Weinh). 2025 Aug.

Abstract

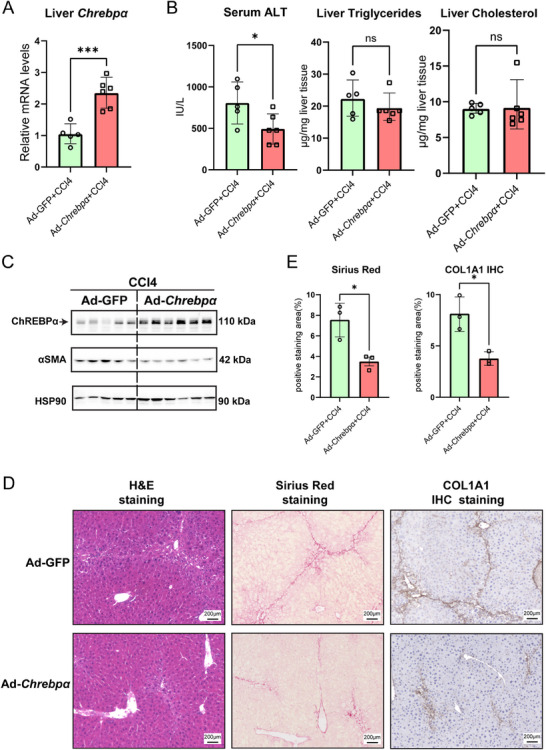
Sustained activation of hepatic stellate cells (HSCs) drives liver fibrosis in response to chronic liver injury and inflammation. It is reported that profibrogenic signals released from stressed/injured hepatocytes evoke fibrogenic responses in HSCs. However, intrahepatocyte players that modulate such cell-to-cell communications remain poorly defined. In this study, hepatic ChREBPα is found to be reduced in mouse models of chemical-induced liver fibrosis as well as in three groups of human patients with liver fibrosis. Chrebpα-LKO mice are highly sensitive to both chemical (CCL4 and TAA) and bile duct ligation (BDL)-induced liver injury and developed more advanced liver fibrosis without affecting liver lipid content. Hepatocyte ChREBPα overexpression suppressed the activation of HSCs in an in vitro medium transfer experiment in part via inhibiting the expression of profibrogenic factors THBS1 and CTGF. RNA-Seq analysis revealed that E2F1, a novel effector of TGFβ-mediated fibrogenic pathway, is highly induced in the liver of Chrebpα-LKO mice. Hepatic knockdown of E2F1 ameliorated the increased liver fibrosis in mice with hepatic Chrebpα deficiency while reducing the expression of hepatic THBS1 and CTGF.

Keywords: ChREBPα; E2F1; TGF‐β signaling; hepatic stellate cells; liver fibrosis.


Conflict of interest statement

The authors declare no conflict of interest.

Figures

Figure 1
Figure 1
Downregulation of hepatic ChREBPα in both mouse and human liver samples with liver fibrosis. (A,B) Liver Chrebpα mRNA and protein expression levels in C57BL6 male mice injected with CCl4 for 4 weeks (n = 3, 5), TAA for 6 weeks (n = 4, 6), or bile duct ligation (BDL) for 7 days (n = 4, 4). (C) Relative expression levels of ChREBPα in human liver samples from RNA‐Seq data on MASH‐associated liver fibrosis (GSE126848) or cirrhosis (GSE142530) as well as from microarray data on HBV‐induced (GSE84044) or PBC‐induced (GSE61260) liver fibrosis. (D,E). Chrebpα mRNA and protein expression levels in PMHs and Hepa1c1c7 cells treated with TGF‐β1 (2 ng mL−1) (n = 3/group for RT‐qPCR; n = 2/group for western blot). (F) The protein levels of ChREBPα in PMHs treated with TGF‐β1 (2 ng mL−1) and inhibitor of SMAD3 (SIS3, 3 mm), inhibitor of AKT (MK‐2206, 65 nm), and inhibitor of ERK (PD18416, 100 nm). All results are shown as the mean ± SD. All the invitro experiments were repeated at least once with similar results observed. Comparisons between two groups were made using the two‐tailed Student's t‐test, and comparisons between three groups were made using one‐way ANOVA followed with post‐hoc Tukey test. *p < 0.05; **p < 0.01, ***p < 0.001, and ****p < 0.0001.
Figure 2
Figure 2
Hepatocyte‐specific deletion of Chrebpα (Chrebpα‐LKO) exacerbates hepatotoxin or BDL‐induced liver fibrosis in mice. Chrebpα‐LKO mice were generated by tail‐vein administration of AAV8‐TBG‐Cre into 8 weeks old ChREBPα f/f male mice. The control group was injected with AAV8‐TBG‐GFP (Chrebpα‐WT). (A) Liver Chrebpα mRNA levels, serum ALT levels, liver triglycerides, and liver cholesterol levels in Chrebpα‐WT and Chrebpα‐LKO mice injected with CCl4 for 4 weeks (n = 3, 5, 8). (B) Liver Chrebpα mRNA levels and serum ALT levels in Chrebpα‐WT and Chrebpα‐LKO mice injected with TAA for 6 weeks (n = 4, 6, 6). (C) Liver Chrebpα mRNA levels and serum ALT levels in Chrebpα‐WT and Chrebpα‐LKO mice undergo BDL surgery for 7 days (n = 4, 4, 4). (D) Liver ChREBPα and α‐SMA protein levels in Chrebpα‐WT and Chrebpα‐LKO mice injected with CCl4 or TAA (n = 3, 5, 5). (E,G) Chrebpα‐WT and Chrebpα‐LKO mice liver H&E staining, Sirius Red staining, and COL1A1 IHC staining results after treatment of CCl4, TAA, or BDL. All results are shown as the mean ± SD. Differences between groups were analyzed with one‐way ANOVA and followed with post‐hoc Tukey test. *p < 0.05; **p < 0.01, ***p < 0.001, and ****p < 0.0001.
Figure 3
Figure 3
Overexpression of hepatic Chrebpα ameliorates CCl4‐induced liver fibrosis in mice. (A,B) Liver Chrebpα mRNA levels, serum ALT levels, liver triglycerides, and liver cholesterol levels in Ad‐GFP group versus Ad‐Chrebpα group after CCl4 injection for 4 weeks (n = 5, 6). (C) Liver ChREBPα and α‐SMA protein levels in both groups (n = 5, 6). (D,E) Liver H&E staining, Sirius Red staining, and COL1A1 IHC staining results and statistical results (n = 3/group) between these two groups. All results are shown as mean ± SD. Differences between groups were analyzed with the two‐tailed Student's t‐test. *p < 0.05, and ***p < 0.001.
Figure 4
Figure 4
Hepatic ChREBPα suppresses HSC activation. (A) Schematic diagram of examining the crosstalk between hepatocyte and primary mouse hepatic stellate cells (pHSC) in vitro. The conditioned medium collected from adenovirus‐transduced Huh7 cells was used to incubate pmHSCs for 48 h prior to immunofluorescence (IF) staining. (B) IF staining of α‐SMA and VIMENTIN in pmHSCs treated with conditioned medium derived from either Huh7‐Ad‐GFP or Huh7‐Ad‐Chrebpα and statistical results of immunofluorescent intensity (n = 9 fields/group). (C) IF staining of α‐SMA and Vimentin in pHSC incubated with conditioned medium derived from either Huh7‐Ad‐shLacZ or Huh7‐Ad‐ShChrebpα (n = 9 fields/group). (D) Schematic outline of examining the in vivo impact of hepatocyte Chrebpα deficiency on activation of pmHSCs. Male Chrebpαf/f mice were injected with AAV‐TBG‐GFP (ChREBPα ‐WT) versus AAV‐TBG‐CRE(ChREBPα ‐LKO) and subsequently CCl4 injection for 1 week prior to pmHSCs isolation. (E) IF staining of α‐SMA and percentages of HSC at different activation stages were quantified (n = 3/group). Red arrow, fully activated HSC; yellow arrow, partially activated HSC; green arrow, quiescent HSC. (F) The mRNA level of Chrebpα in PMHs, and the mRNA levels of Col1a1, α‐Sma and Vimentin in PMHs and pmHSC from both groups. All results are shown as Mean ± SD. All the invitro experiments were repeated at least once with similar results observed. Differences between groups were analyzed with the two‐tailed Student's t‐test. *p < 0.05; **p < 0.01, ***p < 0.001, and ****p < 0.0001.
Figure 5
Figure 5
Overexpression of THBS1 and CTGF blocks hepatic ChREBPα‐mediated suppression of HSC. (A) Heatmap of significantly changed profibrotic genes and fibrotic markers in MASH diet‐induced Chrebpα‐WT and Chrebpα‐LKO mice (Left panel). Heatmap of microarray analysis in WT versus Chrebp‐/‐ primary mouse hepatocytes (Right panel). (B) The mRNA levels of Chrebpα, Thbs1, and Ctgf in WT PMHs transduced with Ad‐GFP versus Ad‐Chrebpα prior to TGF‐β1 (2 ng mL−1) treatment for 16 h. (C,D) Liver THBS1 and CTGF protein levels in previous three mouse models, including group#1:Chrebpα‐WT /Olive Oil group (n = 3), Chrebpα‐WT /CCl4 group (n = 5), Chrebpα‐LKO /CCl4 group (n = 5); group #2: Ad‐GFP/CCl4 group (n = 5), Ad‐Chrebpα /CCl4 group (n = 6); and group #3: Chrebpα‐WT/PBS group (n = 3), Chrebpα‐WT /TAA group (n = 5), Chrebpα‐LKO /TAA group (n = 5). (E) IF staining of α‐SMA and VIMENTIN in pmHSCs treated with conditioned medium derived from Huh7‐Ad‐GFP, Ad‐Chrebpα, Ad‐Chrebpα+Ad‐Thbs1, or Ad‐Chrebpα+Ad‐Ctgf (n = 9 fields/group). (F) IF staining and statistical results (n = 9 fields/group) of α‐SMA and VIMENTIN in pHSC treated with conditioned medium derived from Ad‐shLacZ, Ad‐shChrebpα with/without antibody‐neutralization by IgG, anti‐THBS1 or anti‐CTGF antibodies. All results are shown as Mean ± SD. All the invitro experiments were repeated at least once with similar results observed. RT‐qPCR results were analyzed by the two‐tailed Student's t‐test and immunofluorescence results were analyzed by one‐way ANOVA and followed with post‐hoc Tukey test. **p < 0.01, ***p < 0.001, and ****p < 0.0001.
Figure 6
Figure 6
Hepatic ChREBPα suppresses THBS1 and CTGF via downregulating E2F1. (A) Heatmap of top changed fibrosis‐related transcriptional factors in MASH diet‐fed Chrebpα‐WT and Chrebpα‐LKO mice (Left panel). Heatmap of microarray analysis in WT versus Chrebp−/− primary mouse hepatocytes (Right panel). (B,C) The verification of top 3 changed transcriptional factors E2F1, FOXM1, ESSRG in previous three mouse models via RT‐qPCR and Immunoblotting. (D) The E2f1‐luc vector was co‐transfected with empty vector, pCMV‐E2f1 alone, or pCMV‐E2f1 & pQCIPX‐Chrebpα into 293A cells before harvested for luciferase assay. Luciferase activity was normalized by β‐Gal activity for each well. (E) Protein levels of ChREBPα, E2F1, THBS1, and CTGF in PMH from Chrebpα‐WT or Chrebpα‐LKO mice, then treated with Ad‐Chrebpα‐WT or Ad‐Chrebpα‐AG (n = 3/group). (F) Protein levels of ChREBPα, E2F1, THBS1 and CTGF in PMH treated with TGF‐β1 (2 ng mL−1), Ad‐shChrebpα, and CDK4 inhibitor, Palbociclib (n = 3/group). (G) Protein levels of ChREBPα, E2F1, and CDK4 in Hepa1c1c7 cells following transfection with shRNA against Cdk4. (H) Data mining of E2F1‐based ChIP‐seq for possible direct E2F1 binding to the 1 kb of TSS within the promoters of THBS1 and CTGF promoter in HepG2 cell line (GSE169862). All results are shown as mean ± SD. All the invitro experiments were repeated at least once with similar results observed. Results were analyzed by one‐way ANOVA and followed with post‐hot Tukey test. *p < 0.05; **p < 0.01, ***p < 0.001, and ****p < 0.0001.
Figure 7
Figure 7
Depletion of hepatic E2f1 attenuates Chrebpα deficiency‐enhanced liver fibrosis in response to CCl4 injection. (A) Protein levels of ChREBPα, E2F1, THBS1 and CTGF in PMHs treated with TGF‐β1, Ad‐shChrebpα, or Ad‐shE2f1 (n = 3/group). (B) IF staining and quantified results of α‐SMA and Vimentin in pHSC incubated in conditioned medium derived from Huh7 transduced with Ad‐shLacZ, Ad‐shChrebpα, or Ad‐shChrebpα+Ad‐shE2f1 (n = 9 fields/group). Effects of acute depletion of hepatic E2f1 on CCl4‐induced liver fibrosis. (C) The mRNA levels of hepatic Chrebpα and E2f1, and serum ALT in CCl4‐treated Chrebpα‐WT/Ad‐shLacZ group (n = 5), Chrebpα‐LKO/Ad‐shLacZ group (n = 6), and Chrebpα‐LKO/Ad‐shE2f1 group (n = 6); (D) Protein levels of liver ChREBPα, α‐SMA, E2F1, THBS1, and CTGF; (E) H&E staining, Sirius Red staining, and COL1A1 IHC staining of liver samples from these three groups and statistical results (n = 3/group). Effects of acute depletion of hepatic E2f1 on HFLMCD‐induced liver fibrosis. (F) Protein levels of liver E2F1, α‐SMA, THBS1, and CTGF in Ad‐shLacZ (n = 5) and Ad‐shE2f1 group (n = 6) fed with HFLMCD for 5 weeks. (G) H&E staining, Sirius Red staining, COL1A1 IHC staining of liver samples and statistical results (n = 3/group) from these two groups. All results are shown as mean ± SD. Differences between groups were analyzed with one‐way ANOVA or two‐tailed Student's t‐test. *p < 0.05; **p < 0.01, ***p < 0.001, and ****p < 0.0001.

Similar articles

References

    1. Zamani M., Alizadeh‐Tabari S., Ajmera V., Singh S., Murad M. H., Loomba R., Clin. Gastroenterol. Hepatol. 2024, 23, 1123. - PubMed
    1. a) Lee Y. S., Seki E., Cell Mol. Gastroenterol. Hepatol. 2023, 16, 355; - PMC - PubMed
    2. b) Seki E., Brenner D. A., J. Hepatobiliary Pancreat. Sci. 2015, 22, 512; - PMC - PubMed
    3. c) Hammerich L., Tacke F., Nat. Rev. Gastroenterol. Hepatol. 2023, 20, 633; - PubMed
    4. d) Dhar D., Baglieri J., Kisseleva T., Brenner D. A., Exp. Biol. Med. (Maywood) 2020, 245, 96; - PMC - PubMed
    5. e) Kim H. Y., Sakane S., Eguileor A., Carvalho Gontijo Weber R., Lee W., Liu X., Lam K., Ishizuka K., Rosenthal S. B., Diggle K., Brenner D. A., Kisseleva T., Cell Mol. Gastroenterol. Hepatol. 2024, 17, 93. - PMC - PubMed
    1. Higashi T., Friedman S. L., Hoshida Y., Adv. Drug Deliv. Rev. 2017, 121, 27. - PMC - PubMed
    1. a) Tsuchida T., Friedman S. L., Nat. Rev. Gastroenterol. Hepatol. 2017, 14, 397; - PubMed
    2. b) Kisseleva T., Brenner D., Nat. Rev. Gastroenterol. Hepatol. 2020, 18, 151; - PubMed
    3. c) Liu X., Xu J., Rosenthal S., Zhang L. J., McCubbin R., Meshgin N., Shang L., Koyama Y., Ma H. Y., Sharma S., Heinz S., Glass C. K., Benner C., Brenner D. A., Kisseleva T., Gastroenterology 2020, 158, 1728. - PMC - PubMed
    1. a) Peiseler M., Schwabe R., Hampe J., Kubes P., Heikenwalder M., Tacke F., J. Hepatol. 2022, 77, 1136; - PubMed
    2. b) Wallace S. J., Tacke F., Schwabe R. F., Henderson N. C., JHEP Rep. 2022, 4, 100524; - PMC - PubMed
    3. c) Long Y., Niu Y., Liang K., Du Y., Trends Cell Biol. 2022, 32, 70. - PubMed

MeSH terms

Substances

LinkOut - more resources