. 2025 Jun 20;53(12):gkaf479.
doi: 10.1093/nar/gkaf479.

Systematic analysis of siRNA and mRNA features impacting fully chemically modified siRNA efficacy

Affiliations

Systematic analysis of siRNA and mRNA features impacting fully chemically modified siRNA efficacy

Sarah M Davis et al. Nucleic Acids Res. .

Abstract

Chemically modified small interfering RNAs (siRNAs) are a promising drug class that silences disease-causing genes via mRNA degradation. Both siRNA-specific features (e.g. sequence, modification pattern, and structure) and target mRNA-specific factors contribute to observed efficacy. Systematically defining the relative contributions of siRNA sequence, structure, and modification pattern versus the native context of the target mRNA is necessary to inform design considerations and facilitate the widespread application of this therapeutic platform. To address this, we synthesized a panel of ∼1260 differentially modified siRNAs and evaluated their silencing efficiency against therapeutically relevant mRNAs (APP, BACE1, MAPT, and SNCA) using both reporter-based and native expression assays. Our results demonstrate that the siRNA modification pattern (e.g. level of 2'-O-methyl content) significantly impacts efficacy, while structural features (e.g. symmetric versus asymmetric configurations) do not. Furthermore, we observed substantial differences in the number of effective siRNAs identified per target. These target-specific differences in hit rates are largely mitigated when efficacy is tested in the context of a reporter assay, confirming that native mRNA-specific features influence siRNA performance. Key target-specific factors, including exon usage, polyadenylation site selection, and ribosomal occupancy, partially explained efficacy variability. These insights led to a proposed framework of parameters for optimizing therapeutic siRNA design.


Conflict of interest statement

A.K. is an inventor on Fully Stabilized Asymmetric siRNA, U.S. Utility App. No. 15/089,423; A.K. and S.M.D. are inventors on O-Methyl Rich Fully Stabilized Oligonucleotides, U.S. Utility App. No. 16/550,076; A.K., S.M.D., and C.F. are inventors on Oligonucleotides for APP Modulation. U.S. Utility App. No. 18/120,030; A.K., S.M.D., K.M., and C.F. are inventors on Oligonucleotides for MAPT Modulation. U.S. Utility App. No. 17/204,480; A.K., S.M.D., K.M., and C.F. are inventors on Oligonucleotides for SNCA Modulation. U.S. Utility App. No. 17/204,483; A.K., S.M.D., S.H., K.M., J.S., N.H., C.F., and V.N.H. are inventors on Development of lung-active siRNAs and ASOs for the prophylaxis and treatment of COVID-19 Infection. U.S. Utility App. No. 17/333,839.

Figures

Graphical Abstract
Graphical Abstract
Figure 1.
Figure 1.
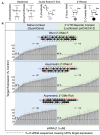
Experimental dataset demonstrates siRNA chemical pattern and assay impact hit rate. (A) siRNA chemical modifications used in this study. (B) siRNA target silencing results (n = 3, mean ± SD) in SH-SY5Y cells (native context, left panel) or 3′ UTR reporter context (HeLa cells, right panel) in three different chemical scaffolds used in study. The schematic of each chemical scaffold is shown above each set of results. SH-SY5Y or HeLa cells treated for 72 h. Target expression levels measured using the QuantiGene 2.0 RNA Assay (SH-SY5Y) or Dual-Glo® Luciferase Assay System (HeLa) and calculated as percentage of untreated control.
Figure 2.
Figure 2.
siRNA structure has limited impact on siRNA efficacy. (A, B, andD) siRNA target silencing results (n = 3, mean ± SD) in native context (A) or 3′ UTR reporter context (B) in Asymmetric 2′-OMe/-F (A and B: y-axis; D: gray bars) or Blunt 2′-OMe/-F scaffolds (A and B: x-axis; D: black bars). SH-SY5Y or HeLa cells treated for 72 h. Target expression levels measured using the QuantiGene 2.0 RNA Assay (SH-SY5Y) or Dual-Glo® Luciferase Assay System (HeLa) and calculated as percentage of untreated control. Sequences causing ≤35% target expression in both scaffolds (i.e. permissive sequences) boxed by black dashed lines in (A) and (B) and shaded gray in (D). Sequences causing ≤35% target expression in one scaffold and >50% target expression in the other scaffold (i.e. restrictive sequences) shaded gray in (A) and (B) and shaded turquoise (asymmetric restrictive) or light blue (blunt restrictive) in (D). Pearson correlation coefficient displayed in bottom right corners in (A) and (B). (C) Proportional Venn diagram with numbers of structure permissive and restrictive siRNA sequences. (E) Equation used to calculate changes in thermodynamic stability (i.e. ΔΔG °37) and frequency between asymmetric restrictive and blunt restrictive groups. n = number of sequences in each group, i = position in 50mer targeting region (F) ΔΔG °37 plotted for each nucleotide pair in the 50mer targeting region, with each position number marking the first position of each nucleotide pair. P-values describe statistically significant differences between groups (t-test with Benjamini–Hochberg correction; *P < 0.05, nonsignificant differences unmarked). (G) Change in nucleotide frequency plotted for each nucleotide in the 50mer targeting region. P-values describe statistically significant differences between groups (Fisher’s exact test; *P < 0.05, nonsignificant differences unmarked).
Figure 3.
Figure 3.
siRNA chemical pattern impacts siRNA efficacy. (A, B, D) siRNA target silencing results (n = 3, mean ± SD) in native context (A) or 3′ UTR reporter context (B) in Asymmetric 2′-OMe/-F (A and B: y-axis; D: gray bars) or Asymmetric 2′-OMe Rich scaffolds (A and B: x-axis; D: black bars). SH-SY5Y or HeLa cells treated for 72 h. Target expression levels measured using the QuantiGene 2.0 RNA Assay (SH-SY5Y) or Dual-Glo® Luciferase Assay System (HeLa) and calculated as percentage of untreated control. Sequences causing ≤35% target expression in both scaffolds (i.e. permissive sequences) boxed by black dashed lines in (A) and (B) and shaded light blue in (D). Sequences causing ≤35% target expression in one scaffold and >50% target expression in the other scaffold (i.e. restrictive sequences) shaded gray in (A) and (B) and shaded turquoise (2′-OMe/-F restrictive) or gray (2′-OMe Rich restrictive) in (D). Pearson correlation coefficient displayed in bottom right corner in (A) and (B). (C) Proportional Venn diagram with numbers of structure permissive and restrictive siRNA sequences. (E) Equation used to calculate changes in thermodynamic stability (i.e. ΔΔG°37) and frequency between pattern permissive and Asymmetric 2′-OMe/-F pattern restrictive groups. n = number of sequences in each group, i = position in 50mer targeting region (F) ΔΔG°37 plotted for each nucleotide pair in the 50mer targeting region, with each position number marking the first position of each nucleotide pair. P-values describe statistically significant differences between groups (t-test with Benjamini–Hochberg correction; nonsignificant differences unmarked). (G) Change in nucleotide frequency plotted for each nucleotide in the 50mer targeting region. P-values describe statistically significant differences between groups (Fisher’s exact test; *P < 0.05, nonsignificant differences unmarked).
Figure 4.
Figure 4.
siRNA efficacy is higher in reporter versus native contexts. siRNA target silencing results (n = 3, mean ± SD) in native context (x-axis) or 3′ UTR reporter context (y-axis) in three different chemical scaffolds used in study: (A) Blunt 2′-OMe/-F bDNA, (B) Asymmetric 2′-OMe/-F, and (C) Asymmetric 2′-OMe Rich. The schematic of each chemical scaffold is shown next to the results. SH-SY5Y or HeLa cells treated for 72 h. Target expression levels measured using the QuantiGene 2.0 RNA Assay (SH-SY5Y) or Dual-Glo® Luciferase Assay System (HeLa) and calculated as percentage of untreated control. Pearson correlation coefficient displayed in bottom right corner of each graph.
Figure 5.
Figure 5.
Degrees of correlation across native and reporter contexts for APP targeting compounds. siRNA target silencing results (n = 3, mean ± SD) in native context (A, x-axis; B, black datapoints) or 3′ UTR reporter context (A, y-axis; B, gray datapoints) in Blunt 2′-OMe/-F (A, left panel; B, top panel), Asymmetric 2′-OMe/-F (A, middle panel; B, middle panel), or Asymmetric 2′-OMe Rich scaffolds (A, right panel; B, bottom panel) for APP. SH-SY5Y or HeLa cells treated for 72 h. Target expression levels measured using the QuantiGene 2.0 RNA Assay (SH-SY5Y) or Dual-Glo® Luciferase Assay System (HeLa) and calculated as percentage of untreated control. Pearson correlation coefficient displayed in bottom right corners in (A). Gene regions (labeled) are shown below graphs in (B).
Figure 6.
Figure 6.
Degrees of correlation across native and reporter contexts for BACE1 targeting compounds. siRNA target silencing results (n = 3, mean ± SD) in native context (A,x-axis; B, black datapoints) or 3′ UTR reporter context (A, y-axis; B, gray datapoints) in Blunt 2′-OMe/-F (A, left panel; B, top panel), Asymmetric 2′-OMe/-F (A, middle panel; B, middle panel), or Asymmetric 2′-OMe Rich scaffolds (A, right panel; B, bottom panel) for BACE1. SH-SY5Y or HeLa cells treated for 72 h. Target expression levels measured using the QuantiGene 2.0 RNA Assay (SH-SY5Y) or Dual-Glo® Luciferase Assay System (HeLa) and calculated as percentage of untreated control. Pearson correlation coefficient displayed in bottom right corners in (A). Gene regions (labeled) are shown below graphs in (B).
Figure 7.
Figure 7.
Degrees of correlation across native and reporter contexts for MAPT targeting compounds. siRNA target silencing results (n = 3, mean ± SD) in native context (A,x-axis; B, black datapoints) or 3′ UTR reporter context (A, y-axis; B, gray datapoints) in Blunt 2′-OMe/-F (A, left panel; B, top panel), Asymmetric 2′-OMe/-F (A, middle panel; B, middle panel), or Asymmetric 2′-OMe Rich scaffolds (A, right panel; B, bottom panel) for MAPT. SH-SY5Y or HeLa cells treated for 72 h. Target expression levels measured using the QuantiGene 2.0 RNA Assay (SH-SY5Y) or Dual-Glo® Luciferase Assay System (HeLa) and calculated as percentage of untreated control. Pearson correlation coefficient displayed in bottom right corners in (A). Gene regions (labeled) are shown below graphs in (B).
Figure 8.
Figure 8.
Degrees of correlation across native and reporter contexts for SNCA targeting compounds. siRNA target silencing results (n = 3, mean ± SD) in native context (A,x-axis; B, black datapoints) or 3′ UTR reporter context (A, y-axis; B, gray datapoints) in Blunt 2′-OMe/-F (A, left panel; B, top panel), Asymmetric 2′-OMe/-F (A, middle panel; B, middle panel), or Asymmetric 2′-OMe Rich scaffolds (A, right panel; B, bottom panel) for SNCA. SH-SY5Y or HeLa cells treated for 72 h. Target expression levels measured using the QuantiGene 2.0 RNA Assay (SH-SY5Y) or Dual-Glo® Luciferase Assay System (HeLa) and calculated as percentage of untreated control. Pearson correlation coefficient displayed in bottom right corners in (A). Gene regions (labeled) are shown below graphs in (B).
Figure 9.
Figure 9.
Percent of siRNAs with target expression ≤35%.
Figure 10.
Figure 10.
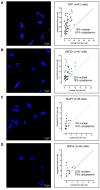
Intracellular localization does not contribute to siRNA efficacy in SH-SY5Y cells. RNAscope showing localization of (A) APP, (B) BACE1, (C) MAPT, or (D) SNCA mRNAs in SH-SY5Y cells. Left panels: representative images with target mRNAs (red) and nuclei stained with DAPI (blue); scale bar: 10 μm. Right panels: quantification of nuclear and cytoplasmic mRNA foci in SH-SY5Y cells (% of total foci).
Figure 11.
Figure 11.
Exon usage and upstream PAS usage impact siRNA efficacy. RNA-seq data (left, right) and 3P-seq data (right) from the (A) APP, (B) BACE1, (C) MAPT, or (D) SNCA locus from undifferentiated SH-SY5Y cell RNA. Exonic read coverage from RNA-seq is shown in orange and read coverage from 3P-seq is shown in turquoise. All read counts are normalized by the total number of mapped reads in the libraries. On the left, gene bodies are shown for isoforms to which ≥5% of reads align according to RNA-seq data, and for the isoform used for siRNA design (marked with an asterisk). On the right, the 3′ UTR is shown for each gene. Black arrows mark the ends of qualified poly(A) sites (see “Materials and methods” section).
Figure 12.
Figure 12.
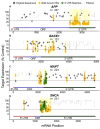
Effective sequences cluster together, and siRNA hit rates in the 3′ UTR are target dependent. siRNA target silencing results (n = 3, mean ± SD) in native context in Asymmetric 2′-OMe/-F scaffold for (A) APP, (B) BACE1, (C) MAPT, or (D) SNCA. SH-SY5Y cells treated for 72 h. Target mRNA expression levels measured using the QuantiGene 2.0 RNA Assay and calculated as percentage of untreated control. Datapoints are colored by dataset “Original Sequences” (dark gray), “Walk Around Hits” (orange), and “3′ UTR Selective” (green). Datapoints for siRNAs that don’t target prominently expressed mRNA regions according to RNA- and 3P-seq data are colored in off-white. Regions with high siRNA activity (i.e. “hot spots,” see “Materials and methods” section) are shaded in yellow. Dotted line at target mRNA expression = 35% to marks cutoff for siRNA hits. Gene regions (labelled) are shown below graphs.
Figure 13.
Figure 13.
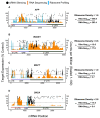
APP and SNCA are more efficiently translated than BACE1 and MAPT. MAPT has a higher hit rate at the beginning of the 3′ UTR than SNCA. siRNA target silencing results (n = 3, mean ± SD) in native context in Asymmetric 2′-Ome/-F scaffold (black points), RNA-seq (orange), or ribosome profiling (blue) exonic read coverage for (A) APP, (B) BACE1, (C) MAPT, or (D) SNCA. For siRNA silencing, SH-SY5Y cells treated for 72 h, and target mRNA expression levels measured using the QuantiGene 2.0 RNA Assay and calculated as percentage of untreated control. Dotted line at target mRNA expression = 35% to marks cutoff for siRNA hits. For sequencing data, all read counts are normalized by the total number of mapped reads in the libraries. Exons (black and white) and gene regions (labeled) are shown below graphs. Ribosome density values are shown on the right.
Figure 14.
Figure 14.
Machine Learning models trained on reporter assay data predict RISC-competence for fully chemically modified siRNAs. (A–  C, left panels) siRNA (Asymmetric 2′-OMe/-F scaffold) target silencing results (n = 3, mean ± SD) for (A) the full dataset in a reporter context used to create the models and for (B and C) external datasets used to evaluate the models from (B) reporter or (C) native assays. Cells treated for 72 h. Target expression levels measured using the QuantiGene 2.0 RNA Assay (native) or Dual-Glo® Luciferase Assay System (reporter) and calculated as percentage of untreated control. Dotted lines mark thresholds used for effective and ineffective siRNAs. (A–C, right panels) AUCPRadj. values plotted and statistics shown for each of the models generated from the training datasets (85% of the full dataset) for (Aii) 10-fold cross validations on the training datasets, and (Aiii) final model performances on the holdout datasets (15% of the full dataset), (Bii) reporter assay derived external dataset, and (Cii) native assay derived external dataset.
Figure 15.
Figure 15.
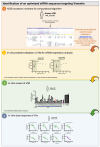
Flow chart for the design and identification of siRNA targeting vimentin. (1) Accession number is identified. The GTEx portal evaluates transcriptional variants and expression in tissues of interest. siRNAs are designed to favor factors known to affect RISC entry, specificity, and synthetic compatibility. (2) Cell lines expressing the target of interest are identified, and assays are validated to determine the linearity of the assay range (QuantiGene). (3) The primary screen is performed at high concentrations to identify lead compounds. (4) The efficacies of the lead compounds are validated in a dose–response study, and IC50 values are determined.

References

    1. Moumne L, Marie AC, Crouvezier N Oligonucleotide therapeutics: from discovery and development to patentability. Pharmaceutics. 2022; 14:260–83. 10.3390/pharmaceutics14020260. - DOI - PMC - PubMed
    1. Nair JK, Willoughby JL, Chan A et al. Multivalent N-acetylgalactosamine-conjugated siRNA localizes in hepatocytes and elicits robust RNAi-mediated gene silencing. J Am Chem Soc. 2014; 136:16958–61. 10.1021/ja505986a. - DOI - PubMed
    1. Soutschek J, Akinc A, Bramlage B et al. Therapeutic silencing of an endogenous gene by systemic administration of modified siRNAs. Nature. 2004; 432:173–8. 10.1038/nature03121. - DOI - PubMed
    1. Wolfrum C, Shi S, Jayaprakash KN et al. Mechanisms and optimization of in vivo delivery of lipophilic siRNAs. Nat Biotechnol. 2007; 25:1149–57. 10.1038/nbt1339. - DOI - PubMed
    1. Cuellar TL, Barnes D, Nelson C et al. Systematic evaluation of antibody-mediated siRNA delivery using an industrial platform of THIOMAB-siRNA conjugates. Nucleic Acids Res. 2015; 43:1189–203. 10.1093/nar/gku1362. - DOI - PMC - PubMed

MeSH terms

LinkOut - more resources