. 2025 Jun 23;82(1):249.
doi: 10.1007/s00018-025-05786-7.

Novel drug-inducible CRISPRa/i systems for rapid and reversible manipulation of gene transcription

Affiliations

Novel drug-inducible CRISPRa/i systems for rapid and reversible manipulation of gene transcription

Ming Sui et al. Cell Mol Life Sci. .

Erratum in

Abstract

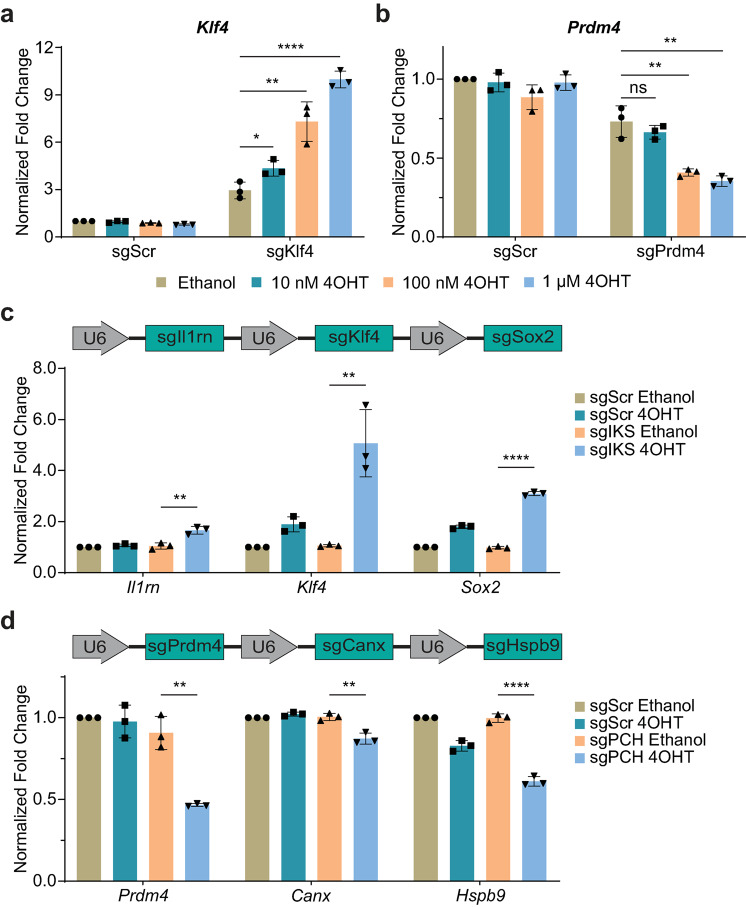
CRISPR activation and interference (CRISPRa/i) are highly effective tools to regulate transcription by fusing dead Cas9 (dCas9) with transcriptional regulatory factors guided by small guide RNA (sgRNA) in mammalian cells and mice. Still, a controllable gene regulation system is desired to investigate and manipulate dynamic biological processes. Here, we reported flexible drug-responsive CRISPRa/i systems by fusing mutated human estrogen receptor (ERT2) domains, which responded to estrogen analogue tamoxifen or its active metabolite 4-hydroxy-tamoxifen (4OHT), to CRISPRa/i components for transcriptional regulation. Upon 4OHT treatment, the optimal variants, ERT2-ERT2-CRISPRa/i-ERT2 (iCRISPRa/i), showed rapid protein translocation of iCRISPRa/i from cytoplasm to nucleus and subsequent transcriptional response. The inducible transcriptional manipulation could be restored to its original level when 4OHT was withdrawn. Moreover, the efficiencies of gene expression regulation of iCRISPRa/i were comparable to those of non-inducible and doxycycline-inducible counterparts, with a lower leakage and a faster drug response activity. The iCRISPRa/i systems successfully induced phenotypic changes in various cell lines. These results highlight that iCRISPRa/i systems could achieve fast and flexible drug-responsive transcriptional modulation and phenotypic changes, and thus provide better options for gain- and loss-of-function model construction and gene therapy.

Keywords: 4OHT; Phenotypic change; Transcriptional regulation; iCRISPRa/i.


Conflict of interest statement

Declarations. Conflict of interest: The authors declare no conflict of interest. Ethical standards: The experiments comply with the current laws of the country where we were performed. Consent to publish: All the authors have read and approved the final version of the manuscript and agreed to its publication in Cellular and Molecular Life Sciences.

Figures

Fig. 1
Fig. 1
Development of optimal drug-inducible CRISPRa/i variants. a Architectures of CRISPRa/i and different ERT2-CRISPRa/i variants. The top two rows are the referenced CRISPRa and CRISPRi constructs, which contain Myc epitope tags and NLS domains joined to dCas9-effectors. Other rows represent four distinct configurations of ERT2 domain and dCas9-effectors that were evaluated in this study. b-e Western blot and quantification of subcellular localization of CRISPRa/i b, d and ERT2-CRISPRa/i variants 2 c, e. Transfected HEK 293T cells were separated into cytoplasmic and nuclear fractions after ethanol or 4OHT treatment for 24 h. CRISPRa/i and ERT2-CRISPRa/i variants 2 tagged with Myc tags could be detected with anti-Myc antibodies. α-tubulin served as a cytoplasmic marker, while LMNB1 served as a nuclear marker. Var: variant. Eth: ethanol. C: cytoplasmic fraction, N: nuclear fraction. f, g Fluorescence images and quantification of the percentage of cells containing cytoplasmic- and nuclear-located iCRISPRa f and iCRISPRi g proteins. iCRISPRa protein was tagged with GFP reporter and iCRISPRi protein was tagged with mCherry reporter to monitor their subcellular localization. Transfected HEK 293T cells were treated with ethanol or 4OHT for 24 h, and the nuclei were stained with DAPI. Eth: ethanol. Arrowheads indicate that iCRISPRa/i proteins were localized at the cytoplasm, and arrows indicate that iCRISPRa/i proteins were localized at the nucleus. At least 600 cells were counted for each group. Scale bars, 20 μm. All photographs shown in this figure are representative of three independent experiments. Data are presented as mean ± SD, n = 3 biological replicates. ns, not significant (p > 0.05), ** p < 0.01, *** p < 0.001, **** p < 0.0001; Student’s t-test
Fig. 2
Fig. 2
Exogenous and endogenous genes could be regulated transcriptionally by iCRISPRa/i. a, b Overview of exogenous GFP transcriptional activation a and repression b assays. HEK 293T cells were co-transfected with GFP reporter driven by CMV promoter, sgGFP-a/i targeting CMV promoter region of GFP and iCRISPRa/i plasmids and treated with either ethanol or 4OHT for 48 h. c, d Fluorescence images and quantification of the GFP signals were analyzed by the integrated density plugin in ImageJ of the cells transfected with iCRISPRa/i and appropriate sgGFP-a/i plasmids and normalized to DAPI. Data are shown as integrated density normalized to control samples. IntDen: integrated density. Scale bars, 100 μm. All photographs shown in this figure are representative of three independent experiments. Each data point represents an average of multiple fields of one experiment sample. e, f Detection of transcriptional regulation of endogenous genes by iCRISPRa e and iCRISPRi f with 4OHT induction in HEK 293T cells. Il1rn, Klf4 and Sox2 transcripts were targeted with the iCRISPRa system to activate transcription, Prdm4, Canx and Hspb9 transcripts were targeted with the iCRISPRi system to repress transcription. g Schematic of lentivirus vectors encoding iCRISPRa/i and sgRNA used for generating stable cell lines with different resistance and fluorescence genes. h, i Detection of transcriptional regulation of endogenous genes by iCRISPRa h and iCRISPRi i with 4OHT induction in NIH/3T3 cells. Fgf7, Ngn2 and Isl1 transcriptional levels were activated by the iCRISPRa system, Mymx and Mstn transcriptional levels were repressed by the iCRISPRi system. Transcriptional levels of target genes of each sample were detected by qPCR and normalized to the housekeeping gene Gapdh. Data are presented as mean ± SD, n = 3 biological replicates. * p < 0.05, ** p < 0.01, *** p < 0.001; Student’s t-test
Fig. 3
Fig. 3
Targeting specificity of iCRISPRa/i. a, b The transcriptional levels of predicted iCRISPRa a and iCRISPRi b off-target genes were measured in transfected HEK 293T cells with ethanol or 4OHT treatment. On-target genes were labeled above the figures. Transcriptional levels of target genes of each sample were detected by qPCR and normalized to the housekeeping gene Gapdh. c, d Venn diagrams showed the overlap of regulated genes among different groups achieved by iCRISPRa c and iCRISPRi d, with common regulated genes listed, and the normalized fold changes of regulated genes were quantified. Different colored circles represent different comparison combinations. The overlapping regions in the two different-colored circles represent the number of different genes shared by the two comparison combinations. Data are presented as mean ± SD, n = 3 biological replicates. ns, not significant (p > 0.05), * p < 0.05, ** p < 0.01; Student’s t-test
Fig. 4
Fig. 4
Transcriptional regulation induced by 4OHT was dose-dependent and multiplex. a, b Detection of the activation effect on Klf4 transcript a and repression effect on Prdm4 transcript b with different 4OHT dosages. Transfected HEK 293T cells were treated with ethanol, 10 nM, 100 nM, or 1 µM 4OHT and harvested at 48 h after treatment for qPCR. c Schematic of the sgRNA array targeting Il1rn, Klf4 and Sox2 genes and simultaneous activation of all targets by iCRISPRa with 4OHT inducement in transfected HEK 293T cells. d Schematic of the sgRNA array targeting Prdm4, Canx and Hspb9 genes and simultaneous repression of all targets by iCRISPRi with 4OHT inducement in transfected HEK 293T cells. Transcriptional levels of target genes of each sample were detected by qPCR and normalized to the housekeeping gene Gapdh. Data are presented as mean ± SD, n = 3 biological replicates. ns, not significant (p > 0.05), * p < 0.05, ** p < 0.01, **** p < 0.0001; Student’s t-test
Fig. 5
Fig. 5
Transcriptional regulation kinetics of iCRISPRa/i systems. a, c Detection of Klf4a and Prdm4c transcriptional levels after 4OHT treatment with various durations. Transfected cells were treated with ethanol or 4OHT for 0 h, 4 h, 8 h, 12 h and 24 h, and harvested for qPCR. The ethanol-treated cells were regarded as the reference for 4OHT-treated cells at each time point. Transcriptional levels of target genes of each sample were detected by qPCR and normalized to the housekeeping gene Gapdh. Data are presented as mean ± SD, n = 3 biological replicates. **** p < 0.0001, one-way ANOVA. b, d Subcellular localization analyses of iCRISPRa b and iCRISPRi d with treatment of ethanol or 4OHT for 0 h and 4 h by Western blot. iCRISPRa/i proteins tagged with Myc tag could be detected with anti-Myc antibodies. α-tubulin served as a cytoplasmic marker, while LMNB1 served as a nuclear marker. Eth: ethanol. C: cytoplasmic fraction, N: nuclear fraction. Data are presented as mean ± SD, n = 3 biological replicates. ns, not significant (p > 0.05), * p < 0.05, ** p < 0.01; Student’s t-test. e, g Detection of Klf4e and Prdm4g transcriptional levels after 4OHT retraction. Transfected cells were treated with either ethanol or 4OHT for 2 d, then 4OHT was replaced by ethanol, and the transcriptional levels were detected by qPCR at 0 d, 1 d, 2 d, 3 d and 4 d. The ethanol-treated cells were regarded as the reference for 4OHT-treated cells at each time point. Transcriptional levels of target genes of each sample were detected by qPCR and normalized to the housekeeping gene Gapdh. Data are presented as mean ± SD, n = 3 biological replicates. ** p < 0.01, one-way ANOVA. f, h Subcellular localization analyses of iCRISPRa f and iCRISPRi h after 4OHT retraction. Transfected HEK 293T cells were treated with 4OHT for 24 h. After induction, 4OHT was replaced by ethanol and the subcellular localization was analysed by Western blot at 0 d, 1 d, 2 d and 3 d. Data are presented as mean ± SD, n = 3 biological replicates. ns, not significant (p > 0.05), * p < 0.05, ** p < 0.01, *** p < 0.001; Student’s t-test
Fig. 6
Fig. 6
iCRISPRa/i altered tyrosinase activity and melanin content by regulating tyrosinase gene transcription with 4OHT induction. a-c The Tyr transcript a, tyrosinase activity b and melanin content c of B16 cells infected with iCRISPRa and sgRNA lentiviruses were analyzed after ethanol or 4OHT treatment. d-f The Tyr transcript d, tyrosinase activity e and melanin content f of B16 cells infected with iCRISPRi and sgRNA lentiviruses were analyzed after either ethanol or 4OHT treatment. Transcriptional levels of Tyr of each sample were detected by qPCR and normalized to the housekeeping gene Gapdh. Tyrosinase activities were determined by L-DOPA oxidation. Melanin contents were measured by a Mexameter. Data are presented as mean ± SD, n = 3 biological replicates. ** p < 0.01, *** p < 0.001; Student’s t-test
Fig. 7
Fig. 7
Fusion deficit of C2C12 cells resulted from inducible Mymx repression using iCRISPRi system. a Schematic of pUC-sgRNA-iCRISPRi-2A-GFP. sgRNA was driven by the U6 promoter, iCRISPRi and GFP were driven by the chicken β-actin (CBA) promoter and split by a self-cleaving 2A peptide. b Immunofluorescence images of differentiated C2C12 cells in which fusion of myoblasts was inhibited by iCRISPRi with 4OHT induction. The transfected C2C12 myoblasts were incubated in the fusion media containing either ethanol or 1 µM 4OHT for 2 d. After an additional two-day period of fresh fusion media, differentiated cells were fixed and stained with antibodies against Desmin, and cell nuclei were stained with DAPI. Scale bar, 100 μm. All photographs shown in this figure are representative of three independent experiments. c-e Quantification of the normalized area c, length d and width e of GFP-positive cells. f, g Quantification of the fusion and maturation index f and the percentage of cells with 1-3, 4-7 and 8+ nuclei g. Data are presented as mean ± SD, n = 3 biological replicates. ns, not significant (p > 0.05), * p < 0.05, ** p < 0.01, *** p < 0.001; Student’s t-test

References

    1. Qi LS et al (2013) Repurposing CRISPR as an RNA-Guided platform for Sequence-Specific control of gene expression. Cell 152(5):1173–1183. 10.1016/j.cell.2013.02.022 - PMC - PubMed
    1. Gilbert LA et al (2013) CRISPR-Mediated modular RNA-Guided regulation of transcription in eukaryotes. Cell 154(2):442–451. 10.1016/j.cell.2013.06.044 - PMC - PubMed
    1. Maeder ML et al (2013) CRISPR RNA-guided activation of endogenous human genes. Nat Methods 10(10):977–979. 10.1038/nmeth.2598 - PMC - PubMed
    1. Perez-Pinera P et al (2013) RNA-guided gene activation by CRISPR-Cas9-based transcription factors. Nat Methods 10(10):973–976. 10.1038/nmeth.2600 - PMC - PubMed
    1. Chavez A et al (2015) Highly efficient Cas9-mediated transcriptional programming. Nat Methods 12(4):326–328. 10.1038/nmeth.3312 - PMC - PubMed

LinkOut - more resources