

The bovine oviductal environment and composition are negatively affected by elevated body energy reserves
- PMID: 40549708
- PMCID: PMC12184905
- DOI: 10.1371/journal.pone.0326138
The bovine oviductal environment and composition are negatively affected by elevated body energy reserves
Abstract
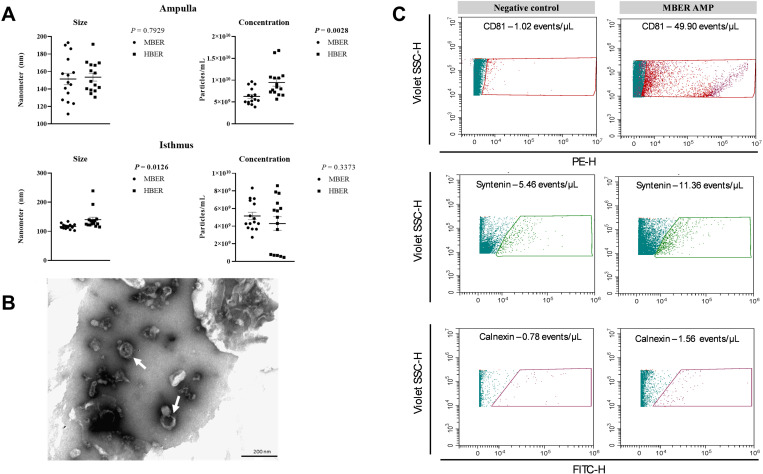
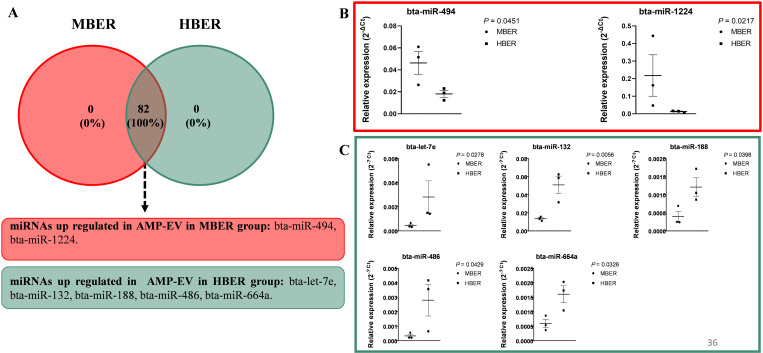
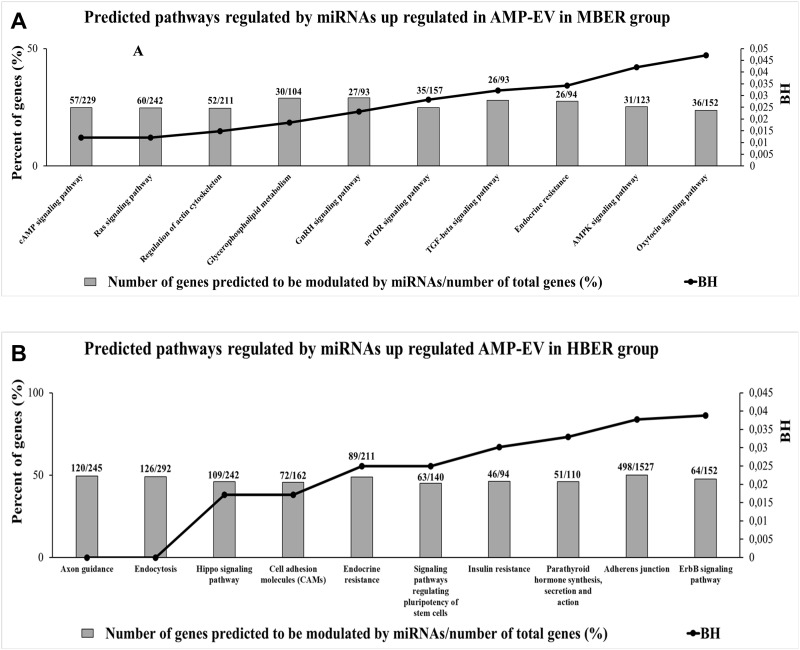
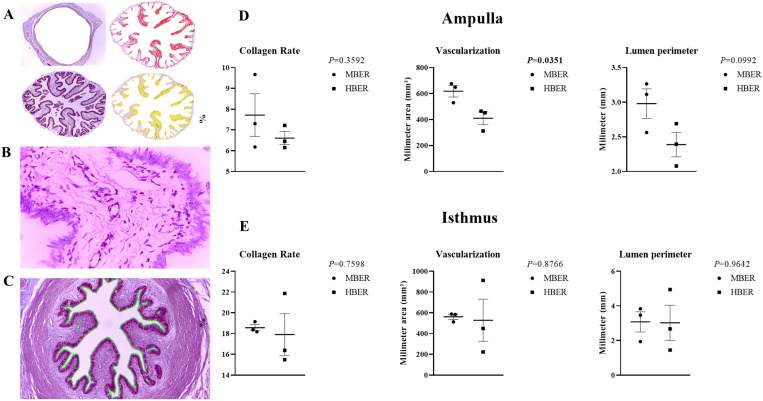
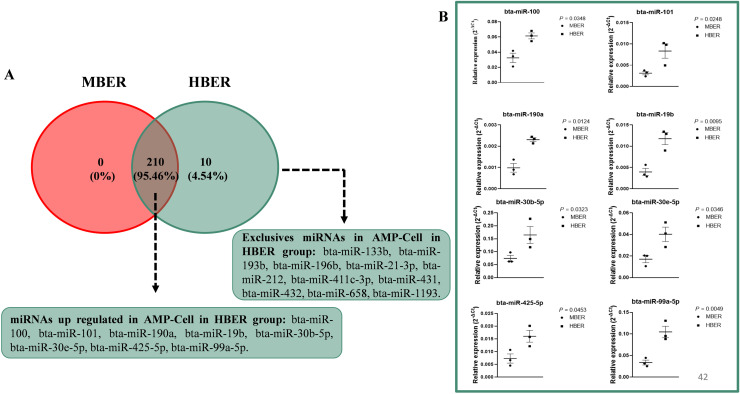
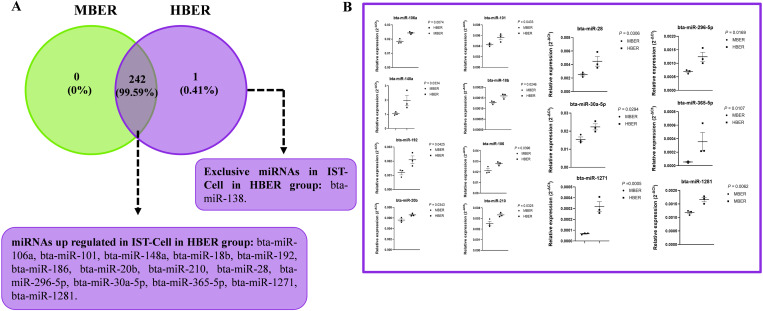
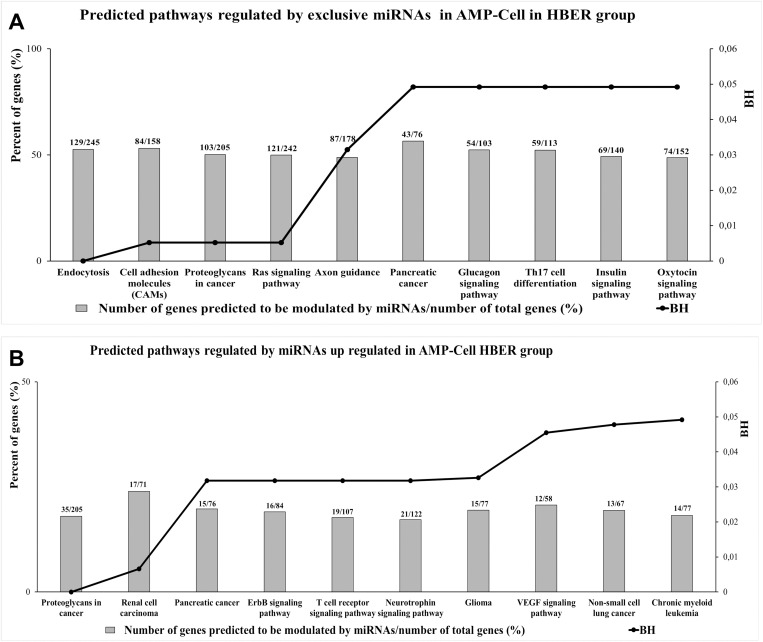
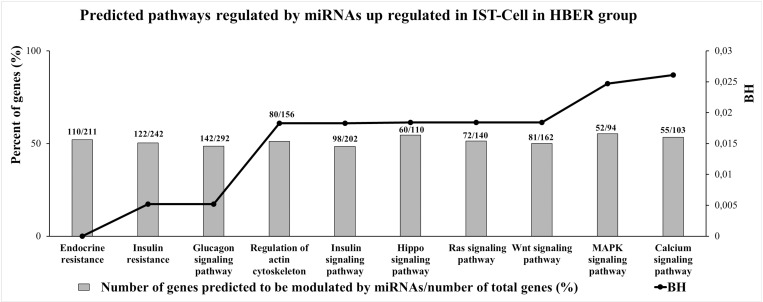
To analyze the effects of high body energy reserve (BER) within the oviductal environment and its composition, Nellore cows were fed two different nutritional plans to obtain animals with moderate BER (MBER) and high BER (HBER). After obtaining the groups with different BERs, all animals were subjected to oestrus synchronization and artificial insemination, and 120 hours after ovulation induction, the cows were slaughtered, the reproductive tract was removed, and the ipsilateral oviduct to the corpus luteum was collected and dissected. Analyses were performed only for animals that had an 8-cell embryo in the isthmus. After embryo identification, we evaluated the molecular profiles of extracellular vesicles from oviductal flushing (OF-EVs) and luminal epithelial cells (OV-Cell) and performed histomorphological analysis of oviductal tissue from the ampullary and isthmic oviductal regions. The HBER group presented higher concentrations of ampullary extracellular vesicles (AMP-EVs) and larger sizers of isthmic extracellular vesicles (IST-EVs). The miRNA profile of AMP-EVs showed that the differentially expressed miRNAs were predicted to regulate pathways associated with cell growth, migration, differentiation and metabolism, with the HBER group being more susceptible to insulin modulation. The MBER animals showed greater ampullary vascularization than the HBER animals did. Additionally, the miRNA profile and differential gene expression (DEG) data obtained for ampullary (AMP-Cell) and isthmic (IST-Cell) luminal epithelial cells revealed pathways related to insulin metabolism. Thus, elevated BER may lead to oviductal insulin resistance, affecting normal functioning and, probably, embryo metabolism during early development, thus impacting gestational rates in these animals.
Copyright: © 2025 Bastos et al. This is an open access article distributed under the terms of the Creative Commons Attribution License, which permits unrestricted use, distribution, and reproduction in any medium, provided the original author and source are credited.
Conflict of interest statement
No authors have competing interests.
Figures
Similar articles
-
Characterization and miRNA profiling of extracellular vesicles from rabbit oviduct and uterine fluids.Theriogenology. 2025 Oct 1;245:117528. doi: 10.1016/j.theriogenology.2025.117528. Epub 2025 Jun 7. Theriogenology. 2025. PMID: 40505596
-
Supplementation with oviductal EVs from the estrus, metestrus, and diestrus stages improved developmental competence of IVF mouse embryos.Sci Rep. 2025 Jul 2;15(1):23376. doi: 10.1038/s41598-025-07195-z. Sci Rep. 2025. PMID: 40603993 Free PMC article.
-
Drugs for preventing postoperative nausea and vomiting in adults after general anaesthesia: a network meta-analysis.Cochrane Database Syst Rev. 2020 Oct 19;10(10):CD012859. doi: 10.1002/14651858.CD012859.pub2. Cochrane Database Syst Rev. 2020. PMID: 33075160 Free PMC article.
-
Generation of Oviductal Glycoprotein 1 Cre Mouse Model for the Study of Secretory Epithelial Cells of the Oviduct.Endocrinology. 2024 May 27;165(7):bqae070. doi: 10.1210/endocr/bqae070. Endocrinology. 2024. PMID: 38916490 Free PMC article.
-
Systemic pharmacological treatments for chronic plaque psoriasis: a network meta-analysis.Cochrane Database Syst Rev. 2021 Apr 19;4(4):CD011535. doi: 10.1002/14651858.CD011535.pub4. Cochrane Database Syst Rev. 2021. Update in: Cochrane Database Syst Rev. 2022 May 23;5:CD011535. doi: 10.1002/14651858.CD011535.pub5. PMID: 33871055 Free PMC article. Updated.
References
-
- Avilés M, Coy P, Rizos D. The oviduct A key organ for the success of early reproductive events. Departamento de Reproducción Animal; 2015.
-
- Kölle S, Dubielzig S, Reese S, Wehrend A, König P, Kummer W. Ciliary transport, gamete interaction, and effects of the early embryo in the oviduct: ex vivo analyses using a new digital videomicroscopic system in the cow. Biol Reprod. 2009;81(2):267–74. doi: 10.1095/biolreprod.108.073874 - DOI - PubMed
MeSH terms
Substances
LinkOut - more resources
Full Text Sources
Research Materials
