

Synthetic method of analogues for emerging infectious disease forecasting
- PMID: 40549797
- PMCID: PMC12303386
- DOI: 10.1371/journal.pcbi.1013203
Synthetic method of analogues for emerging infectious disease forecasting
Abstract
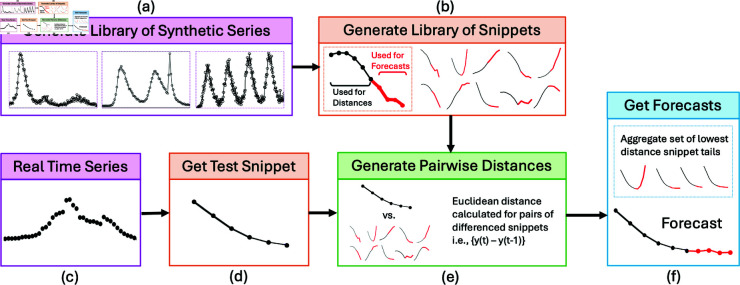
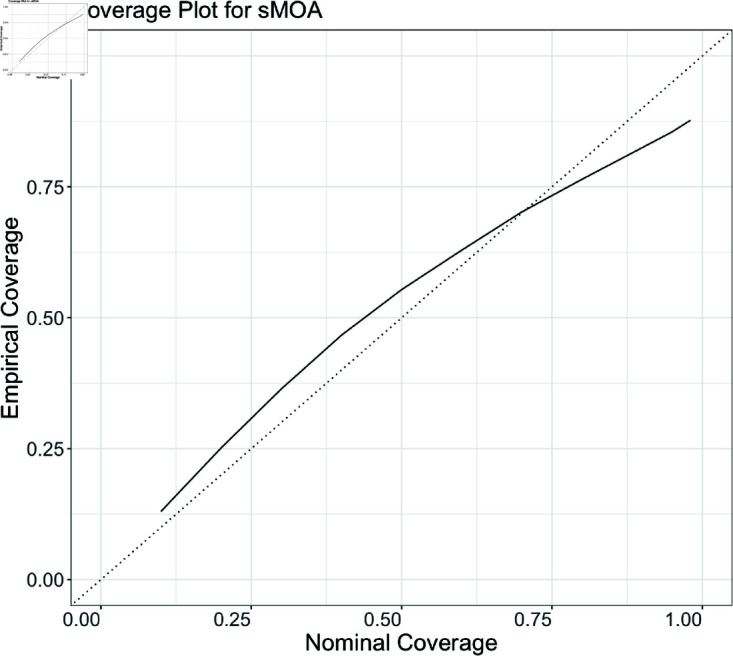
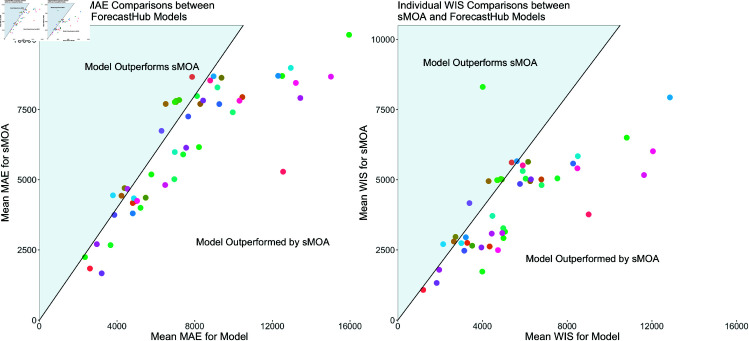
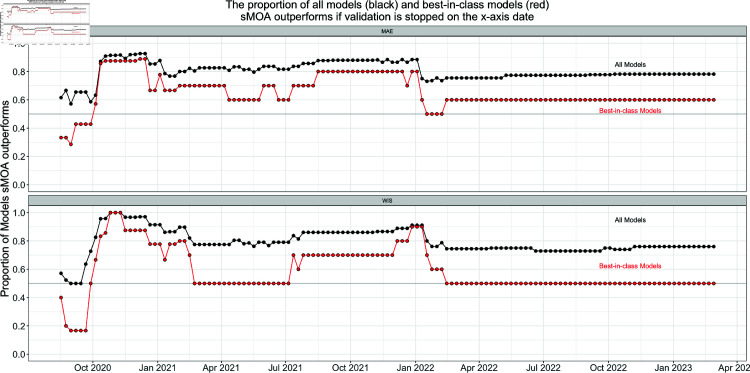
The Method of Analogues (MOA) has gained popularity in the past decade for infectious disease forecasting due to its non-parametric nature. In MOA, the local behavior observed in a time series is matched to the local behaviors of several historical time series. The known values that directly follow the historical time series that best match the observed time series are used to calculate a forecast. This non-parametric approach leverages historical trends to produce forecasts without extensive parameterization, making it highly adaptable. However, MOA is limited in scenarios where historical data is sparse. This limitation was particularly evident during the early stages of the COVID-19 pandemic, where the emerging global epidemic had little-to-no historical data. In this work, we propose a new method inspired by MOA, called the Synthetic Method of Analogues (sMOA). sMOA replaces historical disease data with a library of synthetic data that describe a broad range of possible disease trends. This model circumvents the need to estimate explicit parameter values by instead matching segments of ongoing time series data to a comprehensive library of synthetically generated segments of time series data. We demonstrate that sMOA has competitive performance with state-of-the-art infectious disease forecasting models, out-performing 78% of models from the COVID-19 Forecasting Hub in terms of averaged Mean Absolute Error and 76% of models from the COVID-19 Forecasting Hub in terms of averaged Weighted Interval Score. Additionally, we introduce a novel uncertainty quantification methodology designed for the onset of emerging epidemics. Developing versatile approaches that do not rely on historical data and can maintain high accuracy in the face of novel pandemics is critical for enhancing public health decision-making and strengthening preparedness for future outbreaks.
Copyright: This is an open access article, free of all copyright, and may be freely reproduced, distributed, transmitted, modified, built upon, or otherwise used by anyone for any lawful purpose. The work is made available under the Creative Commons CC0 public domain dedication.
Conflict of interest statement
The authors have declared that no competing interests exist.
Figures
Similar articles
-
Physical interventions to interrupt or reduce the spread of respiratory viruses.Cochrane Database Syst Rev. 2023 Jan 30;1(1):CD006207. doi: 10.1002/14651858.CD006207.pub6. Cochrane Database Syst Rev. 2023. PMID: 36715243 Free PMC article.
-
Signs and symptoms to determine if a patient presenting in primary care or hospital outpatient settings has COVID-19.Cochrane Database Syst Rev. 2022 May 20;5(5):CD013665. doi: 10.1002/14651858.CD013665.pub3. Cochrane Database Syst Rev. 2022. PMID: 35593186 Free PMC article.
-
Risk of thromboembolism in patients with COVID-19 who are using hormonal contraception.Cochrane Database Syst Rev. 2023 Jan 9;1(1):CD014908. doi: 10.1002/14651858.CD014908.pub2. Cochrane Database Syst Rev. 2023. Update in: Cochrane Database Syst Rev. 2023 May 15;5:CD014908. doi: 10.1002/14651858.CD014908.pub3. PMID: 36622724 Free PMC article. Updated.
-
Antibody tests for identification of current and past infection with SARS-CoV-2.Cochrane Database Syst Rev. 2022 Nov 17;11(11):CD013652. doi: 10.1002/14651858.CD013652.pub2. Cochrane Database Syst Rev. 2022. PMID: 36394900 Free PMC article.
-
The effect of sample site and collection procedure on identification of SARS-CoV-2 infection.Cochrane Database Syst Rev. 2024 Dec 16;12(12):CD014780. doi: 10.1002/14651858.CD014780. Cochrane Database Syst Rev. 2024. PMID: 39679851 Free PMC article.
References
-
- Amnatsan S, Yoshikawa S, Kanae S. Improved forecasting of extreme monthly reservoir inflow using an analogue-based forecasting method: a case study of the Sirikit Dam in Thailand. Water. 2018;10(11):1614. doi: 10.3390/w10111614 - DOI
-
- Simpson GL. Analogue methods in palaeoecology: using the analogue package. J Stat Soft. 2007;22(2). doi: 10.18637/jss.v022.i02 - DOI
MeSH terms
Grants and funding
LinkOut - more resources
Full Text Sources
Miscellaneous
