. 2025 Jul;122(26):e2420756122.
doi: 10.1073/pnas.2420756122. Epub 2025 Jun 23.

JunB-HBZ nuclear translocation by TGF-β is a key driver in HTLV-1-mediated leukemogenesis

Affiliations

JunB-HBZ nuclear translocation by TGF-β is a key driver in HTLV-1-mediated leukemogenesis

Wenyi Zhang et al. Proc Natl Acad Sci U S A. 2025 Jul.

Abstract

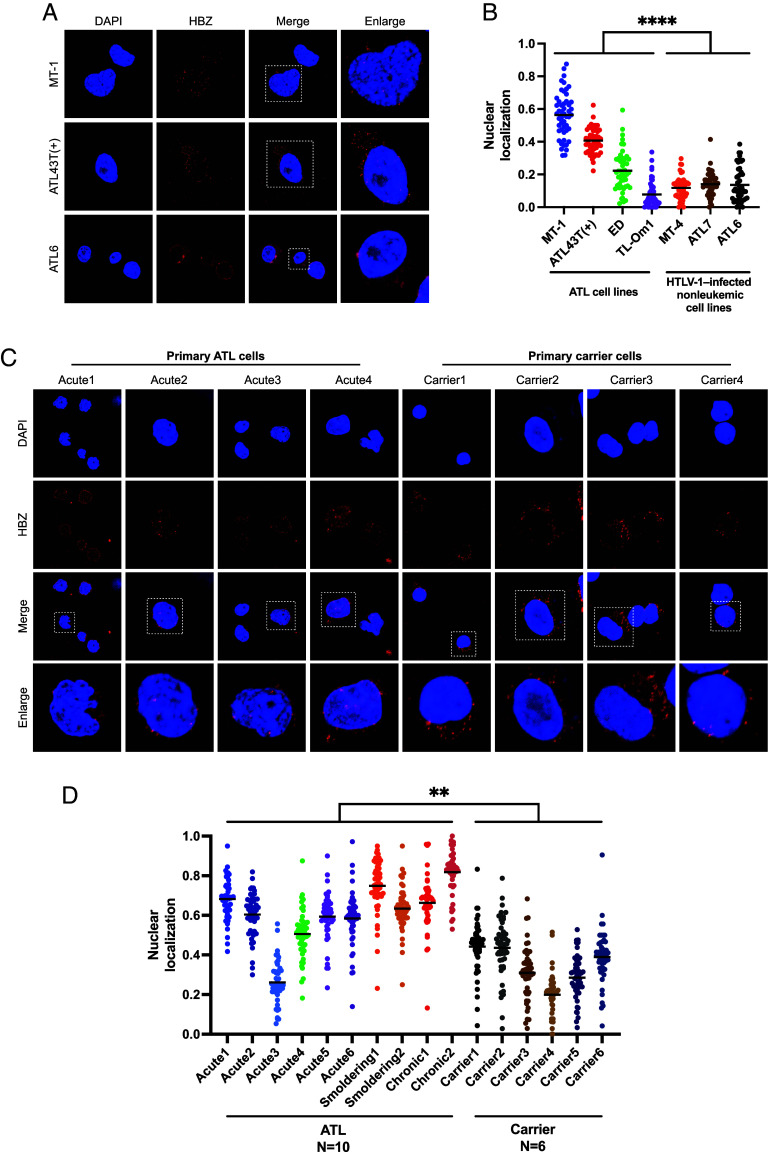
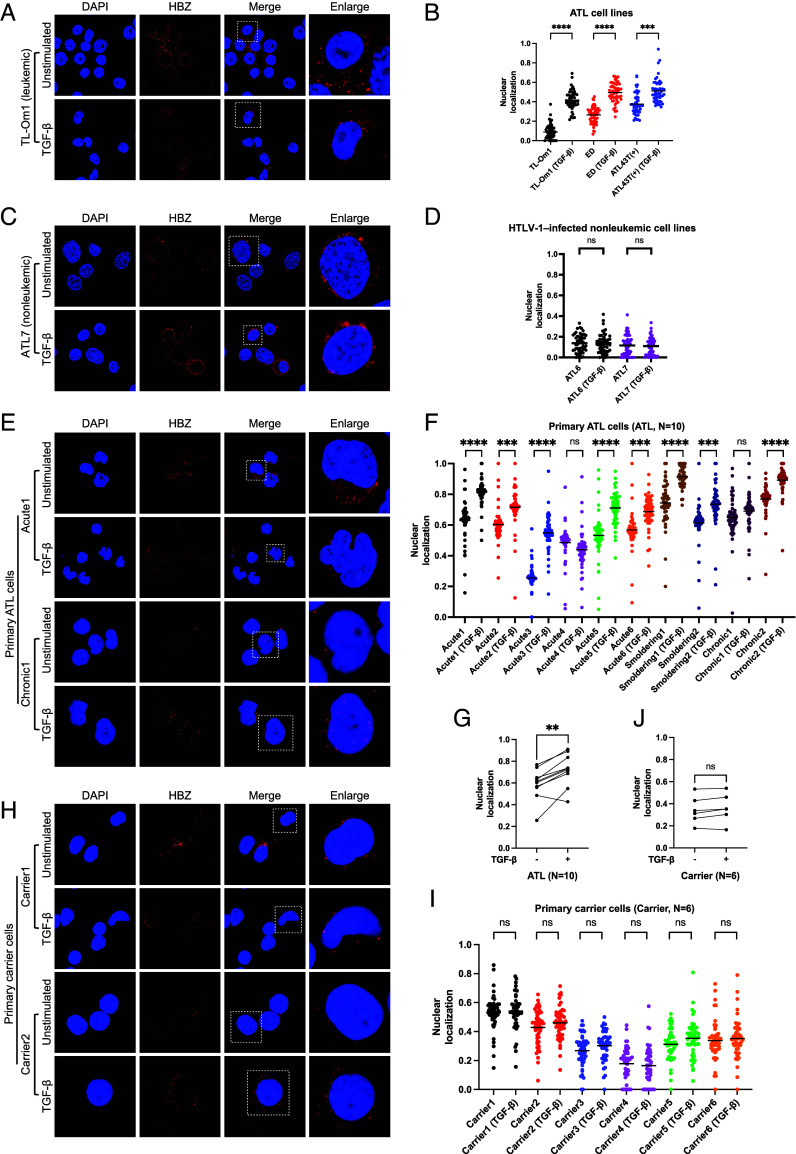
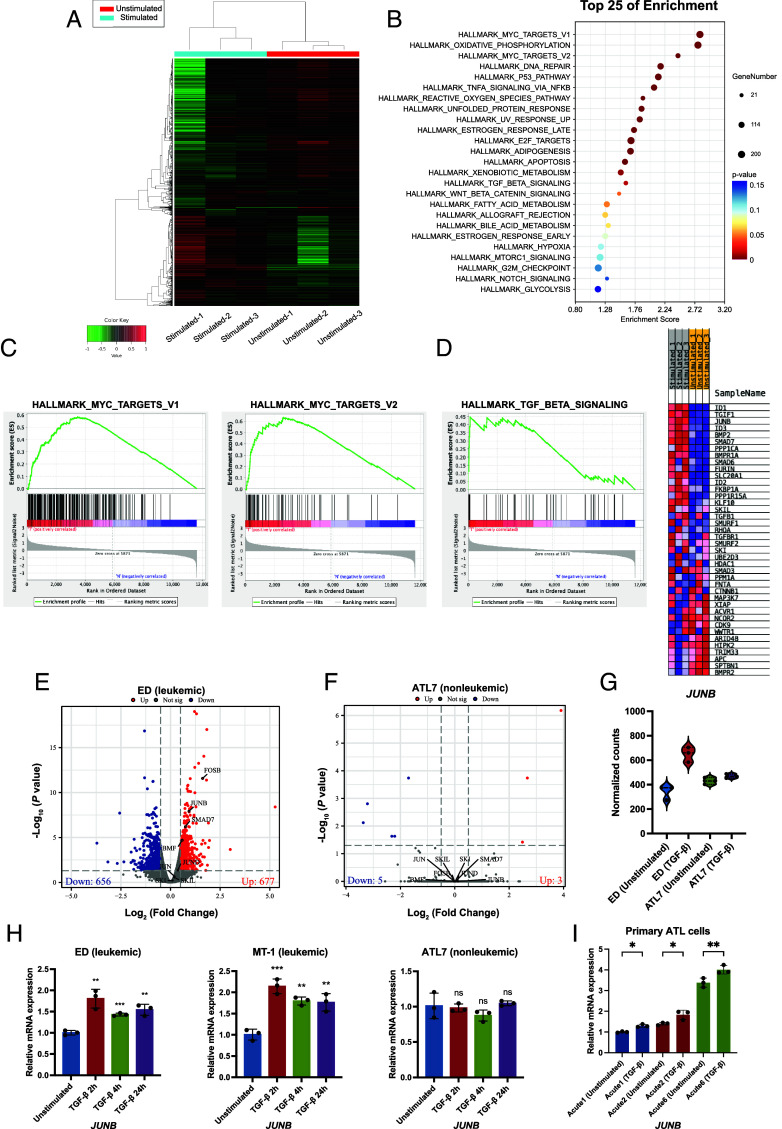
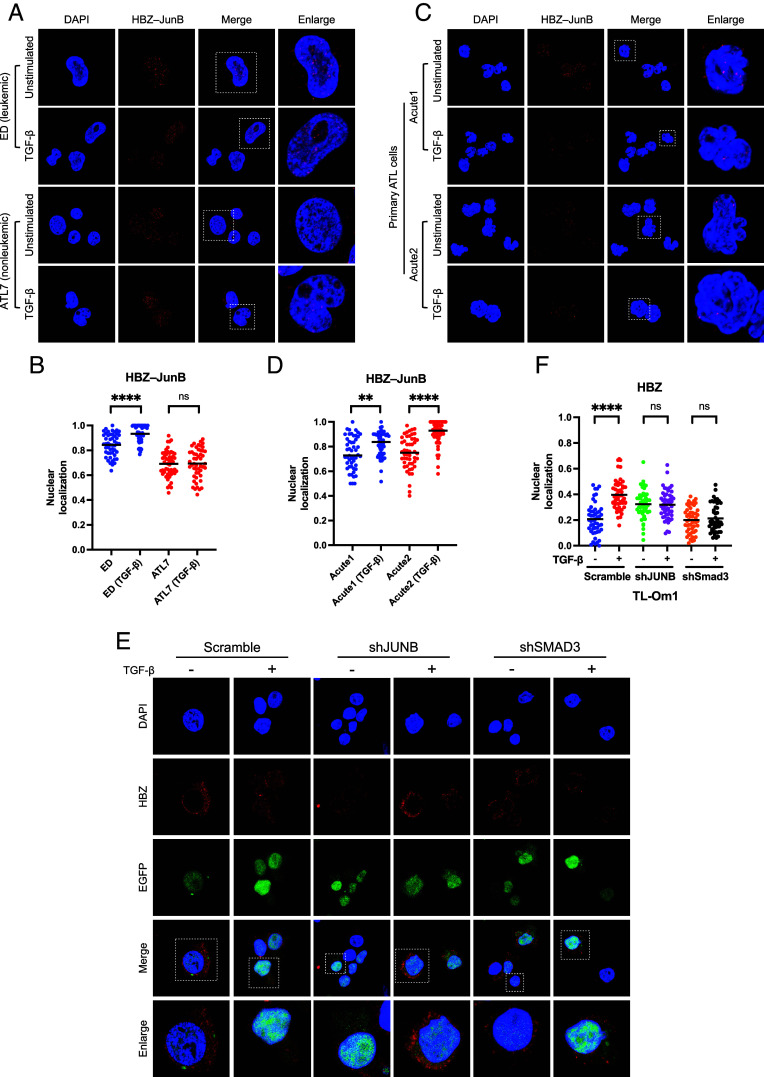
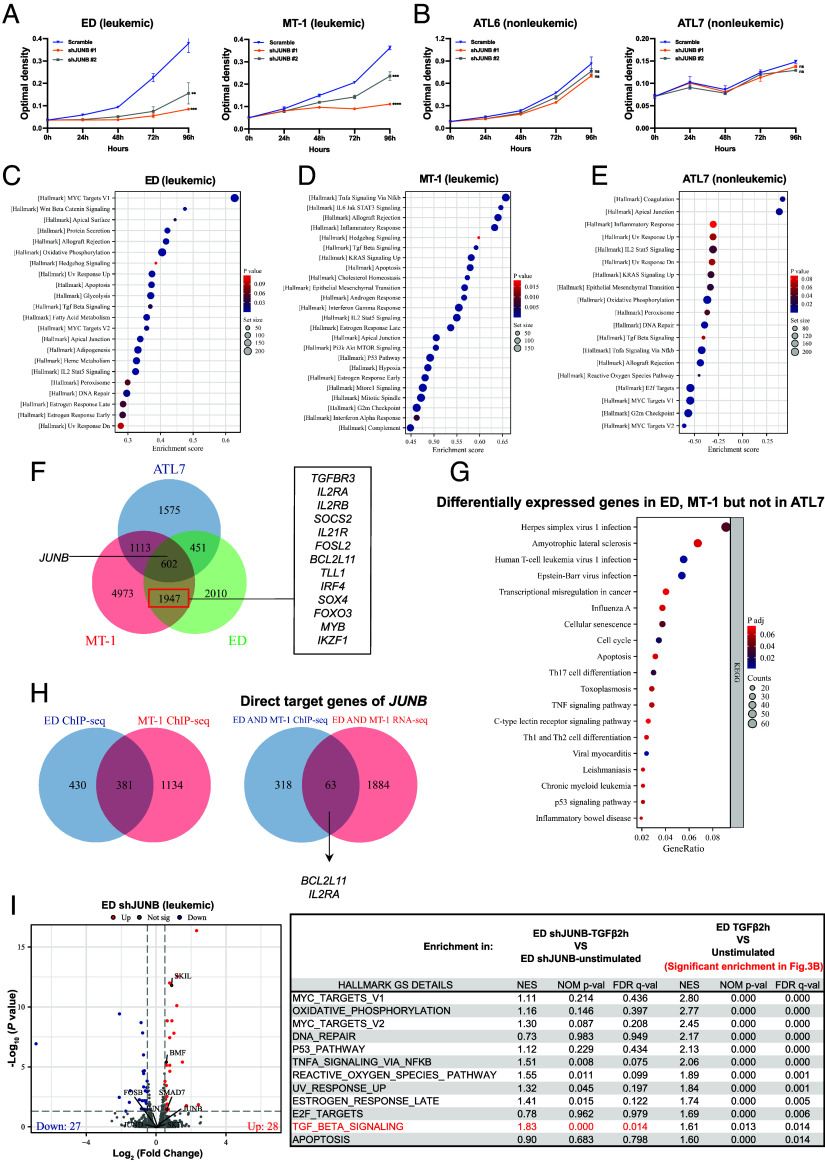
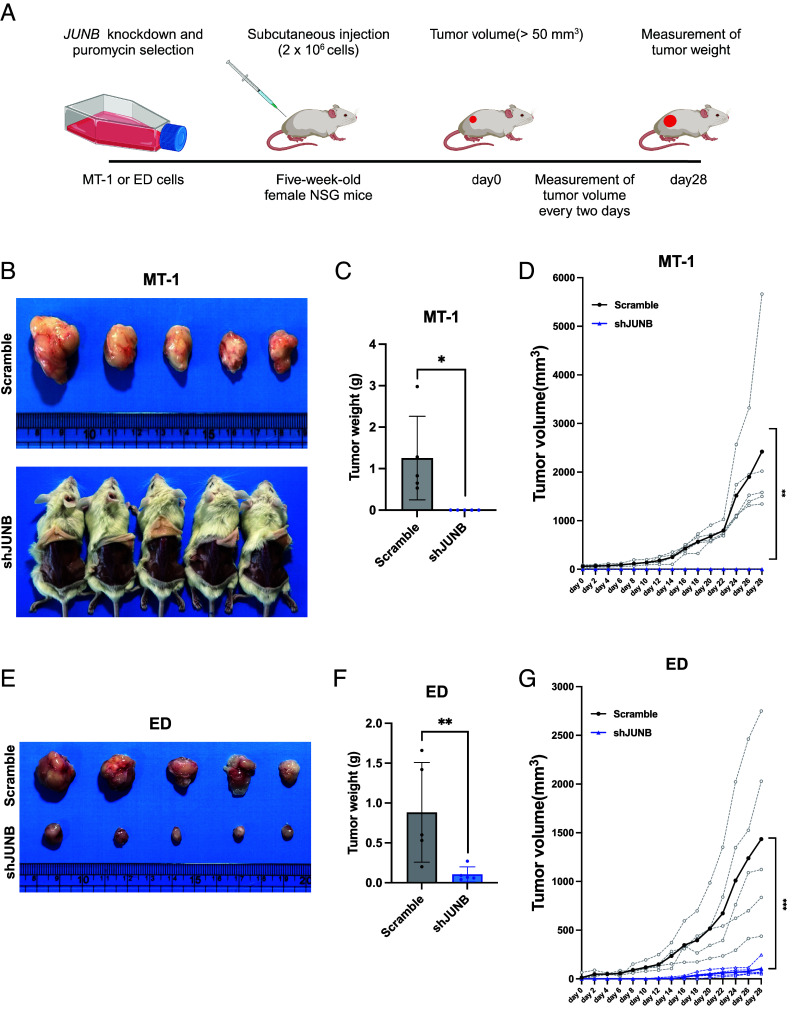
The HTLV-1 bZIP factor (HBZ) gene, which is the only viral gene conserved and consistently expressed in all adult T-cell leukemia-lymphoma (ATL) cases, is critical for ATL oncogenesis. Although HBZ protein is found in both the nucleus and the cytoplasm, the dynamics of HBZ protein localization and its contribution to oncogenesis have not been fully elucidated. In this study, we analyzed the subcellular expression pattern of HBZ in primary HTLV-1-infected T cells from asymptomatic carriers and leukemic cells of ATL patients using the Proximity Ligation Assay. Nuclear localization of HBZ protein was significantly higher in fresh ATL cells than in HTLV-1-infected cells from carriers. Importantly, translocation of HBZ protein from the cytoplasm to the nucleus after TGF-β activation was observed in ATL patients, but not in HTLV-1 carriers. In ATL cells, the cellular transcription factors JunB and pSmad3 interact with HBZ and facilitate its nuclear translocation upon TGF-β stimulation. JUNB knockdown inhibits cell proliferation in vitro and in vivo and promotes apoptosis in ATL cells but not in HTLV-1-infected nonleukemic cells, indicating that JunB has important roles in maintaining ATL cells. In conclusion, TGF-β-induced nuclear translocation of HBZ-JunB complexes is associated with ATL oncogenesis.

Keywords: ATL; HBZ; HTLV-1; JunB; TGF-β/Smad signaling pathway.


Conflict of interest statement

Competing interests statement:The authors declare no competing interest.

Figures

Fig. 1.
Fig. 1.
Intracellular localization pattern of HBZ protein in various cell lines and patient samples. (A) Localization of HBZ protein in MT-1, ATL43T (+), and ATL6 cell lines by Duolink® PLA. (B) The proportion of HBZ that is localized to the nucleus (i.e. nuclear HBZ signals divided by total HBZ signals) is shown for ATL cell lines and HTLV-1–infected nonleukemic cell lines using ImageJ. 50 randomly selected cells were analyzed for each cell line. The statistical analysis was performed using two-tailed unpaired Student’s t test, ***P < 0.0001. (C) Localization of HBZ protein in primary cells from ATL patients (n = 4) and HTLV-1–infected carriers (n = 4) by Duolink® PLA. (D) The proportion of HBZ that is localized to the nucleus was compared between ATL (N = 10) and HTLV-1–infected carrier (N = 6) samples and analyzed using ImageJ. 50 randomly selected cells were analyzed for each sample. Statistical analysis was performed by two-tailed unpaired Student’s t test. **P < 0.01. All experiments were performed at least twice.
Fig. 2.
Fig. 2.
TGF-β treatment induces nuclear translocation of HBZ protein in ATL cell lines and ATL patient samples. (A) Localization of HBZ protein in TL-Om1 with or without TGF-β treatment was detected by Duolink® PLA. (B) The proportion of HBZ protein localized to the nucleus in ATL cell lines with or without TGF-β treatment, analyzed using ImageJ. (C) Localization of HBZ protein in ATL7 with or without TGF-β treatment was detected by Duolink® PLA. (D) The proportion of HBZ protein localized to the nucleus in HTLV-1–infected non-leukemic cell lines (ATL6 and ATL7) with or without TGF-β treatment, analyzed using ImageJ. (E) Localization of HBZ protein in primary ATL cells of ATL patients with or without TGF-β treatment. (F and G) The proportion of HBZ protein that is localized to the nucleus in primary ATL cells from 10 ATL patients with or without TGF-β treatment was analyzed individually (F) and collectively (G) using ImageJ. (H) Localization of HBZ protein from primary HTLV-1–infected cells of HTLV-1–infected carriers with or without TGF-β treatment. (I and J) The proportion of HBZ protein that is localized to the nucleus in primary HTLV-1–infected cells from 6 HTLV-1–infected carriers with or without TGF-β treatment was analyzed individually (I) and collectively (J) using ImageJ. 50 randomly selected cells were analyzed for each sample. Statistical analyses were performed using two-tailed unpaired Student’s t test. **P < 0.01, ***P < 0.001, ****P < 0.0001, ns. P > 0.05. All experiments were performed at least twice.
Fig. 3.
Fig. 3.
TGF-β-dependent transcriptional regulation in ATL cells. ED cells were subjected to RNA-seq with or without 2-h TGF-β treatment. (A) Heatmap of relative mRNA expression levels in TGF-β stimulated ED cells vs. unstimulated ED cells. (B) Hallmark gene sets upregulated in ED cells upon TGF-β treatment, analyzed by GSEA. (C) Myc-associated gene signatures are significantly enriched in TGF-β stimulated ED cells compared with unstimulated ED cells, as determined by GSEA with RNA-seq. (D) Significantly enriched gene signatures for the TGF-β related gene set (Left) and enriched genes (Right) were determined by GSEA. (E) Volcano plot representing genes differentially expressed in TGF-β stimulated ED cells vs. unstimulated cells. Genes considered significantly upregulated or downregulated are highlighted in red and blue, respectively. Genes with insignificant changes are highlighted in gray. (F) Volcano plot representing genes differentially expressed in TGF-β treated ATL7 cells vs. unstimulated cells. (G) Normalized counts of JUNB in TGF-β treated ED cells and ATL7 cells vs. control cells. (H) JUNB mRNA levels in ED, MT-1, and ATL7 cell lines without or with TGF-β treatment for 2, 4, or 24 h were analyzed by RT-qPCR. (I) JUNB mRNA levels in primary ATL cells of acute-type ATL patients without or with TGF-β treatment for 4 h were analyzed by RT-qPCR. Experiments in (H) and (I) were performed in triplicate, and statistical analyses were performed using One-way ANOVA with Tukey correction. *P < 0.05, **P < 0.01, ***P < 0.001, ns. P > 0.05.
Fig. 4.
Fig. 4.
JunB plays a role in the translocation of HBZ to the nucleus induced by TGF-β treatment. (A) Complexes of JunB with HBZ in ED and ATL7 cell lines with or without TGF-β treatment were detected by Duolink® PLA. (B) The proportion of HBZ–JunB complexes that are localized to the nucleus in TGF- β treated and untreated ED and ATL7 cell lines was analyzed by ImageJ. 50 randomly selected cells were analyzed for each cell line. (C) HBZ–JunB complexes in primary ATL cells of ATL patients with acute-type with or without TGF-β treatment were detected by Duolink® PLA. (D) The proportion of HBZ–JunB complexes that are localized to the nucleus in primary ATL cells of acute-type ATL patients with or without TGF-β stimulation was analyzed by ImageJ. 50 randomly selected cells were analyzed for each sample. (E) Localization of HBZ in TL-Om1 cells infected with scramble shRNA, shJUNB, or shSMAD3 lentivirus vectors, with or without TGF-β stimulation. (F) The proportion of HBZ protein that is localized to the nucleus in (E) was analyzed by ImageJ. 50 randomly selected cells were analyzed for each sample. Statistical analyses were performed by using two-tailed unpaired Student’s t test. **P < 0.01, ****P < 0.0001, ns. P > 0.05. All experiments were performed at least twice.
Fig. 5.
Fig. 5.
JunB-dependent transcriptional regulation in ATL cells. (A) Cell growth of ED (Left) and MT-1 (Right) cells infected with shJUNB#1 or shJUNB#2 (normalized mean ± s.d. of triplicate experiments). Statistical analyses were performed using One-way ANOVA with Tukey correction. **P < 0.01, ***P < 0.001, ****P < 0.0001. (B) Cell growth of ATL6 (Left) and ATL7 (Right) cells infected with shJUNB#1 or shJUNB#2 (normalized mean ± s.d. of triplicate experiments). Statistical analyses were performed using One-way ANOVA with Tukey correction. ns. P > 0.05. (C–E) Significantly enriched gene signatures in JUNB knockdown cells, determined by GSEA with RNA-seq in ED (C), MT-1 (D), and ATL7 (E) cells. (F) Venn diagram showing the overlap of differentially expressed genes identified in JUNB knockdown cells vs control cells in ED, MT-1, and ATL7 cells. (G) Kyoto Encyclopedia of Genes and Genomes (KEGG) analysis of genes that are found to be differentially expressed (JUNB knockdown cells vs. control cells) in ED and MT-1 but not ATL7 cells. (H) Venn diagram showing the overlap of JunB target genes (by ChIP-seq) and genes found by RNA-seq to be differentially expressed in both ED and MT-1 cells, but not in ATL7 cells. (I) Volcano plot (Left) showing genes differentially expressed in TGF-β stimulated JUNB knockdown ED cells compared with unstimulated knockdown cells. Genes considered significantly upregulated or downregulated are highlighted in red and blue, respectively. Genes with insignificant changes are highlighted in gray. The table (Right) shows the GSEA of gene expression after TGF-β stimulation for JUNB knockdown cells and parental ED cells. Gene sets are significantly enriched at FDR q-value < 0.05.
Fig. 6.
Fig. 6.
JunB depletion leads to ATL tumor growth inhibition in vivo. (A) Schematic representation of the xenograft model of ATL. (B) ATL tumor growth in mice subcutaneously injected with scramble shRNA (n = 5) or shJUNB (n = 5) infected MT-1 cells. (C and D) ATL tumor weights (normalized mean ± s.d) (C) and volumes (D) in the mice subcutaneously injected with scramble shRNA (n = 5) or shJUNB (n = 5) infected MT-1 cells. (E) ATL tumor growth in mice subcutaneously injected with scramble shRNA (n = 5) or shJUNB (n = 5) infected ED cells. (F and G) ATL tumor weights (normalized mean ± s.d) (F) and volumes (G) in the mice subcutaneously injected with scramble shRNA (n = 5) or shJUNB (n = 5) infected ED cells. Statistical analysis is by two-tailed unpaired Student's t test; *P < 0.05, **P < 0.01, ***P < 0.001.

Similar articles

References

    1. Heldin C. H., Miyazono K., ten Dijke P., TGF-beta signalling from cell membrane to nucleus through SMAD proteins. Nature 390, 465–471 (1997). - PubMed
    1. Aftabi S., et al. , Therapeutic targeting of TGF-beta in lung cancer. FEBS J. 292, 1520–1557 (2024), 10.1111/febs.17234. - DOI - PMC - PubMed
    1. Proietti F. A., Carneiro-Proietti A. B., Catalan-Soares B. C., Murphy E. L., Global epidemiology of HTLV-I infection and associated diseases. Oncogene 24, 6058–6068 (2005). - PubMed
    1. Poiesz B. J., et al. , Detection and isolation of type c retrovirus particles from fresh and cultured lymphocytes of a patient with cutaneous T-cell lymphoma. Proc. Natl. Acad. Sci. U. S. A. 77, 7415–7419 (1980). - PMC - PubMed
    1. Matsuoka M., Jeang K. T., Human T-cell leukaemia virus type 1 (HTLV-1) infectivity and cellular transformation. Nat. Rev. Cancer 7, 270–280 (2007). - PubMed

MeSH terms

Substances

LinkOut - more resources