. 2025 Jul;122(26):e2507112122.
doi: 10.1073/pnas.2507112122. Epub 2025 Jun 23.

Molecular contacts in self-assembling clusters of membrane proteins

Affiliations

Molecular contacts in self-assembling clusters of membrane proteins

Venkata Shiva Mandala et al. Proc Natl Acad Sci U S A. 2025 Jul.

Abstract

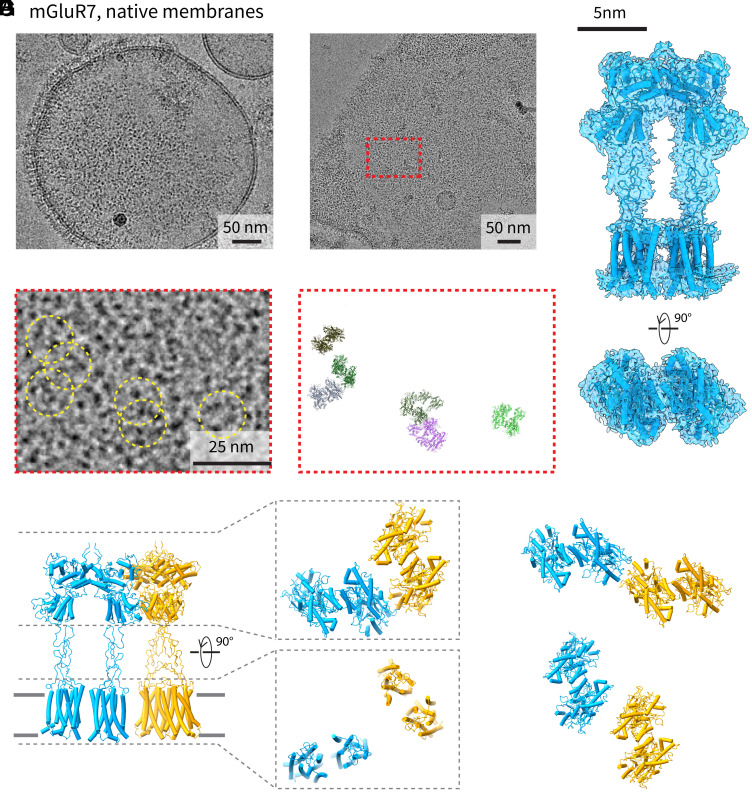
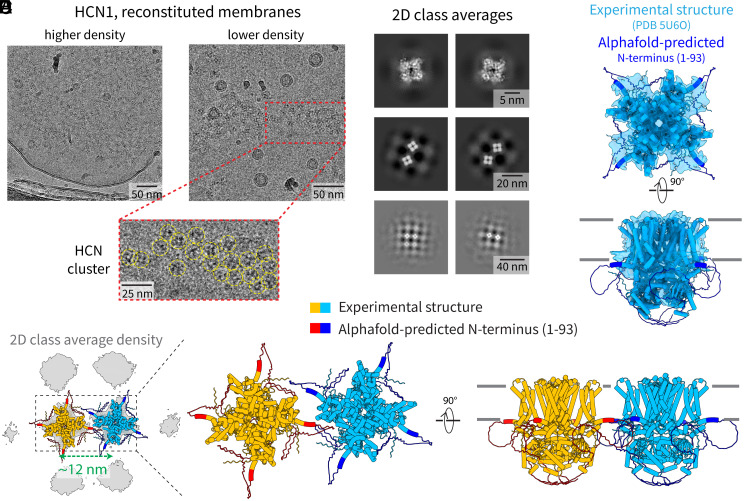
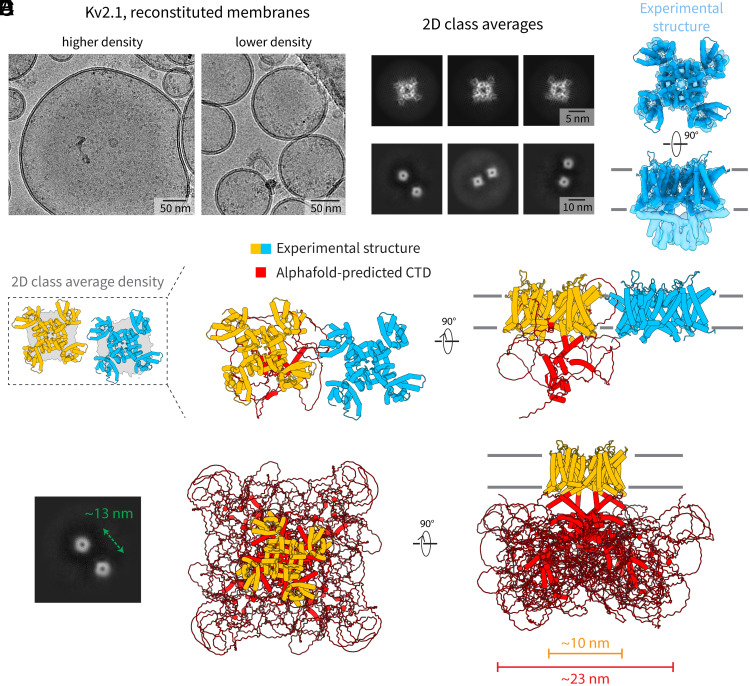
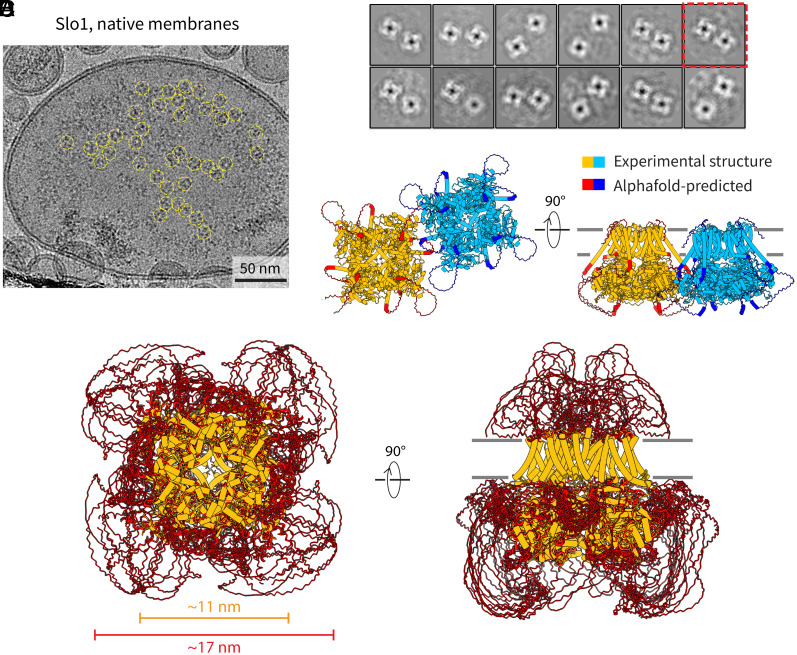
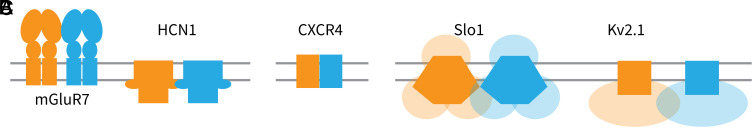
Motivated by recent data pointing to the existence of homo-oligomeric assemblies of membrane proteins called higher-order transient structures, and their apparent role in connecting components of membrane signal pathways, we examine here by cryoelectron microscopy some of the protein-protein interactions that occur in cluster formation. Metabotropic glutamate receptors and HCN ion channels inside clusters contact their neighbors through structured extracellular and intracellular domains, respectively. Other ion channels, including Kv2.1 and Slo1, appear to form clusters through prominent intrinsically disordered sequences in the cytoplasm. These distinct modes of interaction are associated with clusters exhibiting varying degrees of compactness and order. We conclude that nature utilizes a variety of ways to form connections between membrane proteins in self-assembled clusters.

Keywords: HOTS; clustering; cryo-EM; membrane proteins.


Conflict of interest statement

Competing interests statement:The authors declare no competing interest.

Figures

Fig. 1.
Fig. 1.
Clusters of mGluR7 in NMVs. (A) Cryo-EM micrograph of NMVs containing mGluR7s. The receptors form a large bulk phase cluster that is absent in the Upper Right quadrant. (B) Another micrograph showing a large mGluR7 cluster in a vesicle. (C) Cryo-EM reconstruction of the mGluR7 dimer in NMVs. The density map is shown in blue as a translucent surface and the structure of mGluR7 is shown in cartoon representation in the same color. (D) Zoomed-in region from panel B (red box) showing individual particles (marked by yellow circles) that were used in the cryo-EM reconstruction in panel C. (E) Zoomed-in region from panel B (red box) showing the orientation and locations of individual particles that were included in the density map. (F) Two dimers that are close enough to interact via their ECDs. Each dimer is shown in a different color in cartoon representation. (G) Other interacting dimer pairs showing that many interaction modes are possible with the ECDs.
Fig. 2.
Fig. 2.
Clusters of mGluR7 reconstituted into synthetic (POPC) membranes. (A) Cryo-EM micrograph of POPC vesicles containing mGluR7s. The receptors insert in both orientations but still form clusters. (B) Another image with mGluR7 clusters in a synthetic vesicle. (C) Cryo-EM reconstruction of the mGluR7 dimer in POPC vesicles. The density map is shown in blue as a translucent surface and the structure of mGluR7 is shown in cartoon representation in the same color. (D) Zoomed-in region from panel B (red box) showing individual particles (marked by yellow circles) that were used in the cryo-EM reconstruction in panel C. (E) Zoomed-in region from panel B (red box) showing the orientation and locations of individual particles that were included in the density map. (F) Two dimers that are close enough to interact via their ECDs. Each dimer is shown in a different color in cartoon representation. (G) Other interacting dimer pairs showing that many interaction modes are possible with the ECDs. (H) Two-dimensional (2D) class averages showing similar pairs of interacting dimers in NMVs (Top row) and in synthetic (POPC) vesicles (Bottom row).
Fig. 3.
Fig. 3.
Ordered clusters of HCN1 in POPC membranes. (A) Representative cryo-EM images of POPC membranes containing HCN1 channels at higher density (Left) or at lower density (Right). An expanded view of an HCN1 cluster from the membrane with lower HCN1 density is shown in the red box. Individual HCN1 channels in the cluster are marked by yellow circles. (B) Two-dimensional class averages at different length scales, showing individual channels (Top row), interacting pairs of channels (Middle row), and the structure of the ordered lattice (Bottom row). (C) Cryo-EM reconstruction of the tetrameric HCN1 channel in POPC vesicles. The density map is shown in blue as a translucent surface and the structure of HCN1 is shown in cartoon representation in the same color. The AlphaFold-predicted N terminus (residues 1 to 93) that is not resolved in the detergent structure is shown in dark blue. (D) 2D cryo-EM density of the HCN1 lattice is shown in gray, and the two channels that were placed into the lattice are shown in cartoon representation. (E) Structural model of the two interacting HCN1 channels shown in cartoon representation with each in a different color. The detergent structure of HCN1 is shown in orange/light blue and the AlphaFold-predicted N terminus is shown in red/dark blue. The channels are not close enough to interact via their transmembrane or visible cytoplasmic domains but rather via contact sites close to the N terminus of the channel.
Fig. 4.
Fig. 4.
Clusters of Kv2.1 channels in POPC membranes. (A) Representative cryo-EM images of POPC membranes containing Kv2.1 channels at higher density (Left) or at lower density (Right). (B) Two-dimensional class averages showing individual channels (Top row) and interacting pairs of channels (Bottom row). (C) Cryo-EM reconstruction of the tetrameric Kv2.1 channel. The density map is shown in blue as a translucent surface and the structure of Kv2.1 in membranes is shown in cartoon representation in the same color. (D) 2D class average of the pair of channels that are closest to each other is shown in gray, with the two molecules that were placed into the map shown in cartoon representation. The expanded view shows a structural model of the two interacting Kv2.1 channels shown in cartoon representation. The structure of Kv2.1 in membranes is shown in orange/light blue and the AlphaFold-predicted cytoplasmic domain and C-terminus are shown in red for one subunit in the orange channel. (E) 2D class average (Left, reproduced from panel B) of a pair of channels that are further apart, showing that the ordered domains are too far apart to touch each other. A structural model of a single Kv2.1 tetramer (Right) showing the ordered transmembrane structure in orange, and the AlphaFold-predicted cytoplasmic domain and C-terminus in red, to show the expanded “footprint” of the channel. To emphasize the flexible nature of the C-terminal loops, four AlphaFold-predicted models are overlaid.
Fig. 5.
Fig. 5.
Clusters of Slo1 channels in NMVs. (A) Representative cryo-EM micrograph of NMVs containing Slo1 channels. (B) Two-dimensional class averages of proximal pairs of Slo1 channels. The class that was selected for panel C is marked by the red box. (C) Structural model of two interacting Slo1 channels shown in cartoon representation. The structure of Slo1 in membranes is shown in orange/light blue and the AlphaFold-predicted loops shown in red/dark blue. (D) Structural model of a single Slo1 tetramer showing the ordered transmembrane structure and cytoplasmic domain in orange, and the AlphaFold-predicted loops in red, to show the footprint of the channel. To emphasize the flexible nature of the loops, 10 AlphaFold-predicted models are overlaid.
Fig. 6.
Fig. 6.
Schematic showing the different ways membrane proteins can self-interact. Membrane proteins contact each other in self-interacting clusters in a variety of ways, including through (A) ordered domains outside the membrane bilayer as in the cases of mGluR7 and HCN, (B) ordered TMDs (e.g., CXCR4), and (C) disordered domains outside the membrane bilayer (e.g., Slo1 and Kv2.1).

Similar articles

References

    1. Zhang Y., et al. , Higher-order transient membrane protein structures. Proc. Natl. Acad. Sci. U.S.A. 122, e2421275121 (2025). - PMC - PubMed
    1. Zhang Y., MacKinnon R., Higher-order transient structures and the principle of dynamic connectivity in membrane signaling. Proc. Natl. Acad. Sci. U.S.A. 122, e2421280121 (2025). - PMC - PubMed
    1. Hilger D., Masureel M., Kobilka B. K., Structure and dynamics of GPCR signaling complexes. Nat. Struct. Mol. Biol. 25, 4–12 (2018). - PMC - PubMed
    1. Weis W. I., Kobilka B. K., The molecular basis of G protein-coupled receptor activation. Annu. Rev. Biochem. 87, 897–919 (2018). - PMC - PubMed
    1. Touhara K. K., MacKinnon R., Molecular basis of signaling specificity between GIRK channels and GPCRs. Elife 7, e42908 (2018). - PMC - PubMed

MeSH terms

Substances

LinkOut - more resources