

Multinucleated giant cells are hallmarks of ovarian aging with unique immune and degradation-associated molecular signatures
- PMID: 40550000
- PMCID: PMC12185119
- DOI: 10.1371/journal.pbio.3003204
Multinucleated giant cells are hallmarks of ovarian aging with unique immune and degradation-associated molecular signatures
Abstract
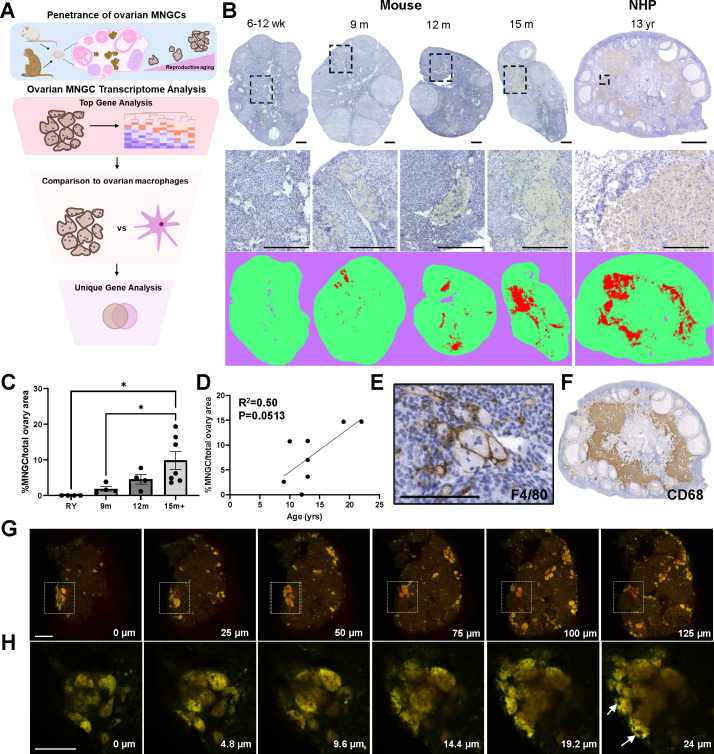
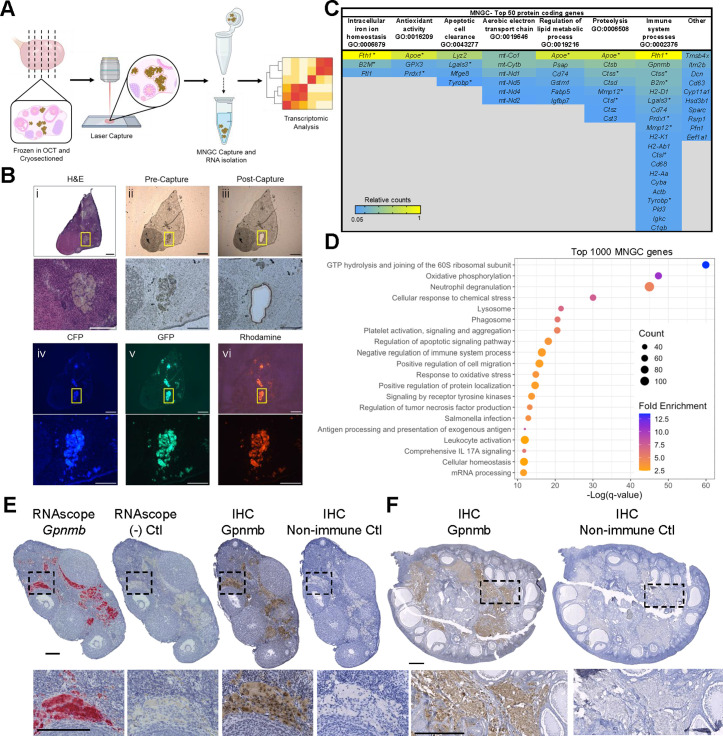
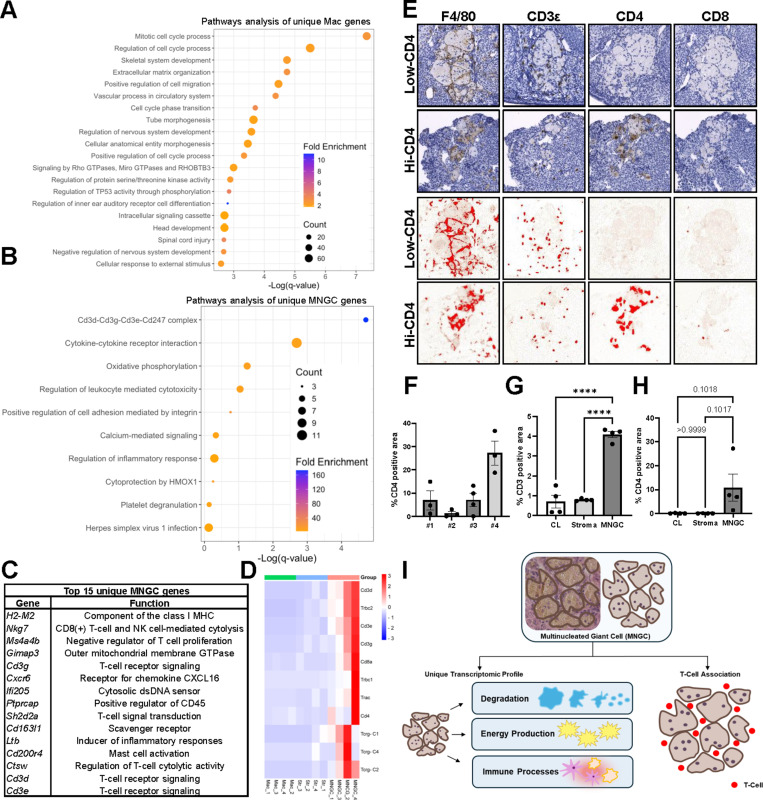
The ovary is one of the first organs to exhibit signs of aging, characterized by reduced tissue function, chronic inflammation, and fibrosis. Multinucleated giant cells (MNGCs), formed by macrophage fusion, typically occur in chronic immune pathologies, including infectious and non-infectious granulomas and the foreign body response, but are also observed in the aging ovary. The function and consequence of ovarian MNGCs remain unknown as their biological activity is highly context-dependent, and their large size has limited their isolation and analysis through technologies such as single-cell RNA sequencing. In this study, we define ovarian MNGCs through a deep analysis of their presence across age and species using advanced imaging technologies as well as their unique transcriptome using laser capture microdissection. MNGCs form complex interconnected networks that increase with age in both mouse and nonhuman primate ovaries. MNGCs are characterized by high Gpnmb expression, a putative marker of ovarian and non-ovarian MNGCs. Pathway analysis highlighted functions in apoptotic cell clearance, lipid metabolism, proteolysis, immune processes, and increased oxidative phosphorylation and antioxidant activity. Thus, MNGCs have signatures related to degradative processes, immune function, and high metabolic activity. These processes were enriched in MNGCs compared to primary ovarian macrophages, suggesting discrete functionality. MNGCs express CD4 and colocalize with T-cells, which were enriched in regions of MNGCs, indicative of a close interaction between these immune cell types. These findings implicate MNGCs in modulation of the ovarian immune landscape during aging given their high penetrance and unique molecular signature that supports degradative and immune functions.
Copyright: © 2025 Converse et al. This is an open access article distributed under the terms of the Creative Commons Attribution License, which permits unrestricted use, distribution, and reproduction in any medium, provided the original author and source are credited.
Conflict of interest statement
The authors have declared that no competing interests exist.
Figures

Update of
-
Multinucleated giant cells are hallmarks of ovarian aging with unique immune and degradation-associated molecular signatures.bioRxiv [Preprint]. 2024 Dec 5:2024.12.03.626649. doi: 10.1101/2024.12.03.626649. bioRxiv. 2024. Update in: PLoS Biol. 2025 Jun 23;23(6):e3003204. doi: 10.1371/journal.pbio.3003204. PMID: 39677686 Free PMC article. Updated. Preprint.
Comment in
-
The aging ovary stands on the shoulders of giant multinucleated cells.PLoS Biol. 2025 Jun 24;23(6):e3003216. doi: 10.1371/journal.pbio.3003216. eCollection 2025 Jun. PLoS Biol. 2025. PMID: 40554744 Free PMC article.
Similar articles
-
Multinucleated giant cells are hallmarks of ovarian aging with unique immune and degradation-associated molecular signatures.bioRxiv [Preprint]. 2024 Dec 5:2024.12.03.626649. doi: 10.1101/2024.12.03.626649. bioRxiv. 2024. Update in: PLoS Biol. 2025 Jun 23;23(6):e3003204. doi: 10.1371/journal.pbio.3003204. PMID: 39677686 Free PMC article. Updated. Preprint.
-
Signs and symptoms to determine if a patient presenting in primary care or hospital outpatient settings has COVID-19.Cochrane Database Syst Rev. 2022 May 20;5(5):CD013665. doi: 10.1002/14651858.CD013665.pub3. Cochrane Database Syst Rev. 2022. PMID: 35593186 Free PMC article.
-
A rapid and systematic review of the clinical effectiveness and cost-effectiveness of topotecan for ovarian cancer.Health Technol Assess. 2001;5(28):1-110. doi: 10.3310/hta5280. Health Technol Assess. 2001. PMID: 11701100
-
Systemic pharmacological treatments for chronic plaque psoriasis: a network meta-analysis.Cochrane Database Syst Rev. 2021 Apr 19;4(4):CD011535. doi: 10.1002/14651858.CD011535.pub4. Cochrane Database Syst Rev. 2021. Update in: Cochrane Database Syst Rev. 2022 May 23;5:CD011535. doi: 10.1002/14651858.CD011535.pub5. PMID: 33871055 Free PMC article. Updated.
-
Systemic pharmacological treatments for chronic plaque psoriasis: a network meta-analysis.Cochrane Database Syst Rev. 2017 Dec 22;12(12):CD011535. doi: 10.1002/14651858.CD011535.pub2. Cochrane Database Syst Rev. 2017. Update in: Cochrane Database Syst Rev. 2020 Jan 9;1:CD011535. doi: 10.1002/14651858.CD011535.pub3. PMID: 29271481 Free PMC article. Updated.
Cited by
-
Studying ovarian aging and its health impacts: modern tools and approaches.Genes Dev. 2025 Aug 1;39(15-16):975-990. doi: 10.1101/gad.352732.125. Genes Dev. 2025. PMID: 40639912 Free PMC article. Review.
-
The aging ovary stands on the shoulders of giant multinucleated cells.PLoS Biol. 2025 Jun 24;23(6):e3003216. doi: 10.1371/journal.pbio.3003216. eCollection 2025 Jun. PLoS Biol. 2025. PMID: 40554744 Free PMC article.
References
-
- Duncan FE, Confino R, Pavone ME. Female reproductive aging: From consequences to mechanisms, markers, and treatments. Conn’s Handbook of Models for Human Aging. 2018. p. 109–30. doi: 10.1016/b978-0-12-811353-0.00009-9 - DOI
MeSH terms
Substances
Grants and funding
LinkOut - more resources
Full Text Sources
Medical
Research Materials
