

Relationship between the weight-adjusted-waist index and urinary incontinence in women: A cross-sectional study of NHANES 2007 to 2020
- PMID: 40550030
- PMCID: PMC12187322
- DOI: 10.1097/MD.0000000000042996
Relationship between the weight-adjusted-waist index and urinary incontinence in women: A cross-sectional study of NHANES 2007 to 2020
Abstract
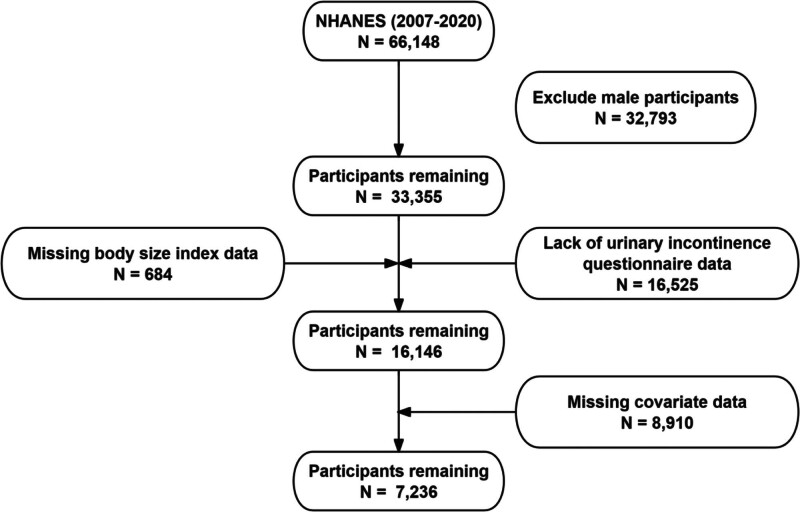
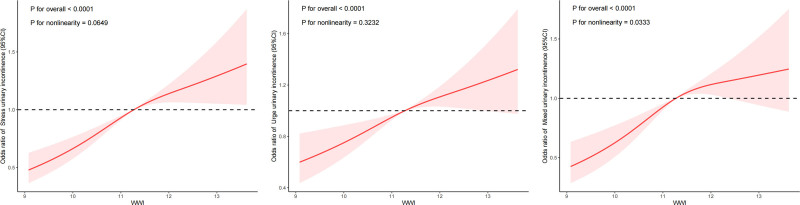
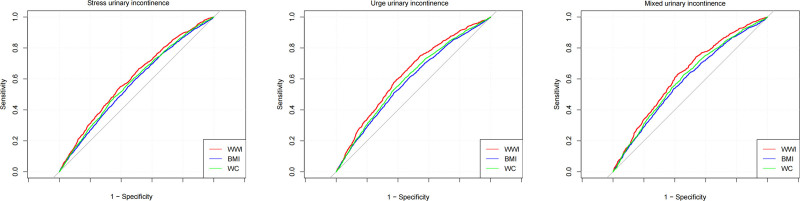
This study investigated the relationship between the weight-adjusted-waist index (WWI), calculated as waist circumference (WC) divided by the square root of weight, and the risk of 3 types of urinary incontinence (UI) in women. Data from the National Health and Nutrition Examination Survey spanning 2007 to 2020 were analyzed, including 7236 female participants aged 20 years and older. UI types (stress UI [SUI], urgency UI [UUI], and mixed UI [MUI]) were classified based on self-reported questionnaires. Multivariate logistic regression models were used to assess the association between WWI and UI, adjusting for covariates such as age, race, marital status, education level, and comorbidities. Subgroup analyses were conducted to evaluate the consistency of associations across different age groups, body mass index (BMI) categories, and racial backgrounds. Additionally, dose-response relationships were examined, and receiver operating characteristic curve analysis was performed to compare the predictive ability of WWI, BMI, and WC for UI. The results revealed that the prevalence rates of SUI, UUI, and MUI were 47.55%, 29.09%, and 18.14%, respectively. Higher WWI was significantly associated with increased risks of all 3 UI types. In the fully adjusted model (Model 4), the odds ratios for SUI, UUI, and MUI were 1.28 (95% confidence interval [CI]: 1.18-1.37), 1.17 (95% CI: 1.08-1.28), and 1.23 (95% CI: 1.13-1.34), respectively. Subgroup analyses confirmed consistent associations across various demographic and clinical subgroups. Receiver operating characteristic curve analysis demonstrated that WWI had superior discrimination ability compared to BMI and WC, with higher area under the curve (AUC) values for SUI (AUC = 0.601), UUI (AUC = 0.630), and MUI (AUC = 0.628). In conclusion, this study highlights a significant association between higher WWI and increased risks of SUI, UUI, and MUI in women. WWI may serve as a more effective anthropometric indicator for assessing UI risk compared to traditional measures like BMI and WC, offering potential utility in clinical and public health settings for identifying individuals at higher risk of UI and guiding targeted prevention strategies.
Keywords: NHANES; cross-sectional study; obesity; urinary incontinence (UI); weight-adjusted-waist index (WWI).
Copyright © 2025 the Author(s). Published by Wolters Kluwer Health, Inc.
Conflict of interest statement
The authors have no conflicts of interest to disclose.
Figures
References
-
- Coyne KS, Kvasz M, Ireland AM, Milsom I, Kopp ZS, Chapple CR. Urinary incontinence and its relationship to mental health and health-related quality of life in men and women in Sweden, the United Kingdom, and the United States. Eur Urol. 2012;61:88–95. - PubMed
-
- Irwin DE, Kopp ZS, Agatep B, Milsom I, Abrams P. Worldwide prevalence estimates of lower urinary tract symptoms, overactive bladder, urinary incontinence and bladder outlet obstruction: WORLDWIDE PREVALENCE OF LUTS. BJU International. 2011;108:1132–8. - PubMed
-
- Piché M-E, Tchernof A, Després J-P. obesity phenotypes, diabetes, and cardiovascular diseases. Circ Res. 2020;126:1477–500. - PubMed
MeSH terms
LinkOut - more resources
Full Text Sources
Medical
