

A Golgi apparatus-related signature for predicting prognosis and evaluating the tumor immune microenvironment of uveal melanoma
- PMID: 40550052
- PMCID: PMC12187299
- DOI: 10.1097/MD.0000000000042909
A Golgi apparatus-related signature for predicting prognosis and evaluating the tumor immune microenvironment of uveal melanoma
Abstract
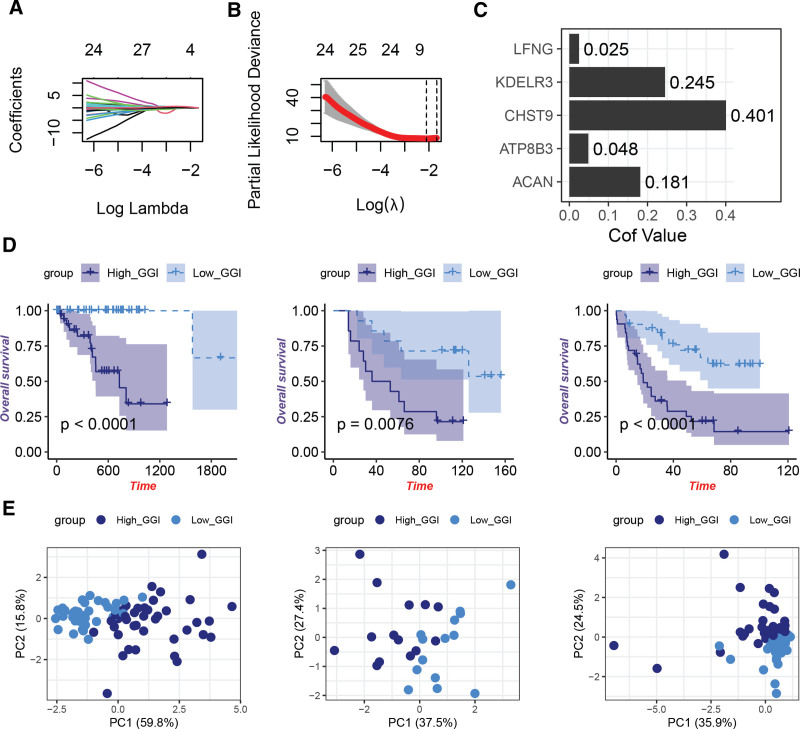
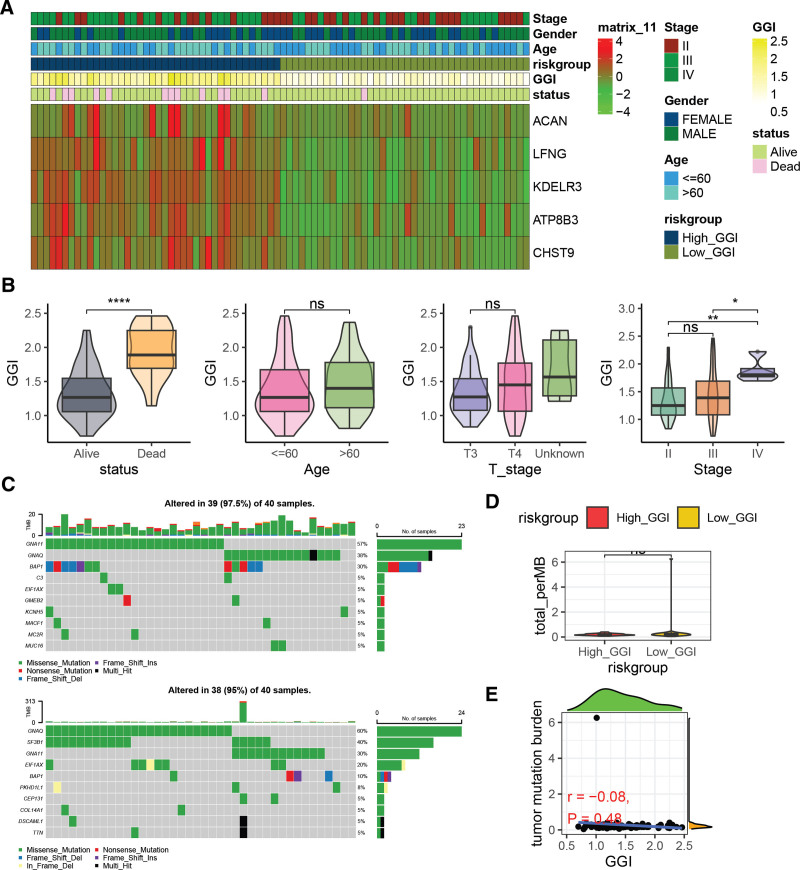
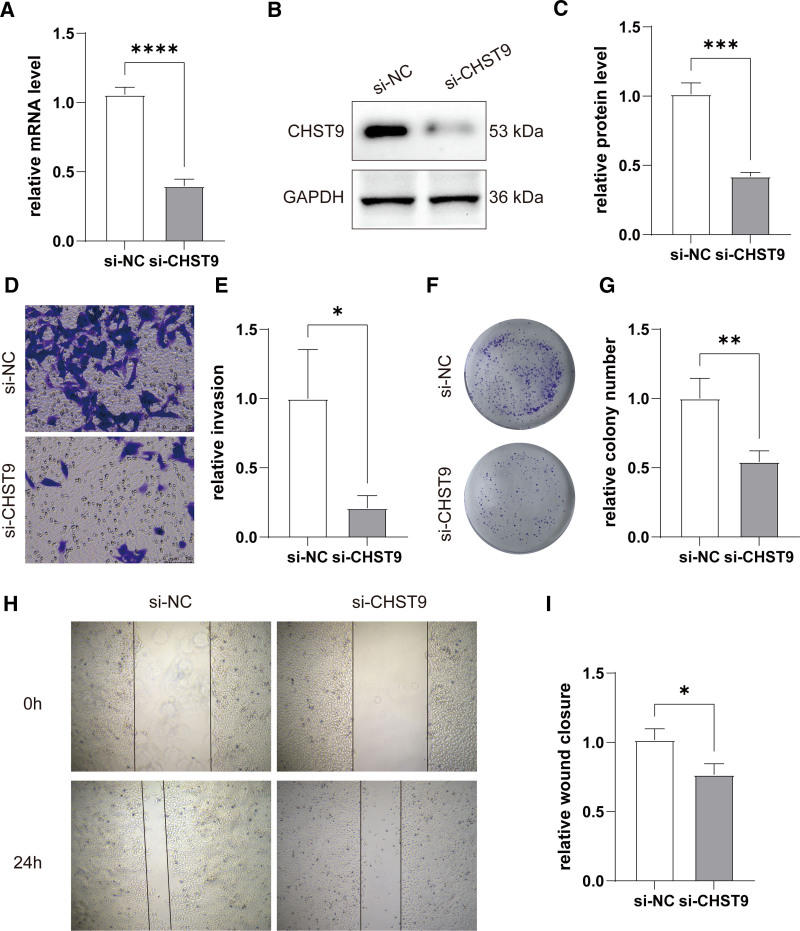
Uveal melanoma (UVM), a highly invasive and metastatic primary eye cancer with poor prognosis, contributes significantly to melanoma-related deaths despite being less common. Despite advances in therapy, the mortality rate remains unchanged due to frequent liver metastases and limited effective prognostic biomarkers. This study employed gene expression data from The Cancer Genome Atlas and Gene Expression Omnibus databases to investigate Golgi apparatus-related gene sets (GGRGs) in UVM. Survival analysis, consensus clustering, and principal component analysis were conducted to identify GGRGs associated with patient outcomes. Additionally, tumor microenvironment was assessed using IOBR tools, and a nomogram was constructed based on Cox regression models for predicting survival probabilities. The biological function of carbohydrate sulfotransferase protein family (CHST9) was evaluated by colony formation assay, transwell invasion assay, and wound healing assay. Univariate Cox regression identified 343 GGRGs significantly correlated with UVM prognosis. Consensus clustering revealed 2 distinct subtypes (cluster1 and cluster2) differing significantly in survival, with cluster2 showing more favorable outcomes. Principal component analysis effectively separated these clusters, while Kaplan-Meier curves confirmed their survival disparity. Least Absolute Shrinkage and Selection Operator Cox regression analysis pinpointed a 5-GGRGs-based signature, termed GGRGs-derived index (GGI), composed of lunatic fringe, KDELR3, CHST9, ATP8B3, and ACAN. This GGI stratified UVM cases into High_GGI and Low_GGI groups across multiple datasets, with the Low_GGI group consistently demonstrating significantly improved survival rates compared to the High_GGI group. Notably, the Low_GGI and High_GGI groups exhibited marked differences in clinicopathological characteristics, drug sensitivities, and immune infiltration levels. Ultimately, GGI and age emerged as independent prognostic factors for UVM and were incorporated into a nomogram, which displayed outstanding performance in predicting patient prognosis. Depletion of CHST9 expression dramatically inhibited the proliferative capacity of UVM cells, concurrently suppressing their metastatic activity and invasive properties. GGRGs are promising predictors of UVM prognosis and may inform personalized treatment strategies, contributing to a deeper understanding of the molecular mechanisms driving this aggressive cancer.
Keywords: consensus clustering; drug sensitivities; golgi apparatus; immune infiltration; uveal melanoma.
Copyright © 2025 the Author(s). Published by Wolters Kluwer Health, Inc.
Conflict of interest statement
The authors have no conflicts of interest to disclose.
Figures


Similar articles
-
A newly developed ferroptosis-related gene signature for forecasting prognosis in uveal melanoma.Methods. 2025 Oct;242:187-199. doi: 10.1016/j.ymeth.2025.08.001. Epub 2025 Aug 6. Methods. 2025. PMID: 40763838
-
Construction of an immune-related prognostic model and functional analysis of CEBPB in uveal melanoma: A STROBE-compliant observational study.Medicine (Baltimore). 2025 Jun 20;104(25):e42574. doi: 10.1097/MD.0000000000042574. Medicine (Baltimore). 2025. PMID: 40550050 Free PMC article.
-
Elevated Stanniocalcin-1 Expression in Uveal Melanoma Predicts Poor Patient Prognosis.Cancer Genomics Proteomics. 2025 Jun 26;22(4):624-631. doi: 10.21873/cgp.20526. Cancer Genomics Proteomics. 2025. PMID: 40571316 Free PMC article.
-
Cost-effectiveness of using prognostic information to select women with breast cancer for adjuvant systemic therapy.Health Technol Assess. 2006 Sep;10(34):iii-iv, ix-xi, 1-204. doi: 10.3310/hta10340. Health Technol Assess. 2006. PMID: 16959170
-
Sex and gender as predictors for allograft and patient-relevant outcomes after kidney transplantation.Cochrane Database Syst Rev. 2024 Dec 19;12(12):CD014966. doi: 10.1002/14651858.CD014966.pub2. Cochrane Database Syst Rev. 2024. PMID: 39698949
References
-
- Bishop KD, Olszewski AJ. Epidemiology and survival outcomes of ocular and mucosal melanomas: a population-based analysis. Int J Cancer. 2014;134:2961–71. - PubMed
-
- Tomizuka T, Namikawa K, Higashi T. Characteristics of melanoma in Japan: a nationwide registry analysis 2011-2013. Melanoma Res. 2017;27:492–7. - PubMed
MeSH terms
Substances
LinkOut - more resources
Full Text Sources
Medical
