. 2025 Aug:98:102192.
doi: 10.1016/j.molmet.2025.102192. Epub 2025 Jun 21.

Metabolic consequences of altered kidney glucose reabsorption under normoglycemic conditions

Affiliations

Metabolic consequences of altered kidney glucose reabsorption under normoglycemic conditions

Majdoleen Ahmad et al. Mol Metab. 2025 Aug.

Abstract

Objective: Kidney glucose reabsorption, primarily mediated by glucose transporter 2 (GLUT2), is essential for systemic glucose homeostasis. While GLUT2's role has been studied in diabetic conditions, its function in kidney proximal tubule cells (KPTCs) under normo-physiological conditions remains unclear. This study aimed to delineate the metabolic consequences of KPTC-specific GLUT2 deletion on renal and whole-body energy homeostasis.

Methods: We utilized a conditional mouse model with KPTC-specific deletion of GLUT2 to assess the impact of impaired renal glucose reabsorption on systemic metabolism. Comprehensive metabolic and behavioral phenotyping, tissue-specific glucose uptake assays, and multi-omics analyses were performed to evaluate changes in energy balance, organ-specific metabolism, and signaling pathways.

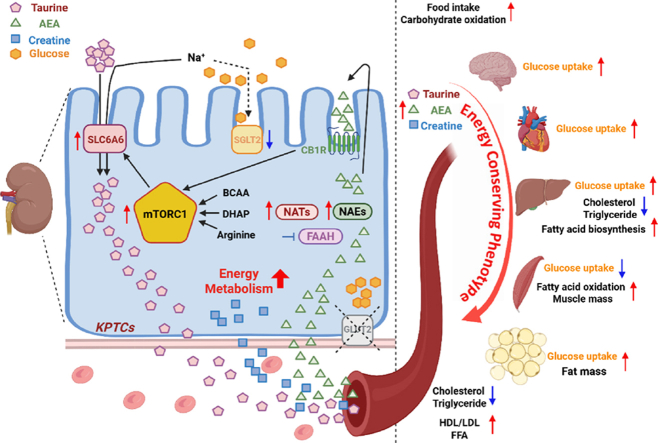
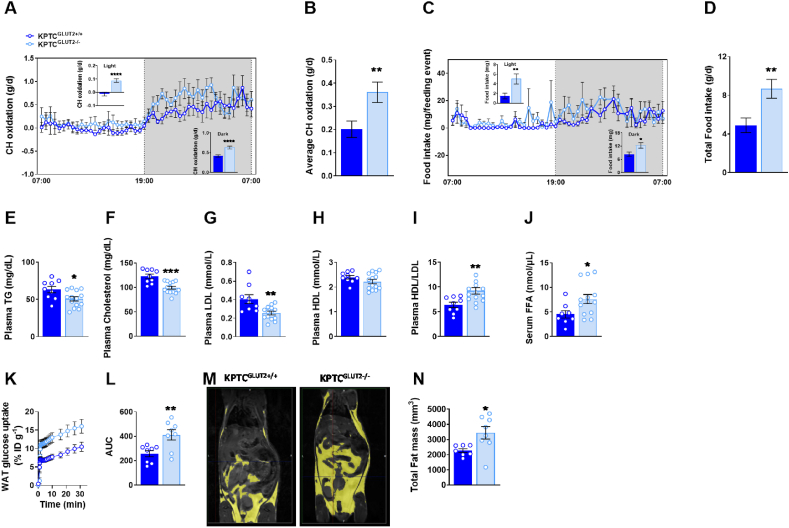
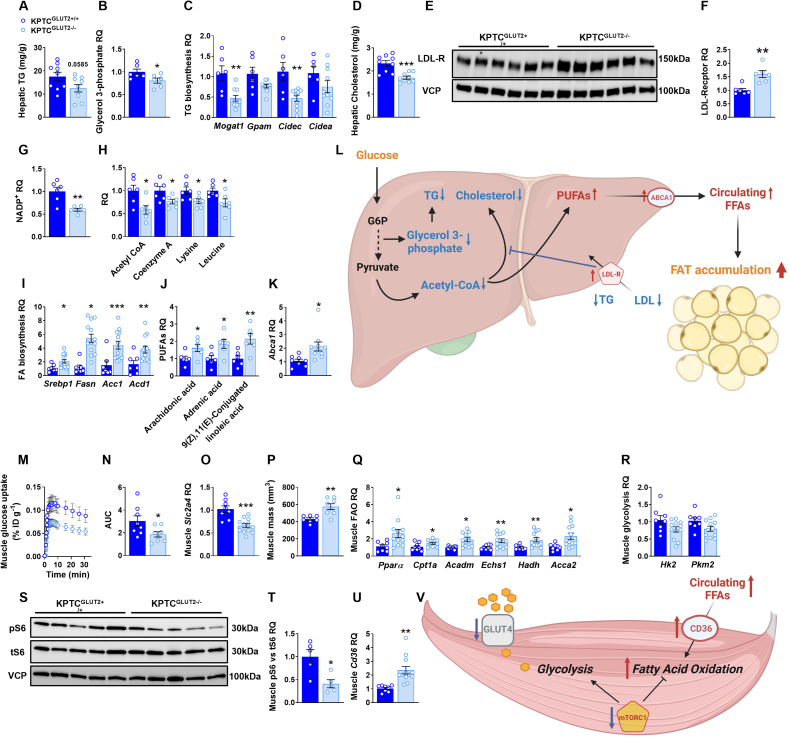
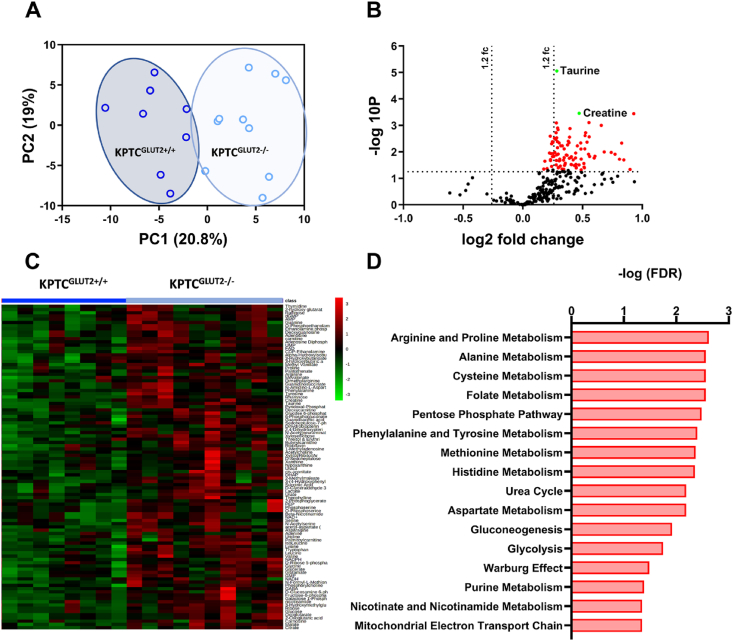
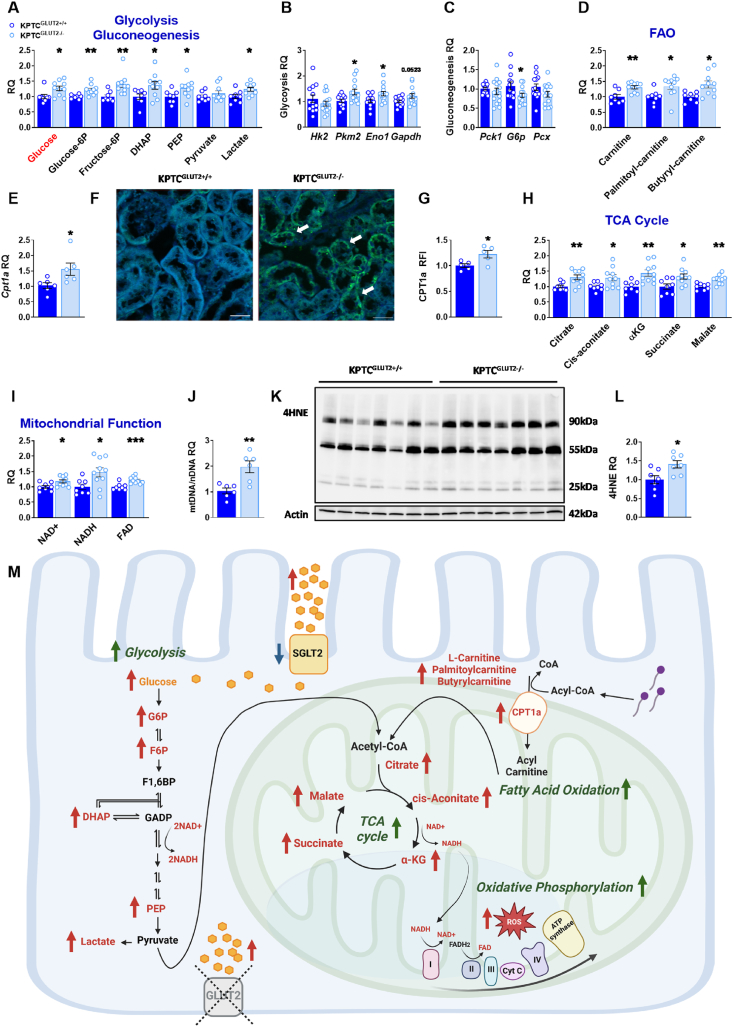
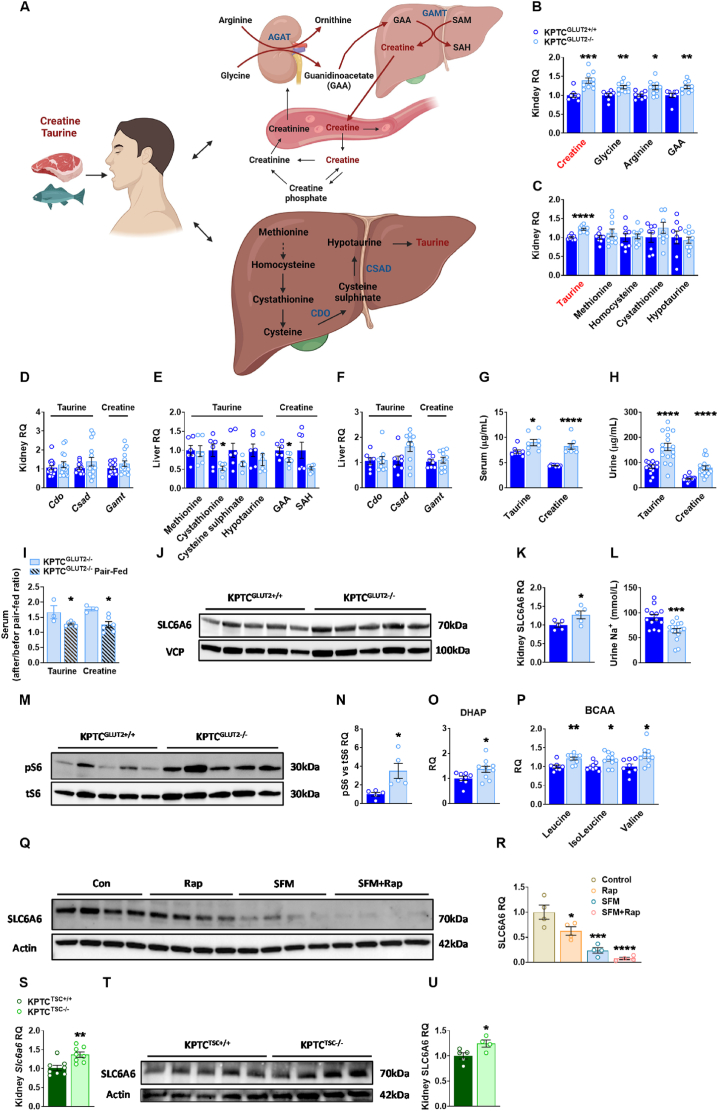
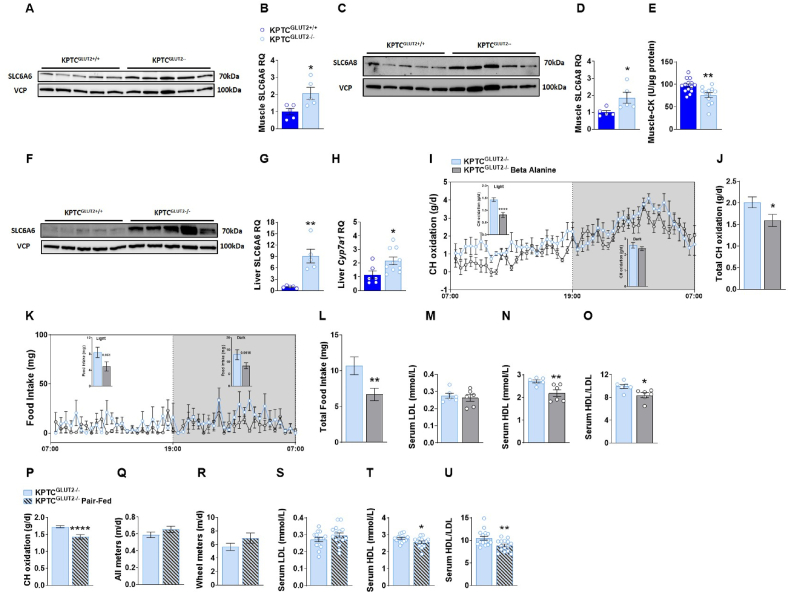
Results: Loss of KPTC-GLUT2 led to increased food intake, enhanced systemic carbohydrate oxidation, and elevated fat and muscle mass. These changes were accompanied by altered glucose utilization across metabolic organs and improvements in whole-body lipid profile. Mechanistically, the phenotype was linked to metabolic reprogramming in the kidney, characterized by increased reabsorption and bioavailability of taurine and creatine, overactivation of mTORC1 signaling, and elevated endocannabinoid tone.

Conclusions: KPTC-GLUT2 plays a previously unrecognized role in regulating renal and systemic energy metabolism. Its deletion induces a systemic energy-conserving phenotype driven by kidney-intrinsic changes, highlighting the kidney's contribution to whole-body metabolic homeostasis beyond glucose filtration.

Keywords: Creatine; Endocannabinoid system; Energy metabolism; GLUT2; KPTCs; Kidney glucose reabsorption; Taurine.


Conflict of interest statement

Declaration of competing interest All authors declare no conflicts of interest related to the work reported in this paper.

Figures

Image 1
Graphical abstract
Figure 1
Figure 1
KPTC-GLUT2 nullification results in systemic metabolic changes. 16-weeks-old KPTCGLUT2+/+ and KPTCGLUT2–/– male mice underwent metabolic assessment using metabolic cages. (A, B) A significant increase in carbohydrate oxidation (CHO, measured in g/day) in KPTCGLUT2–/– mice was detected, apparently due to (C, D) enhanced food intake in these mice. Lipid profile biochemical analysis revealed a significant reduction in (E) plasma TG, (F) cholesterol and (G) LDL levels, while (H) HDL levels were unchanged and (I) HDL/LDL ratio was elevated. Furthermore, (J) elevated serum FFA were noted. Glucose uptake assessed using PET-MRI, revealed a significant increase (K, L) in total fat glucose uptake in KPTCGLUT2–/– mice. MRI analysis revealed (M, N) increased total fat mass. For A-D; KPTCGLUT2+/+n = 6 mice and KPTCGLUT2–/–n = 7 mice. For E-I; KPTCGLUT2+/+n = 9 mice and KPTCGLUT2–/–n = 14 mice. For J; KPTCGLUT2+/+n = 8 mice and KPTCGLUT2–/–n = 13 mice. For K, L; n = 8 mice for each group. For N; KPTCGLUT2+/+n = 7 mice and KPTCGLUT2–/–n = 8 mice. Data represent the mean ± SEM and were analyzed by Student’s t-test. ∗P < 0.05, ∗∗P < 0.005, ∗∗∗P < 0.001, ∗∗∗∗P < 0.0001 relative to KPTCGLUT2+/+ mice. CH, carbohydrate; FFA, free fatty acids; AUC, area under the curve; BAT, brown adipose tissue. (For interpretation of the references to colour in this figure legend, the reader is referred to the Web version of this article.)
Figure 2
Figure 2
Liver and muscle metabolic adaptation in KPTCGLUT2–/– mice. Lipid profile biochemical analysis revealed (A) a slight reduction in liver TG and (B) a significant reduction in its liver precursor metabolite glycerol 3-phosphate using metabolomics analysis, as well as (C) reduced liver transcriptional expression of TG biosynthesis related genes. The profile biochemical analysis also revealed a significant reduction in (D) liver cholesterol levels as well as (E, F) significant elevated liver protein levels of LDL-R using WB and (G) reduced levels of NADP+ using metabolomics analysis, which negatively regulates HMG-CoA reductase activity were detected in the liver of KPTCGLUT2–/– mice. Metabolomics analysis revealed (H) a significant reduction in Acetyl-CoA, its ketogenic amino acids precursors and Coenzyme A, which are building blocks of FA biosynthesis. On the other hand, (I) a significant elevation in liver transcriptional expression of FAs biosynthesis related enzymatic genes, (J) as well as elevated PUFAs using metabolomics analysis, and (K) elevated transcriptional expression of FAs exporter; Abca1 in the liver of KPTCGLUT2–/– mice. (L) Illustration of the metabolic changes in hepatic cell of KPTCGLUT2–/– mice (black-unchanged metabolites, blue-decreased metabolites, red-increased metabolites). Figure created with BioRender.com. PET-MRI analysis revealed reduced (M, N) muscle glucose uptake along with decreased (O) muscle transcriptional expression of Slc2a4 (GLUT4), (P) elevated muscle mass recorded using MRI and increased transcriptional levels of (Q) FAO-related genes, but not (R) glycolytic genes. Additionally, (S, T) reduced phosphorylated S6 levels were found using WB as well as (U) elevated transcriptional levels of the FAs transporter CD36 in the muscle of KPTCGLUT2–/– mice. (V) Illustration of the metabolic changes in muscles of KPTCGLUT2–/– mice. Figure created with BioRender.com. For A, D; n = 9 mice for each group. For B, F, G, H, J; n = 6 mice for each group. For C; KPTCGLUT2+/+n = 6 mice and KPTCGLUT2–/–n = 10 mice. For I; KPTCGLUT2+/+n = 6 mice and KPTCGLUT2–/–n = 10 mice. For K; KPTCGLUT2+/+n = 6 mice and KPTCGLUT2–/–n = 10 mice. For M, N; n = 8 for each group. For O, Q, R, U; KPTCGLUT2+/+n = 8 mice and KPTCGLUT2–/–n = 12 mice. For P; KPTCGLUT2+/+n = 7 mice and KPTCGLUT2–/–n = 8 mice. For T; n = 5 mice for each group. Data represent the mean ± SEM and were analyzed by Student’s t-test. ∗P < 0.05, ∗∗P < 0.005, ∗∗∗P < 0.001 relative to KPTCGLUT2+/+ mice. AUC, area under the curve; FAO, fatty acid oxidation; PUFA, polyunsaturated fatty acid. (For interpretation of the references to colour in this figure legend, the reader is referred to the Web version of this article.)
Figure 3
Figure 3
KPTC-GLUT2 nullification results in a renal metabolomic storm. Kidney metabolomics profiling analysis was conducted by comparing the metabolites of KPTCGLUT2–/– mice (n = 10) with those of KPTCGLUT2+/+ counterparts (n = 8). (A) Principal component analysis revealed a distinct clustering of kidney metabolites between KPTCGLUT2+/+ and KPTCGLUT2–/– mice. (B) Volcano plot and (C) heatmap demonstrated a significant and robust elevation (p ≤ 0.05) in 100 of the 284 identified metabolites (35.2%) in KPTCGLUT2–/– mice compared to their wild-type littermates. (D) Pathway enrichment analysis revealed an upregulation of pathways involved in energy metabolism as well as amino and nucleic acid metabolism in KPTCGLUT2–/– mice. GraphPad prism 9.0 was used to perform the PCA and the volcano plot, using the log(Fold-change) data from KPTCGLUT2–/– in comparison to KPTCGLUT2+/+ mice. MetaboAnalyst 5.0 was used to generate the heatmap and to perform a metabolic enrichment analysis using the log transformed data, comparing WT and KO mice. Enrichment analysis was performed using the SMPDB metabolic pathway library, where only pathways identifying >6 metabolites are presented. FDR, false discovery rate.
Figure 4
Figure 4
Enhanced kidney energy metabolism in KPTCGLUT2–/– mice. Kidney metabolomics profiling analysis revealed an increase in metabolites involving (A) glycolysis along with elevated transcriptional levels of (B) glycolytic enzymes but not (C) gluconeogenic ones. Metabolomics profiling also revealed increased levels of (D) FAO related metabolites as well as elevated kidney (E) transcriptional and (F, G) protein levels of the FAO rate limiting enzyme CPT1a in KPTCGLUT2–/– mice compared to KPTCGLUT2+/+ mice, kidney sections (20 × magnification, scale bar: 50 μm). (H) Elevated levels of TCA related metabolites were also found using metabolomics profiling. Elevated mitochondrial function was assessed by the increase in (I) main co-enzymes involved in the electron transport chain, (J) mitochondrial to nuclear DNA ratio and (K, L) oxidative stress marker 4HNE, (M) indicating elevated kidney energy metabolism. Figure created with BioRender.com. For A, D, H, I; KPTCGLUT2+/+n = 8 mice and KPTCGLUT2–/–n = 10 mice. For B, C; KPTCGLUT2+/+n = 13 mice and KPTCGLUT2–/–n = 14 mice. For E, J; n = 6 mice for each group. For G; n = 5 mice for each group. For L; n = 7 mice for each group. Data represent the mean ± SEM and were analyzed by Student’s t-test. ∗P < 0.05, ∗∗P < 0.005, ∗∗∗P < 0.001 relative to KPTCGLUT2+/+ mice.
Figure 5
Figure 5
Kidney and systemic elevated levels of the metabolic hubs; taurine and creatine in KPTC-GLUT2−/− mice. (A) Schematic representation illustrating the primary sources of taurine and creatine. This figure was generated using BioRender.com. Kidney metabolomics analysis revealed (B) elevated levels of creatine, corresponding with increased levels of its precursor metabolites, and (C) elevated levels of taurine, without changes in its precursor metabolites, which are primarily synthesized in the liver. (D) Transcriptional levels of key enzymes involved in taurine and creatine biosynthesis in the kidney remained unchanged. Liver Metabolomics analysis revealed (E) either unchanged or slightly reduced levels of metabolites involved in taurine and creatine biosynthesis, alongside (F) stable transcriptional levels of key hepatic enzymes in KPTCGLUT2–/– mice. Systemically, LC-MS/MS analysis showed elevated taurine and creatine levels in (G) serum and (H) urine of KPTCGLUT2–/– mice. KPTCGLUT2–/– mice pair-fed for 7 days as their KPTCGLUT2+/+ littermates, demonstrated (I) a significant reduction in serum taurine and creatine levels in the ratio after and before pair-feeding. WB analysis on kidney lysates from KPTCGLUT2–/– mice revealed (J, K) elevated protein levels of taurine transporter, SLC6A6, accompanied with (L) reduced urinary Na + levels in KPTCGLUT2–/– mice. Moreover, WB analysis revealed (M, N) enhanced mTORC1 activation, represented by elevated phosphorylated S6 levels (pS6). This activation can be mediated by elevated levels of (O) DHAP and (P) branched-chain amino acids (BCAA) found in the metabolomics analysis. Human primary KPTCs were cultured in complete or serum free medium (SFM) with or without mTORC1 inhibitor, rapamycin (Rap; 100 nM), for 24 h, WB analysis on cell lysates revealed (Q, R) a significant reduction in SLC6A6 levels of the SFM and/or rapamycin treated cells. Kidney lysates form mice lacking the TSC specifically in KPTCs revealed elevated SLC6A6 transcriptional (S) and protein (T, U) levels. For B, C, G, O, P; KPTCGLUT2+/+n = 8 mice and KPTCGLUT2–/–n = 10 mice. For D; n = 15 for each group. For E; n = 6 for each group. For F; KPTCGLUT2+/+n = 7 mice and KPTCGLUT2–/–n = 10 mice. For H; n = 16 for each group. For I; KPTCGLUT2+/+n = 3 mice and KPTCGLUT2–/–n = 6 mice. For K, N; n = 5 mice for each group. For L; KPTCGLUT2+/+ n = 13 mice and KPTCGLUT2–/–n = 16 mice. For R; n = 4 for each group. For S; n = 8 mice for each group. For U; KPTCTSC+/+ n = 5 mice and KPTCTSC−/−n = 4 mice. Data represent the mean ± SEM and were analyzed by Student’s t-test, R was analyzed by one-way ANOVA followed by Tukey’s multiple comparison test. ∗P < 0.05, ∗∗P < 0.005, ∗∗∗P < 0.001, ∗∗∗∗P < 0.0001 relative to KPTCGLUT2+/+ or KPTCTSC+/+ mice. DHAP, dihydroxyacetone phosphate; BCAA, branched-chain amino acids; SFM, serum free medium; Rap, rapamycin; TSC, tuberous sclerosis complex.
Figure 6
Figure 6
Taurine and creatine mediates systemic changes in KPTCGLUT2–/– mice. (A, B) Elevated muscle protein levels of taurine transporter, SLC6A6, and (C, D) creatine transporter, SLC6A8, were found using WB in muscle lysates of KPTCGLUT2–/– mice. Additionally, (E) reduced muscle CK activity was found using biochemical analysis. Elevated (F, G) liver protein levels of taurine transporter, SLC6A6, were found using WB and (H) enhanced liver transcriptional expression of bile acid synthesis rate-limiting enzyme Cyp7a1. To inhibit SLC6A6, 16-week-old male KPTCGLUT2–/– mice were treated with 3% β-Alanine in their drinking water for 7 days, resulting in (I, J) reduced CHO and (K, L) food intake compared to baseline levels. (M) β-Alanine did not change LDL levels; however, it reduced (N) HDL and (O) HDL/LDL ratio. Food consumption was restricted in 16-week-old male KPTCGLUT2–/– mice to match that of their WT littermates for a period of 7 days. This pair-feeding regime resulted in (P) CHO reduction compared to baseline levels, (Q, R) with no alterations in activity profile. Moreover, (S) pair-feeding did not change LDL levels, but reduced (N) HDL and (U) HDL/LDL ratio. For B, D, G; n = 5 mice for each group. For E; KPTCGLUT2+/+n = 14 mice and KPTCGLUT2–/–n = 12 mice. For H; KPTCGLUT2+/+n = 6 mice and KPTCGLUT2–/–n = 10 mice. For I–O; n = 6 mice for each group. For P-Q; n = 3 mice for each group. For S–U; n = 15 mice for each group. Data represent the mean ± SEM and were analyzed by Student’s t-test. ∗P < 0.05, ∗∗P < 0.005, ∗∗∗∗P < 0.0001 relative to KPTCGLUT2+/+ mice.

Similar articles

References

    1. Ala M. SGLT2 inhibition for cardiovascular diseases, chronic kidney disease, and NAFLD. Endocrinology. 2021;162 doi: 10.1210/endocr/bqab157. - DOI - PubMed
    1. Vallon V., Verma S. Effects of SGLT2 inhibitors on kidney and cardiovascular function. Annu Rev Physiol. 2021;83:503–528. doi: 10.1146/annurev-physiol-031620-095920. - DOI - PMC - PubMed
    1. Mordi I.R., Lang C.C. Glucose-lowering and metabolic effects of SGLT2 inhibitors. Heart Fail Clin. 2022;18:529–538. doi: 10.1016/j.hfc.2022.03.004. - DOI - PubMed
    1. Androutsakos T., Nasiri-Ansari N., Bakasis A.D., Kyrou I., Efstathopoulos E., Randeva H.S., et al. SGLT-2 inhibitors in NAFLD: expanding their role beyond diabetes and cardioprotection. Int J Mol Sci. 2022;23 doi: 10.3390/ijms23063107. - DOI - PMC - PubMed
    1. Baraghithy S., Soae Y., Assaf D., Hinden L., Udi S., Drori A., et al. Renal proximal tubule cell Cannabinoid-1 receptor regulates bone remodeling and mass via a kidney-to-bone axis. Cells. 2021;10 doi: 10.3390/cells10020414. - DOI - PMC - PubMed

LinkOut - more resources