. 2025 Jun 23;13(6):e011088.
doi: 10.1136/jitc-2024-011088.

Serotonin receptor 5-HT2A as a potential target for HCC immunotherapy

Affiliations

Serotonin receptor 5-HT2A as a potential target for HCC immunotherapy

Rong En Tay et al. J Immunother Cancer. .

Abstract

Background: While recent clinical trials of combination immunotherapies for hepatocellular carcinoma (HCC) have shown promising clinical efficacy and survival improvements breakthroughs, there is still much room for further improvement. A key limiting factor for HCC immunotherapy is the intrinsic immunosuppression within the liver microenvironment, resulting in suboptimal priming of tumor-specific CD8 cytotoxic T cells and thus immune evasion by the tumor. Hence, identifying new key molecular pathways suppressing T-cell responses within the liver is critical for the rational design of more effective combination immunotherapies for HCC.

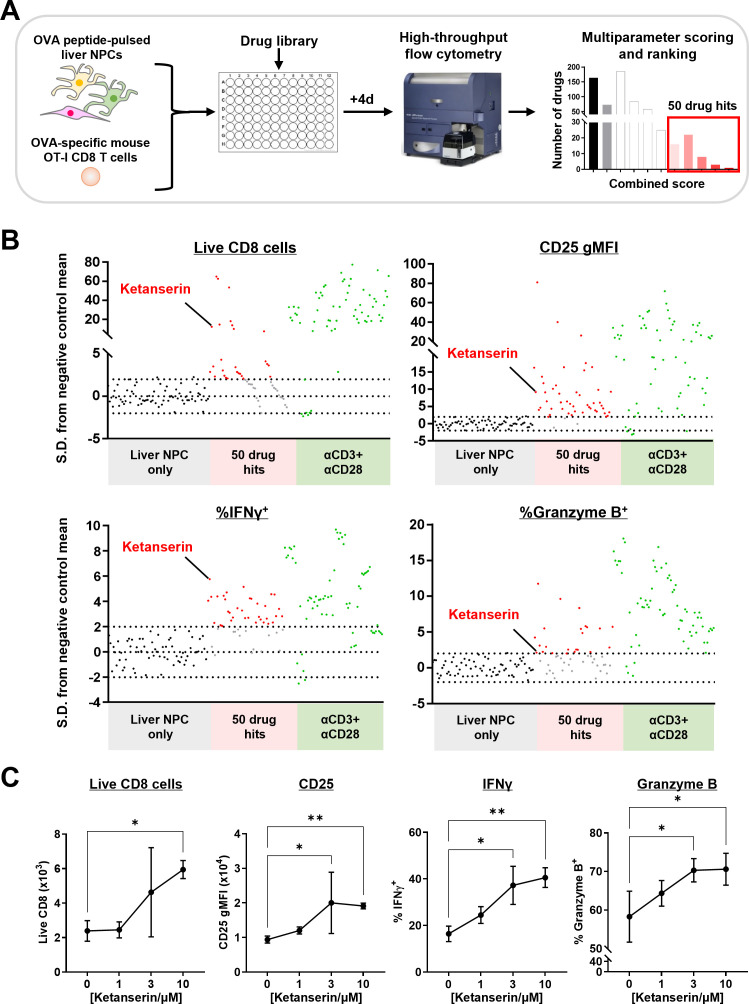
Methods: We identified the 5-HT2A serotonin receptor as a potential target for HCC immunotherapy in a chemical screening approach and validated that targeting 5-HT2A signaling could be a viable approach for HCC immunotherapy via in vitro and in vivo studies.

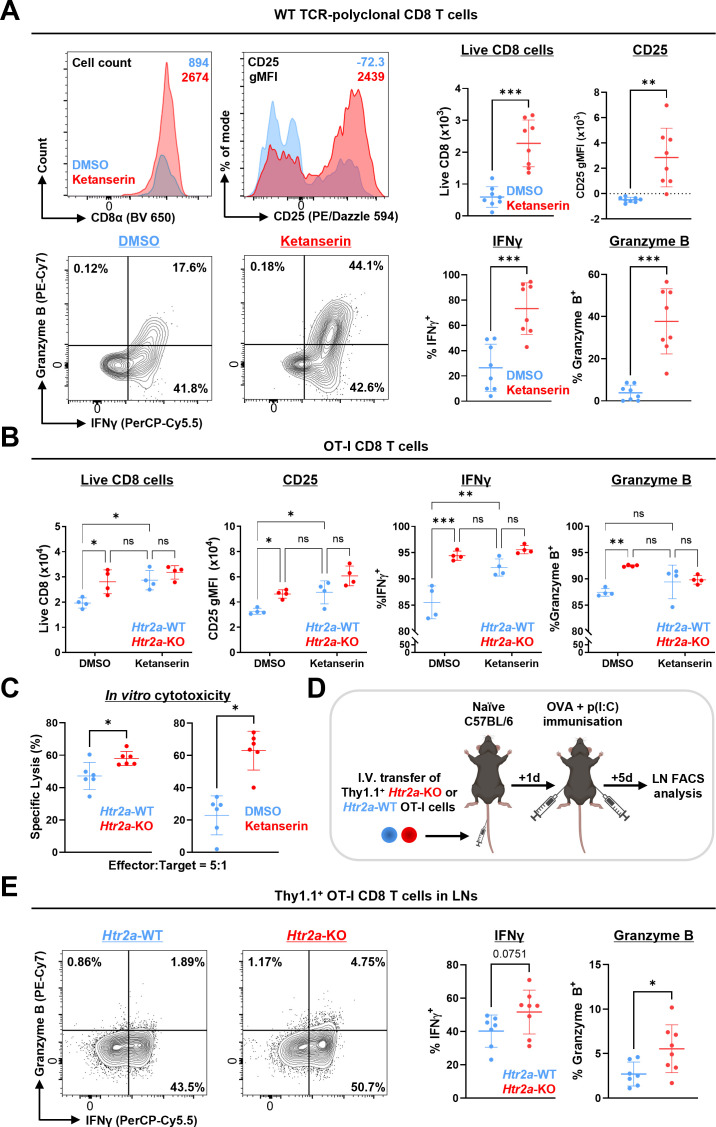
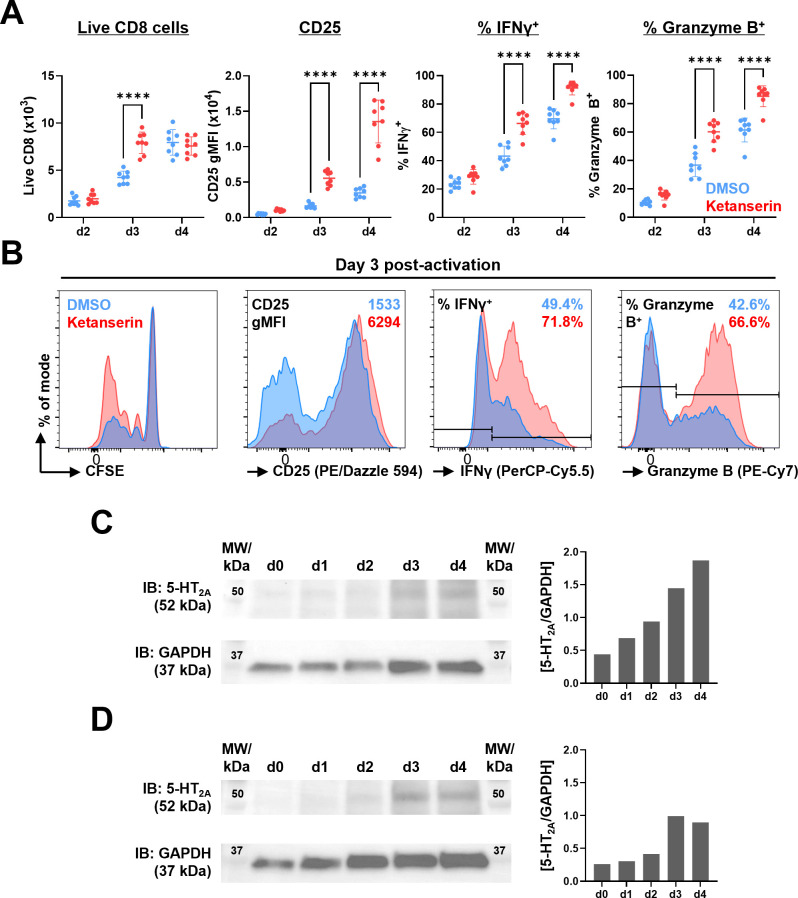
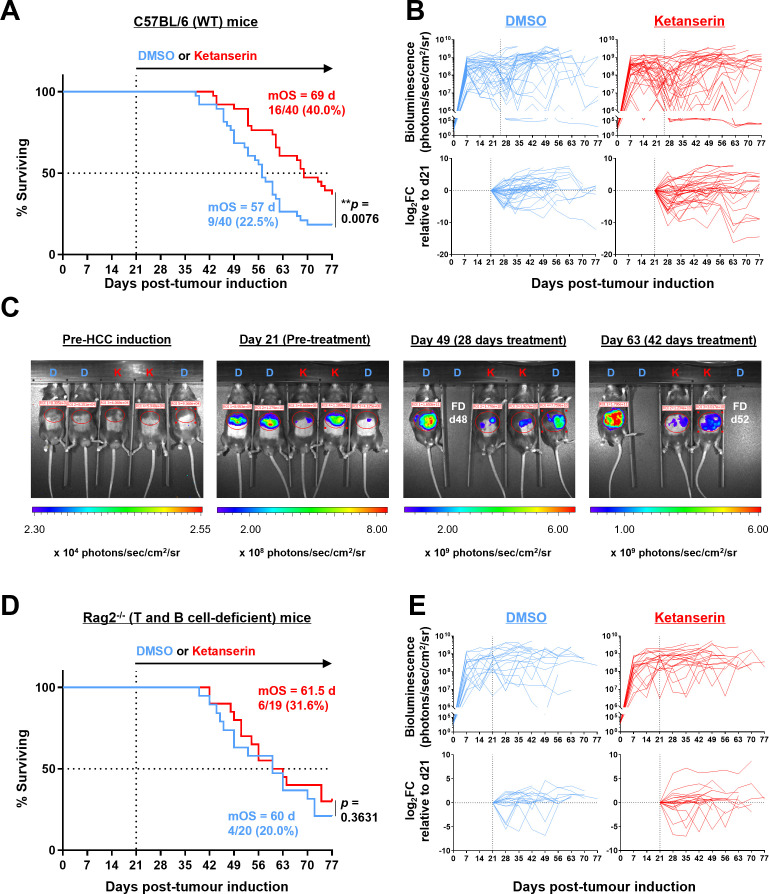
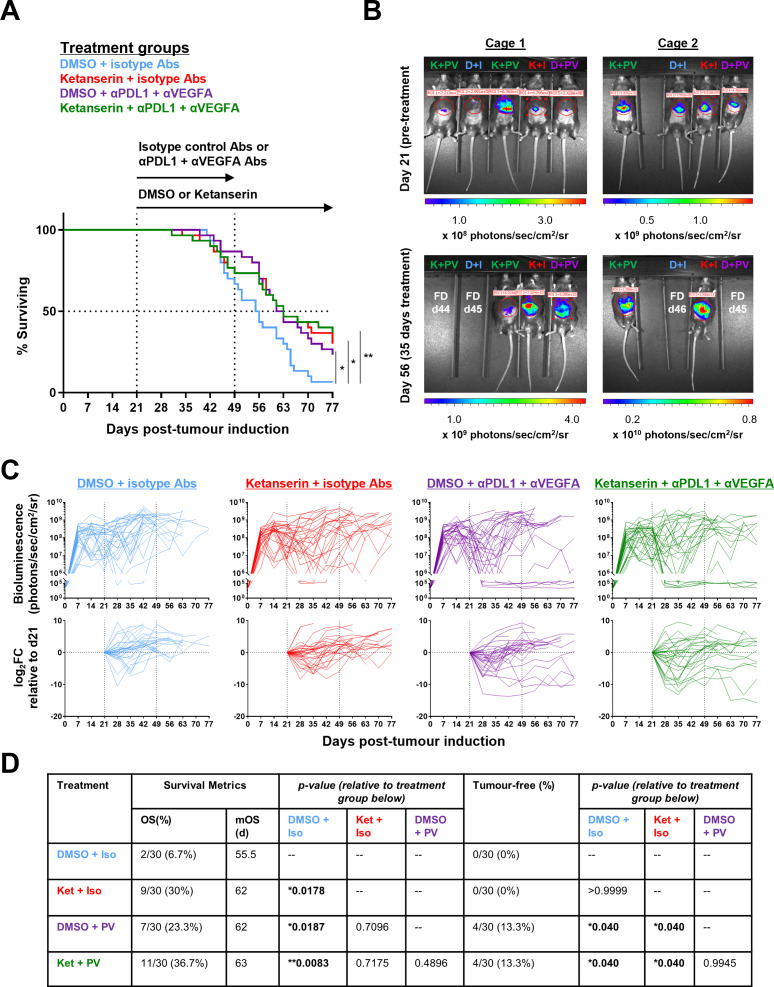
Results: Disruption of 5-HT2A signaling using either a selective antagonist small molecule, ketanserin, or by knockout of its coding gene Htr2a augments the cytotoxic effector phenotype of mouse CD8 T cells activated in vitro with immunosuppressive liver non-parenchymal cells. Ketanserin treatment of in vitro activated human CD8 T cells also increased expression of the cytotoxic effector molecules granzyme B and perforin. Abrogation of 5-HT2A signaling was associated with increased expression of cytotoxicity-related genes such as granzyme B and reduced expression of transcription factors downstream of MAP kinase signaling. In vivo, systemic ketanserin treatment significantly prolonged survival of HCC tumor-bearing mice and was non-inferior to α-programmed death ligand 1 (PD-L1)+α-vascular endothelial growth factor A (VEGFA) combination antibody treatment. Combining ketanserin with αPD-L1+αVEGFA antibodies also significantly prolonged survival relative to control-treated mice while preserving the occurrence of complete tumor regression observed with αPD-L1+αVEGFA treatment alone.

Conclusions: Together, our data describe a role for 5-HT2A as a negative regulator of the cytotoxic effector phenotype in CD8 T cells and highlight the therapeutic potential of targeting 5-HT2A for HCC immunotherapy.

Keywords: Combination therapy; Hepatocellular Carcinoma; Immunotherapy; T cell.


Conflict of interest statement

Competing interests: None declared

Figures

Figure 1
Figure 1. 5-HT2A-selective antagonist ketanserin augments the effector phenotype of CD8 T cells activated by liver non-parenchymal cells. (A) Schematic of in vitro drug library screening workflow. Primary liver non-parenchymal cells (NPCs) were isolated from healthy male C57BL/6 mice, pulsed with OVA SIINFEKL peptide, and co-cultured with SIINFEKL-specific OT-I CD8 T cells in the presence of drugs from a library of 640 small molecules. After 4 days of in vitro activation, the phenotype of activated OT-I CD8 T cells was evaluated by high-throughput flow cytometry, and the strength of the positive changes to their phenotypes was ranked by a multiparameter score. See Methods for details and online supplemental table S1 for the full list of drug hits. (B) Perturbation of indicated parameters of CD8 T cell phenotype by the top 50 drug hits of the screen (red symbols) relative to CD8 T cells activated by liver NPCs only without drugs (negative controls, black symbols) and CD8 T cells strongly activated using αCD3ε+αCD28 antibodies (positive controls, green symbols). (C) Flow cytometric quantification of indicated CD8 T-cell activation markers in OT-I T cells following 4-day in vitro activation with SIINFEKL-pulsed mouse liver NPCs in the presence of increasing concentrations of ketanserin. Data are representative of two independent experiments with four replicates per condition. Means±SD are indicated. Statistical analysis was run using a Kruskal-Wallis test with Dunn’s multiple comparisons test. *p<0.05, **p<0.01. gMFI, geometric mean fluorescence intensity; IFN, interferon; OVA, ovalbumin.
Figure 2
Figure 2. Disrupting 5-HT2A signaling in CD8 T cells during activation augments their cytotoxic effector function in a T cell-intrinsic manner. (A) Representative flow cytometry plots (left) and quantification (right) of expression of CD8 T cell activation markers in WT TCR-polyclonal CD8 T cells following 4-day in vitro activation with αCD3ε+αCD28 antibodies in the presence of 5 µM ketanserin or 0.1% DMSO vehicle control. Gated on live TCR-β+ CD8α+ events. Data are pooled from two independent experiments, each with four technical replicates per condition. Means±SD are indicated. (B) Flow cytometry measurements of indicated parameters of CD8 T-cell effector phenotype in Htr2a-KO and Htr2a-WT OVA-specific OT-I CD8 T cells. Cas9+ OT-I CD8 T cells were transduced with gRNA sequences targeting either Htr2a (Htr2a-KO, red) or LacZ (Htr2a-WT, blue), and activated in vitro with SIINFEKL-loaded mouse liver NPCs for 4 days in the presence of 5 µM ketanserin or 0.1% DMSO vehicle control. Data are representative of two independent experiments with four technical replicates per condition. Means±SD are indicated. (C) In vitro cytotoxicity of Htr2a-KO or Htr2a-WT (left) and ketanserin-treated or DMSO control-treated (right) OT-I T effector cells against OVA+ Hepa1-6 target cells. Data are from one experiment each with six technical replicates per condition. Means±SD are indicated. (D and E) In vivo activation of Htr2a-KO CD8 T cells by immunization with cognate antigen. 3×10⁵ Htr2a-KO or Htr2a-WT OT-I T cells were transferred into naïve recipient C57BL/6 mice. Mice were then immunized subcutaneously in both flanks with OVA+poly(I:C) in phosphate-buffered saline a day later. 5 days later, inguinal LNs draining the immunization site were harvested, and cell suspensions were prepared for flow cytometry. (D) Schematic of in vivo activation experiment workflow. (E) Representative flow cytometry plots (left) and quantification (right) of granzyme B and IFN-γ expression in adoptively transferred Thy1.1+ OT-I cells within inguinal LNs 5 days after immunization. Gated on live TCR-β+ CD8α+ CD4 Thy1.1+ events. Data are representative of one experiment with at least seven recipient mice per treatment group. Means±SD are indicated. Statistical analysis was performed using Welch’s t-test (A, C, E) or two-way analysis of variance with Tukey’s test for multiple comparisons (B). *p<0.05, **p<0.01, ***p<0.001. DMSO, dimethyl sulfoxide; FACS, fluorescence-activated cell sorting; gMFI, geometric mean fluorescence intensity; IFN, interferon; LNs, lymph nodes; OVA, ovalbumin; TCR, T cell receptor; WT, wildtype.
Figure 3
Figure 3. Kinetics of acquisition of augmented cytotoxic effector phenotype of CD8 T cells with 5-HT2A inhibition during activation. (A) Flow cytometry analysis of expression of indicated markers on mouse TCR-polyclonal CD8 T cells at different time points during in vitro activation. CD8 T cells were activated for 4 days in vitro with αCD3ε+αCD28 antibodies in the presence of 5 µM ketanserin or 0.1% DMSO vehicle control. Gated on live TCR-β+ CD8α+ events. Data are representative of two independent experiments with eight technical replicates per condition. Means±SD are indicated. Statistical analysis was performed using two-way analysis of variance with Šídák’s test for multiple comparisons. ****p<0.0001. (B) Representative flow cytometry plots of day 3 samples from (A). (C and D) Western blot analysis of 5-HT2A expression on mouse (C) and human (D) total polyclonal CD8 T cells at indicated timepoints during in vitro activation. CD8 T cells were activated for 4 days in vitro with 3 µg/mL plate-bound αCD3ε+1 µg/mL soluble αCD28 antibodies in 24-well tissue culture plates, and total cell pellets were collected at the indicated time points. Whole cell lysates equivalent to 5×10⁵ cells were loaded in each lane for separation by SDS-PAGE, then transferred to PVDF membranes for western blotting to detect indicated proteins. Molecular weights (kDa) of protein standard ladders are indicated on immunoblot images. 5-HT2A band densities normalized to band densities of GADPH loading control for each day are indicated on the right. Data are representative of two independent experiments. CFSE, carboxyfluorescein succinimidyl ester; DMSO, dimethyl sulfoxide; gMFI, geometric mean fluorescence intensity; IFN, interferon; PVDF, polyvinylidene fluoride; SDS-PAGE, sodium dodecyl sulfate-polyacrylamide gel electrophoresis; TCR, T-cell receptor.
Figure 4
Figure 4. Analysis of transcriptional changes resulting from disruption of 5-HT2A signaling in CD8 T cells activated by liver NPCs. (A) Schematic of experimental workflow. Cas9+ OT-I CD8 T cells were harvested in three biological replicate groups from separate mice, with each biological replicate group then split into the four different treatment conditions of the experiment. Cas9+ OT-I T cells were first transduced with guide RNA sequences targeting either Htr2a (Htr2a-KO, red) or LacZ (Htr2a-WT, blue), then activated in vitro with SIINFEKL-loaded mouse liver NPCs in the presence of 5 µM ketanserin or 0.1% DMSO vehicle control. After 4 days, live Thy1.1+ CD8α+ cells from all 12 samples were sorted from the co-cultures and processed for total RNA-seq in parallel. See Methods for details. (B) Principal component analysis of RNA-sequencing data across all four treatment groups. (C) Set analysis of differentially expressed genes (DEGs) between each experimental condition with perturbation of 5-HT2A versus control cells (Htr2a-WT+DMSO). See online supplemental table S2 for the full list of DEGs. (D) Volcano plot of DEGs common to all experimental conditions with perturbation of 5-HT2A signaling. Data shown are from the DEGs in the comparison of Htr2a-KO+ketanserin cells with Htr2a-WT+DMSO cells. (E) Top four pathways identified in ingenuity pathway analysis of DEGs shown in (D). cAMP, cyclic AMP; DMSO, dimethyl sulfoxide; FAK, focal adhesion kinase; GPCR, G-protein coupled receptor; NPC, non-parenchymal cell; OVA, ovalbumin; RNA-seq, RNA sequencing.
Figure 5
Figure 5. Ketanserin treatment boosts granzyme B and perforin expression of activated human CD8 T cells. (A and B) CyTOF analysis of total human PBMCs activated in vitro in the presence of ketanserin or a DMSO control. Total PBMCs were isolated from healthy donor blood and activated in vitro with 5 µg/mL plate-bound αCD3 antibodies+1 µg/mL soluble αCD28 antibodies in the presence of 5 µM ketanserin or 0.1% DMSO vehicle control. After 4 days, total cells were collected and stained with a panel of 35 metal-conjugated antibodies for CyTOF data acquisition and analysis. (A) UMAP plot of CyTOF data of total PBMCs (both ketanserin-treated and DMSO-treated cells, in equal numbers), with clusters of indicated immune cell lineages. Heat maps of lineage marker expression are shown in online supplemental figure S3. (B) Analysis of granzyme B expression in ketanserin-treated and DMSO-treated samples. (Left and center) Heat maps of granzyme B expression levels across all PBMC populations from DMSO-treated and ketanserin-treated samples, respectively. (Right) Quantification of granzyme B expression in CD8 T cells, CD4 T cells, and NK cells. Numbers indicate the (ketanserin/DMSO) ratio of the geometric means of granzyme B signal intensities. (C and D) Flow cytometry analysis of granzyme B and perforin expression in activated human CD8 T cells from a panel of 10 healthy donors. CD8 T cells were magnetically isolated from total donor PBMCs, then activated in vitro with plate-bound αCD3 antibodies+soluble αCD28 antibodies in the presence of 5 µM ketanserin or 0.1% DMSO vehicle control. (C) Representative flow cytometry plots of activated CD8 T cells treated as indicated. Gated on live CD3+ CD8α+ events. (D) Pairwise analysis of granzyme B and perforin expression levels across all 10 donors. Each pair of data points shows the mean values for % granzyme B+ and % perforin+ CD8 T cells treated as indicated. Data are from at least one experiment per donor with at least four technical replicates per experiment. Statistical analysis was performed using the ratio-paired t-test. *p<0.05. CyToF, cytometry by time-of-flight; DC, dendritic cell; DMSO, dimethyl sulfoxide; NK, natural killer; PBMC, peripheral blood mononuclear cell; UMAP, Uniform Manifold Approximation and Projection.
Figure 6
Figure 6. Ketanserin prolongs survival in mice with HCC. (A–C) WT C57BL/6 were hydrodynamically injected with plasmids bearing oncogene sequences to spontaneously induce luciferase-expressing liver tumors on day 0 (see Methods). Mice received 10 mg/kg of ketanserin tartrate or an equivalent amount of DMSO control every 3–4 days starting on day 21 post-tumor induction. (A) Kaplan-Meier plots of survival of mice that received indicated treatments. (B) HCC tumor bioluminescence (BLI) readings (top) and log2 (fold change) of tumor burden relative to pretreatment levels (bottom). (C) Representative BLI images from one cage of five mice treated with DMSO or ketanserin. D – DMSO treated, K – Ketanserin treated, FD – Found dead on indicated day of experiment. (D and E) Rag2−/− mice were induced with luciferase-expressing HCC tumors and treated as in (A). (D) Kaplan-Meier plots of survival of mice that received indicated treatments. (E) HCC tumor BLI readings (top) and log2 (fold change) of tumor burden relative to pretreatment levels (bottom). Statistical analysis was performed using the log-rank Mantel-Cox test. **p<0.01. Numerical p values are reported in figure panels. DMSO, dimethyl sulfoxide; HCC, hepatocellular carcinoma; mOS, median overall survival; WT, wildtype.
Figure 7
Figure 7. Ketanserin treatment confers a survival benefit similar to that of combination αPD-L1+αVEGFA antibody treatment in mice with HCC. C57BL/6 mice were hydrodynamically injected with plasmids bearing oncogene sequences to spontaneously induce luciferase-expressing liver tumors on day 0 (see Methods). On day 21 post-tumor induction, mice were randomly assigned into four treatment groups as indicated. Mice received either 10 mg/kg ketanserin or 5% DMSO vehicle control two times a week until death or the end of the experiment, plus either 100 µg αPD-L1+200 µg αVEGFA antibodies or an equivalent mass of isotype control antibodies from day 21 to day 49 of the experiment. (A) Kaplan-Meier plots of survival of mice that received indicated treatment combinations. (B) Representative BLI images of two cages of mice treated as indicated (one from each independent experiment). D+I – DMSO+isotype antibodies treated, K+I – Ketanserin+isotype antibodies treated, D+PV – DMSO + αPD-L1+αVEGFA antibodies treated, K+PV – Ketanserin + αPD-L1+αVEGFA antibodies treated. FD – Found dead on indicated day of experiment. (C) HCC tumor BLI readings (top) and log2 (fold change) of tumor burden relative to pretreatment levels (bottom) in mice receiving indicated treatment combinations. (D) Summary of numerical data and statistical analysis. Data are pooled from two independent experiments with 15 mice in each treatment group. Statistical analysis was performed using the log-rank Mantel-Cox test. *p<0.05, **p<0.01. Numerical p values are reported in figure panels. BLI, bioluminescence; DMSO, dimethyl sulfoxide; HCC, hepatocellular carcinoma; mOS, median OS; OS, overall survival; PD-L1, programmed cell death ligand 1; VEGF, vascular endothelial growth factor A.

Similar articles

References

    1. Sangro B, Sarobe P, Hervás-Stubbs S, et al. Advances in immunotherapy for hepatocellular carcinoma. Nat Rev Gastroenterol Hepatol. 2021;18:525–43. doi: 10.1038/s41575-021-00438-0. - DOI - PMC - PubMed
    1. Roderburg C, Özdirik B, Wree A, et al. Systemic treatment of hepatocellular carcinoma: from sorafenib to combination therapies. Hepat Oncol. 2020;7:HEP20. doi: 10.2217/hep-2020-0004. - DOI - PMC - PubMed
    1. Finn RS, Qin S, Ikeda M, et al. Atezolizumab plus Bevacizumab in Unresectable Hepatocellular Carcinoma. N Engl J Med. 2020;382:1894–905. doi: 10.1056/NEJMoa1915745. - DOI - PubMed
    1. Cheng A-L, Qin S, Ikeda M, et al. Updated efficacy and safety data from IMbrave150: Atezolizumab plus bevacizumab vs. sorafenib for unresectable hepatocellular carcinoma. J Hepatol. 2022;76:862–73. doi: 10.1016/j.jhep.2021.11.030. - DOI - PubMed
    1. Abou-Alfa GK, Lau G, Kudo M, et al. Tremelimumab plus Durvalumab in Unresectable Hepatocellular Carcinoma. NEJM Evid . 2022;1:EVIDoa2100070. doi: 10.1056/EVIDoa2100070. - DOI - PubMed

MeSH terms

Substances