. 2025 Jun 23;13(1):66.
doi: 10.1038/s41413-025-00427-y.

ER-induced PERK/TFEB cascade sequentially modulates mitochondrial dynamics during cranial suture expansion

Affiliations

ER-induced PERK/TFEB cascade sequentially modulates mitochondrial dynamics during cranial suture expansion

Jingyi Cai et al. Bone Res. .

Abstract

The effectiveness of cranial suture expansion therapy hinges on the timely and adequate regeneration of bone tissue in response to mechanical stimuli. To optimize clinical outcomes and prevent post-expansion relapse, we delved into the underlying mechanisms governing bone remodeling during the processes of suture expansion and relapse. Our findings revealed that in vitro stretching bolstered mesenchymal stem cells' antioxidative and osteogenic capacity by orchestrating mitochondrial activities, which governed by force-induced endoplasmic reticulum (ER) stress. Nonetheless, this signal transduction occurred through the activation of protein kinase R-like ER kinase (PERK) at the ER-mitochondria interface, rather than ER-mitochondria calcium flow as previously reported. Subsequently, PERK activation triggered TFEB translocation to the nucleus, thus regulating mitochondrial dynamics transcriptionally. Assessment of the mitochondrial pool during expansion and relapse unveiled a sequential, two-phase regulation governed by the ER stress/p-PERK/TFEB signaling cascade. Initially, PERK activation facilitated TFEB nuclear localization, stimulating mitochondrial biogenesis through PGC1-α, thereby addressing energy demands during the initial phase. Subsequently, TFEB shifted focus towards ensuring adequate mitophagy for mitochondrial quality maintenance during the remodeling process. Premature withdrawal of expanding force disrupted this sequential regulation, leading to compromised mitophagy and the accumulation of dysfunctional mitochondria, culminating in suboptimal bone regeneration and relapse. Notably, pharmacological activation of mitophagy effectively mitigated relapse and attenuated bone loss, while its inhibition impeded anticipated bone growth in remodeling progress. Conclusively, we elucidated the ER stress/p-PERK/TFEB signaling orchestrated sequential mitochondria biogenesis and mitophagy under mechanical stretch, thus ensuring antioxidative capacity and osteogenic potential of cranial suture tissues.


Conflict of interest statement

Competing interests: The authors declare no competing interests.

Figures
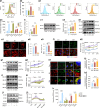
Fig. 1
Fig. 1
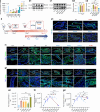
Alteration in ROS and mitochondrial dynamics in response to mechanical stretch. a1, a2 Flow cytometry analysis of cellular ROS levels at different stretching points. n = 3/group. a3, a4 ROS level changes after introducing H2O2 (final concentration 5 µmol/ml) immediately after stretch for 10 min. n = 3/group. b SOD activity changes after stretching. n = 3/group. c Western blot results of SOD2 at different stretch points. n = 4/group. d Western blot results of TOMM20, COX IV and VDAC1. Curves indicate comparisons with the control group. n = 3/group. e Live cell imaging and comparison results of Mitotracker staining. n = 6/group. f Immunofluorescence staining of FIS1. n = 9/group. g Western blot results of DRP1 and FIS1. Curves indicate comparisons with the control group. n = 3/group. h Co-localization analysis of mitochondria and lysosome (red for Mitotracker, green for Lysotracker) by live cell staining. n = 6/group. i Western blot results of PINK1 and Parkin. Curves indicate comparisons with the control group. n = 3/group. j Western blot results of Parkin and SOD2 after Mdivi application. Curves indicate comparisons with the control group. n = 3/group. k Comparison of antioxidative capacity after introducing Mdivi-1 for 24-h stretch via flow cytometry analysis of cellular ROS levels with added H2O2. n = 3/group. Data are presented as mean ± standard deviation (SD). ns > 0.05, *P < 0.05, **P < 0.01, ***P < 0.001, ****P < 0.000 1. Scale bar: 10 µm (low magnification), 2 µm (high magnification)
Fig. 2
Fig. 2
ER stress as an upstream regulator of mitophagy in response to mechanical stretch. a TEM images showing mitochondrial and ER changes after 24-h stretch. Blue triangles/squares: mitochondria/ER in control, red triangles/squares: mitophagy/flattened ER in stretch group. n = 6/group. b Co-localization of ERtracker (green) and Mitotracker (red). n = 6/group. c Flow cytometry analysis of ROS level after 4-PBA application. n = 3/group. d Mitochondrial morphology analysis in live cells. Scale bar: 10 µm (low magnification), 2 µm (high magnification). n = 6/group. e Western blot of SOD2, TOMM20, FIS1, Parkin, PINK1 expression after 4-PBA treatment. Curves indicate comparisons with the control group. n = 3/group. f Co-localization of LAMP1 and TOMM20 by immunofluorescence. Scale bar: 10 µm (low magnification), 2 µm (high magnification). Data presented as mean ± SD. ns > 0.05, *P < 0.05, **P < 0.01, ***P < 0.001
Fig. 3
Fig. 3
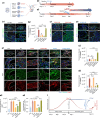
PERK phosphorylation mediated endoplasmic ER-mitochondrial communication and mitophagy in response to mechanical stretch. a1 Live cell staining of mitochondrial calcium (red) and ER calcium (green). Scale bar: 100 µm. a2 Comparison of fluorescence intensity of mitochondrial calcium (red) and ER calcium (green). Blue symbols indicate increased ER calcium in Stre + 2-APB vs. Stre group. n = 3/group. Western blot of SOD2, FIS1, and Parkin (b), PERK phosphorylation level and SOD2 (c), PINK1, Parkin, FIS1, and PGC-1α expression (d). Curves above indicate comparisons with the control group. n = 3/group. e Mitochondrial morphology in live cells for control and treatment groups. Scale bar: 10 µm (low magnification), 2 µm (high magnification). n = 6/group. f Western blot of LC3-II and LAMP1 expression. Curves above indicate comparisons with the control group. n = 3/group. g Co-localization of TOMM20 and LAMP1 with GSK treatment. Scale bar: 10 µm (low), 2 µm (high). n = 6/group. Data presented as mean ± SD. ns > 0.05, *P < 0.05, **P < 0.01, ***P < 0.001
Fig. 4
Fig. 4
Coordinated changes in antioxidative capacity, osteogenic activity, and mitochondria during suture expansion and relapse. a Comparison of antioxidative capacity in in control (Con), 24-h stretch (S24), 24-h stretch with another 12-h halt (S24-H12) or 24-h halt (S24-H24), and 48-h stretch (S48) groups via flow cytometry analysis of cellular ROS levels confronting extra H2O2. n = 3/group. b, c RUNX2 expression analysis. n = 3/group. d Diagram of the suture expansion-relapse model. After a 7-day expansion, mice were treated with another 7-day retention (E7Rt7) or relapse for 1 (E7Rp1), 3 (E7Rp3), 7 days (E7Rp7). Immunofluorescence staining of SP7 (e), TOMM20 (f) and Parkin (g) in suture areas during expansion-relapse. Insets indicated by yellow squares. Red dotted lines in f2 and g2 show comparison between E7d and E7t7. Scale bar: 100 µm (low), 25 µm (high). n = 4–6/group. Data presented as mean ± SD. ns > 0.05, *P < 0.05, **P < 0.01, ***P < 0.001
Fig. 5
Fig. 5
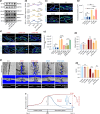
Mitochondrial dynamics during cranial suture expansion and relapse. a Graphical illustration of the in vivo model. a1 Gel-MA with agents injected into the cranial suture and solidified with curing light. a2 Diagram of pharmaceutical interventions with PGC-1α inhibitor SR-18292 (SR) or mitophagy inhibitor Mdivi-1 (Mdi) during 7-day expansion. a3 Diagram of pharmaceutical interventions with PGC-1α activator ZLN005 (ZL) or mitophagy activator MA-5 on expansion-retention models, SR or Mdi on expansion-retention or relapse models. Immunofluorescence staining and statistical analysis of TOMM20 in the suture area after pharmaceutical interventions in 7-day expansion (b), 7-day expansion and 7-day retention (E7t7) (c), or 7-day relapse (E7Rp7) (d) groups. n = 3/group. e1 Immunofluorescence staining of co-localization of LAMP1 and TOMM20. e2 Statistical analysis of LAMP1 intensity. e3 Co-localization score. n = 3/group. f Illustration of mitochondrial count changes during cranial suture expansion and relapse. SR-18292 inhibits early mitochondrial increase, Mdivi-1 prevents mitochondrial decline during retention, and MA-5 promotes mitochondrial clearance in relapse. Scale bar: 100 µm (low), 25 µm (high). Data presented as mean ± SD. ns > 0.05, *P < 0.05, **P < 0.01, ***P < 0.001
Fig. 6
Fig. 6
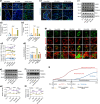
Phosphorylation of PERK directs mitochondrial changes during expansion and relapse. Immunofluorescence staining and statistical analysis of TOMM20 (a) and Parkin (b) in the suture area after GSK2606414 (GSK) treatment. Scale bar: 100 µm (low), 25 µm (high). n = 3/group. c Western blot showing TOMM20, FIS1, LAMP1, and Parkin expression in control (Con), 24-h stretch (S24) groups, as well as groups treated with GSK in control (Con + GSK) and S24 (S24 + GSK), and groups stretched for 24 h with GSK added halfway at 6-h point (A6-GSK). Curves show comparison with control group. n = 3/group. d Mitotracker and Lysotracker live cell staining (d1) and statistical analysis (d2) of mitochondria-lysosome co-localization. Scale bar: 10 µm (low), 2 µm (high). n = 6/group. e Western blot of TOMM20 and SOD2 expression in control, S6, Con + GSK, S6 + GSK, and S6 + GSK rescued with ZLN005 (S6 + GSK + ZL). n = 3/group. f Western blot of TOMM20 and SOD2 expression in control, S24, Con + GSK, A6 + GSK, and A6 + GSK rescued with MA5 (A6 + GSK + MA5). n = 3/group. g Illustration showing mitochondrial pool changes during in vitro stretching. Initial PERK phosphorylation activates PGC-1α for mitochondrial biogenesis (red line). After 6 h, PERK activates mitophagy, resulting in mitochondrial clearance (blue line). GSK treatment can be rescued by ZLN005 (initiation phase) or MA-5 (later stage). Data presented as mean ± SD. ns > 0.05, *P < 0.05, **P < 0.01, ***P < 0.001
Fig. 7
Fig. 7
Phosphorylation of PERK promoted TFEB nuclear translocation to influence mitochondrial dynamics. a Cellular immunofluorescence analysis of TFEB co-localization with DAPI in control (Con), 6-h stretch (S6), and 24-h stretch (S24) groups. Scale bar: 10 µm. n = 6/group. b The relative fold enrichment of Ppargc1α (coding PGC-1α), Lamp1 (coding LAMP1), and Prkn (coding Parkin) to Spike in DNA in CUT&RUN assay with TFEB antibody. n = 3/group. The black symbol on the top of column represents its comparison to control group. The red symbol represents comparison between groups. c1 Cellular immunofluorescence images of TFEB in groups treated with GSK2606414 (GSK) in control (Con + GSK), 6-h stretch (S6 + GSK), 24-h stretch (S24 + GSK) groups, and groups stretched for 24 h with GSK added halfway after 6-h stretch (A6 + GSK). Scale bar: 10 µm. n = 6/group. c2 Statistical analysis of the co-localization score of TFEB with DAPI. d Western-bolt analysis of Parkin, PINK1, LAMP1, FIS1, SOD2 and TOMM20 in Con, S24, Con-GSK, S24-GSK, and S24-GSK rescued with TFEB activator (S24 + GSK + Ta). Comparative labels on the curves indicate comparison with the control group. n = 3/group. e Western-bolt analysis of TOMM20 and SOD2 in Con, S6, Con + GSK, S6 + GSK, and S6 + GSK rescued with Ta (S6 + GSK + Ta) groups. Comparative labels on the curves indicate comparison with the control group. n = 3/group. f Immunofluorescence staining of TOMM20 in the suture area following GSK intervention. Scale bar: 100 µm for low magnification and 25 µm for high magnification. n = 3/group. Data are presented as mean ± standard deviation (SD). ns > 0.05, *P < 0.05, **P < 0.01, ***P < 0.001, ****P < 0.000 1
Fig. 8
Fig. 8
Regulation of osteogenesis and relapse progression via mitochondria manipulation. a Western-bolt analysis of RUNX2, COL1A1, Osteopontin and BMP2 expression in control (Con), 24-h stretch (S24), 24-h stretch followed by a 48-h halt (S24-H48), and H48 groups treated with the mitophagy activator MA-5 immediately after the cessation of stretch (S24-H48 + MA-5). n = 4/group. b, c Immunofluorescence staining of SP7 in suture areas. Scale bar: 100 µm. n = 4–6/group. d Morphological assessment of bone changes: d1 Representative micro-CT images illustrating bone length and quality in the expansion-activated frontal region; d2 Comparison of marginal bone length; d3 Evaluation of bone volume fraction (BV/TV) ratios. n = 4–6/group. e Illustration depicting new bone formation along cranial suture expansion and relapse progression. Throughout the expansion phase, osteogenic activity steadily increased, peaking around the 7-day mark and maintaining during retention. However, upon relapse, osteogenesis shifted towards osteoclast activity, leading to subsequent bone loss. Treatment with SR-18292 (SR) during the initial 7-day period inhibited early bone formation, while Midvi-1 (Mdi) administration during retention impacted remodeling-associated bone formation. Conversely, the use of MA-5 partially mitigated bone loss resulting from relapse. Data are presented as mean ± standard deviation (SD). ns > 0.05, *P < 0.05, **P < 0.01, ***P < 0.001, ****P < 0.000 1
Fig. 9
Fig. 9
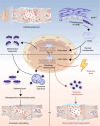
Schematic depiction summarizing the key findings of this study. Cranial suture expansion force induces endoplasmic reticulum (ER) stress and enhances ER-mitochondria contact. Under ER stress, phosphorylation of PERK—localized on mitochondria-associated ER membranes (MAM)—triggers the nuclear translocation of the transcription factor TFEB. TFEB activation proceeds in two stages: initially promoting the transcription of PGC-1α to enhance mitochondrial biogenesis, followed by upregulation of mitophagy-related genes to facilitate the clearance of excessive mitochondria. This coordinated, sequential regulation maintains mitochondrial homeostasis, supporting osteogenesis and antioxidative capacity during expansion and ultimately leading to successful bone remodeling. During relapse (illustrated by the red line), TFEB-mediated mitophagy is suppressed, resulting in delayed clearance of excessive mitochondria, accumulation of dysfunctional mitochondria, and impaired bone formation

Similar articles

References

    1. Stanton, E., Urata, M., Chen, J.-F. & Chai, Y. The clinical manifestations, molecular mechanisms and treatment of craniosynostosis. Dis. Model. Mech.15, dmm049390 (2022). - PMC - PubMed
    1. Yu, M. et al. Cranial suture regeneration mitigates skull and neurocognitive defects in craniosynostosis. Cell184, 243–256.e18 (2021). - PMC - PubMed
    1. Maruyama, T., Jeong, J., Sheu, T.-J. & Hsu, W. Stem cells of the suture mesenchyme in craniofacial bone development, repair and regeneration. Nat. Commun.7, 10526 (2016). - PMC - PubMed
    1. Zhao, H. et al. The suture provides a niche for mesenchymal stem cells of craniofacial bones. Nat. Cell Biol.17, 386–396 (2015). - PMC - PubMed
    1. Palma, J. C., Tejedor-Sanz, N., Oteo, M. D. & Alarcón, J. A. Long-term stability of rapid maxillary expansion combined with chincup protraction followed by fixed appliances. Angle Orthod.85, 270–277 (2015). - PMC - PubMed

Substances

LinkOut - more resources