. 2025 Jun 23;10(1):197.
doi: 10.1038/s41392-025-02279-8.

Multi-omics dissection of MAPK-driven senescence unveils therapeutic vulnerabilities in KIAA1549::BRAF-fusion pediatric low-grade glioma models

Affiliations

Multi-omics dissection of MAPK-driven senescence unveils therapeutic vulnerabilities in KIAA1549::BRAF-fusion pediatric low-grade glioma models

Romain Sigaud et al. Signal Transduct Target Ther. .

Abstract

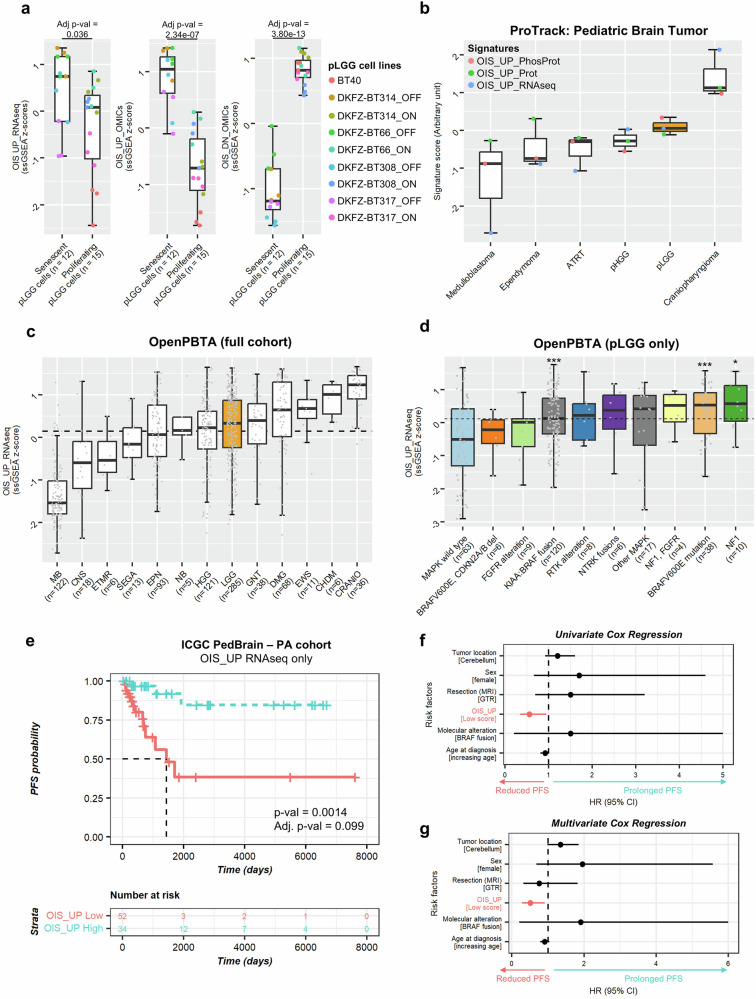
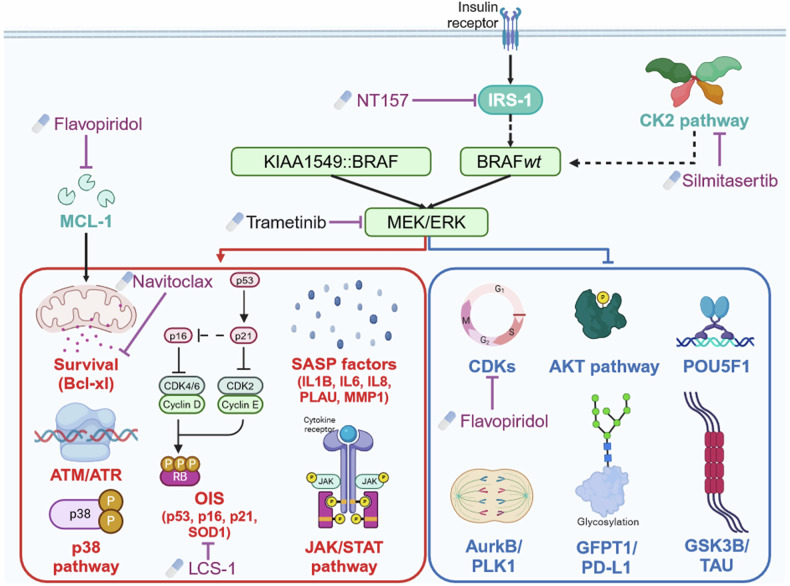
Pilocytic astrocytomas (PA), the most common pediatric low-grade gliomas (pLGGs), are characterized by genetic MAPK pathway alterations leading to constitutive activation and oncogene-induced senescence (OIS) accompanied with the senescence-associated secretory phenotype (SASP). This study investigates the molecular mechanisms of signaling pathways regulating OIS and SASP in pLGGs using a multi-omics approach. We utilized senescent DKFZ-BT66 cells derived from a primary KIAA1549::BRAF-fusion positive PA to generate RNA-sequencing and phospho-/proteomic datasets before and after treatment with the MEK inhibitor trametinib. Multi-omics factor analysis (MEFISTO) and single sample gene set enrichment analysis (ssGSEA) were employed to identify key OIS effectors and differentially regulated pathways upon MAPK inhibition. Trametinib treatment inhibited MAPK activity, OIS and SASP signatures across all omics levels, functionally underscored by reduced sensitivity towards senolytic drugs. We constructed a pathway network using a prior knowledge approach, mapping n = 106 upregulated and n = 84 downregulated direct downstream effectors of MAPK leading to OIS/SASP. These effectors are associated with better progression-free survival in pLGG patients, independent of tumor site, level of resection, and genetic aberration. Several compounds targeting signaling nodes (SOD-1, IRS1, CDK1/2, CK2) involved in OIS and under MAPK control were identified, of which n = 4 were validated in an additional primary KIAA1549::BRAF fusion pLGG model as potential new therapeutic vulnerabilities for the treatment of pLGG. Our unbiased multi-omics signaling pathway analysis identifies a specific and comprehensive network of MAPK-OIS-SASP interdependencies in pLGGs and suggests new therapeutic strategies for these tumors.


Conflict of interest statement

Competing interests: O.W. and T.M. were supported by research grants from Biomed Valley Discoveries, Inc., and Day One Biopharmaceuticals. TB received honoraria from Pierre Fabre and the European Society for Medical Oncology (ESMO). The remaining authors declare no competing interests.

Figures

Fig. 1
Fig. 1
MAPKi reverses OIS molecular and cellular effect in pLGG cell lines. a Schematic depiction of the MAPK signaling pathway, and the strategy of sequential inhibition of the pathway with trametinib 100 nM for different time span to identify key molecules differentially regulated upon MAPKi for each wave of activation. b Graphical depiction of the bioinformatics pipeline used in the course of the study. c Volcano plots depicting the differentially regulated mRNA, proteins and phosphopeptides identified in the senescent DKFZ-BT66 cells after 100 nM trametinib treatment. d Boxplot depicting the ssGSEA z-score of MAPK-/OIS-/SASP-related signatures, specific for RNAseq, proteomics and phosphoproteomics, in senescent DKFZ-BT66 cells treated with 100 nM trametinib for the indicated time span. Boxplots depict the median, first and third quartiles. Whiskers extend from the hinge to the largest/smallest value no further than 1.5 * IQR from the hinge (where IQR is the inter-quartile range). Significance was calculated with one-way ANOVA followed by Dunnett’s multiple comparisons test in Prism. *** adj. p-val < 0.001, not significant if not specified. n = 3 independent biological replicates were used for the RNAseq samples, and n = 4 independent biological replicates for the phospho-/proteomics samples. e Summary heatmap of the corresponding senolytic IC50 in the senescent DKFZ-BT66 and senescent DKFZ-BT317 in the different treatment schedule. The results depict the average IC50 of n = 3 independent biological replicates. Shading depicts the concentrations z-score calculated across rows, while the values in the heatmap represent raw IC50 in nM
Fig. 2
Fig. 2
Mapping of the multi-omics MAPK/OIS/SASP axis in pLGG cells. a Dotplot depicting the degree of correlation between factors identified in the MEFISTO model. b Bar graph depicting the total variance explained per omics layer (=view). c Depiction of the variance decomposition per factor. The graph shows how much variance is explained by which omics layer, for each factor. d Dissection of the factors identified as related to the waves 1, 3, and 4. e Protein–protein interaction network of the transcription factors identified by TFEA as being involved in the regulation of the genes from wave 3 and 4. Blue nodes are downregulated upon MAPKi, red nodes are upregulated upon MAPKi. f Senescence signaling pathway involving all molecules upregulated in OIS and under the control of the MAPK pathway in the senescent DKFZ-BT66. g Senescence-related signaling pathways involving all molecules downregulated in OIS and under the control of the MAPK pathway in the senescent DKFZ-BT66. Node’s shape depicts what omics layer/analysis the effector was identified from
Fig. 3
Fig. 3
Validation of the MAPK/OIS/SASP molecules in primary pLGG samples. a Boxplot depicting the ssGSEA z-score of the OIS_UP or OIS_DN molecules (from RNAseq layer only, or all three omics layers combined) in 9 patient-derived pLGG models (ON = proliferating cells, OFF = senescent cells, BT40 = proliferating). b Boxplot depicting the signature score (z-score sum, arbitrary unit) of the OIS_UP molecules from the RNAseq, proteomics and phosphoproteomics layers in n = 6 pediatric glioma entities from the ProTrack Pediatric Brain Tumor dataset from Petralia et al. Each dot represents the median OIS_UP z-score of each tumor entity dataset indicated, for all three omics layers from supplementary (ac). c Boxplot depicting the ssGSEA z-score of the OIS_UP genes from the RNAseq layer in n = 13 pediatric glioma entities from the Open Pediatric Brain Tumor Atlas. Dashed line depicts the overall median. MB medulloblastoma, EWS Ewin Sarcoma, EPN ependymoma, NB neuroblastoma, CNS other CNS embryonal tumor, ETMR embryonal tumor with multilayer rosettes, SEGA Subependymal Giant Cell Astrocytoma, CHDM chordoma, HGG high-grade glioma, CRANIO craniopharyngioma, GNT glial neuronal tumor, DMG diffuse midline glioma, pLGG low-grade glioma. d Boxplot depicting the ssGSEA z-score of the OIS_UP genes from the RNAseq layer in n = 10 pediatric low-grade glioma molecular subgroups from the Open Pediatric Brain Tumor Atlas. Dashed line depicts the overall median. Boxplots depict the median, first and third quartiles. Whiskers extend from the hinge to the largest/smallest value no further than 1.5 * IQR from the hinge (where IQR is the inter-quartile range). Significance was calculated with one-way ANOVA followed by the Tukey’s ‘Honest Significant Difference’ test. Depicted significance is in comparison to the group “MAPK wild type”, all other comparisons to other groups were not significant. e Kaplan–Meier curve of primary BRAF-driven PA samples from the ICGC PedBrain cohort grouped based on their enrichment for the OIS_UP genes from the RNAseq layer (p-value from log-rank test, and adjusted p-value corrected by Bonferroni method after multiple testing to identify the optimal cut-off with the best raw p-value). f Forest plot depicting the hazard ratio (HR) calculated in a univariate Cox proportional hazards model evaluating which clinico-molecular features are significantly associated with PFS. g Forest plot depicting the HR calculated in a multivariate Cox proportional hazards model evaluating independent prognostic factors
Fig. 4
Fig. 4
Identification of new co-regulated pathways in MAPKi treated pLGG cells. a Heatmap depicting the filtered signatures considered to be consistently regulated upon MAPKi treatment (trametinib 100 nM) in the senescent DKFZ-BT66 cells through omics layers. RNAseq = signature from RNAseq dataset, Prot = signatures from proteomics dataset. PhosProt = signatures from phosphoproteomics dataset. b Sunburst chart summarizing the signaling pathways upregulated (UP) and downregulated (DN) upon MAPKi (trametinib 100 nM) in the senescent DKFZ-BT66 cells. The inner circle represents the proportion (sections’ length) of signatures belonging to a given category relative to the total amount of signatures belonging to that category, while the outer circle represents the proportion (bars’ height) of signatures belonging to a given sub-category relative to the total amount of signatures belonging to that sub-category. c Butterfly plot depicting the results from the GSEA comparing RNAseq expression of the 100 nM trametinib 24 h samples and control, using the HALLMARK gene set. Only the signatures with an FDR q-val < 0.25 are depicted. NES normalized enrichment score, FDR false discovery rate. d Heatmap depicting the scaled peptide abundance of top 20 most upregulated proteins related to interferon activity and participating in the core enrichment of the HALLMARK signatures related to interferon alpha and gamma in the RNAseq data from (c)
Fig. 5
Fig. 5
Drug screen validation of key drugs worth investigation as first line or in combination with MAPKi in pLGG cells. a Summary dotplot depicting the results from a single-dose drug screen using n = 35 clinically relevant drugs targeting newly identified molecules and pathways in the senescent DKFZ-BT66 cells. Relative metabolic activity compared to the corresponding control is shown. The drug screen was performed in technical duplicates, and a single biological replicate. b Summary heatmap showing the IC50 values (nM) of a given MAPK-dependent cytotoxic drug either used as a single agent or after a 24 h pre-treatment with 100 nM trametinib in senescent DKFZ-BT66 and senescent DKFZ-BT317 cells. The data depict the average IC50 from n = 3 independent biological replicates. c Summary heatmap showing the IC50 values (nM) of a given MAPK-(in)dependent cytotoxic drug in senescent or proliferating DKFZ-BT66 and DKFZ-BT317 cells. The data depict the average IC50 from n = 3 independent biological replicates. * IC50 taken from historical experiments conducted in the same conditions, published by Sigaud et al. for the DKFZ-BT66, and Selt et al. for the DKFZ-BT317.
Fig. 6
Fig. 6
The MAPK/OIS/SASP axis in pLGG cells. Graphical depiction of the validated signaling pathway and molecules in the senescent pLGG models. Created in BioRender. Sigaud, R. (2024) https://BioRender.com/j47h916

References

    1. Price, M. et al. CBTRUS Statistical Report: primary brain and other central nervous system tumors diagnosed in the United States in 2017–2021. Neuro. Oncol.26, vi1–vi85 (2024). - PMC - PubMed
    1. Yao, R., Cheng, A., Zhang, Z., Jin, B. & Yu, H. Correlation between apparent diffusion coefficient and the Ki-67 proliferation index in grading pediatric glioma. J. Comput. Assist. Tomogr.47, 322–328 (2023). - PMC - PubMed
    1. Ostrom, Q. T. et al. Alex’s lemonade stand foundation infant and childhood primary brain and central nervous system tumors diagnosed in the United States in 2007–2011. Neuro. Oncol.16, x1 (2015). - PMC - PubMed
    1. Zelt, S. et al. Disease burden and healthcare utilization in pediatric low-grade glioma: a United States retrospective study of linked claims and electronic health records. Neuro-Oncol. Pract.11, 583–592 (2024). - PMC - PubMed
    1. Armstrong, G. T. et al. Survival and long-term health and cognitive outcomes after low-grade glioma. Neuro. Oncol.13, 223 (2011). - PMC - PubMed

MeSH terms