. 2025 Jun 23;8(1):383.
doi: 10.1038/s41746-025-01736-6.

Multiscale modeling of drug-induced liver injury from organ to lobule

Affiliations

Multiscale modeling of drug-induced liver injury from organ to lobule

Alon Malka-Markovitz et al. NPJ Digit Med. .

Abstract

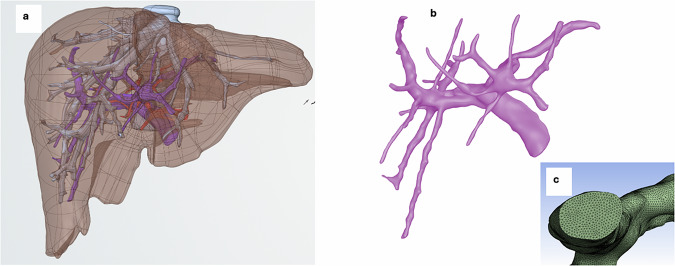
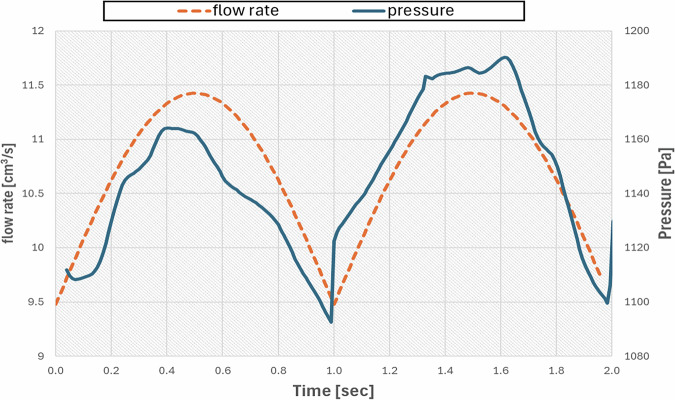
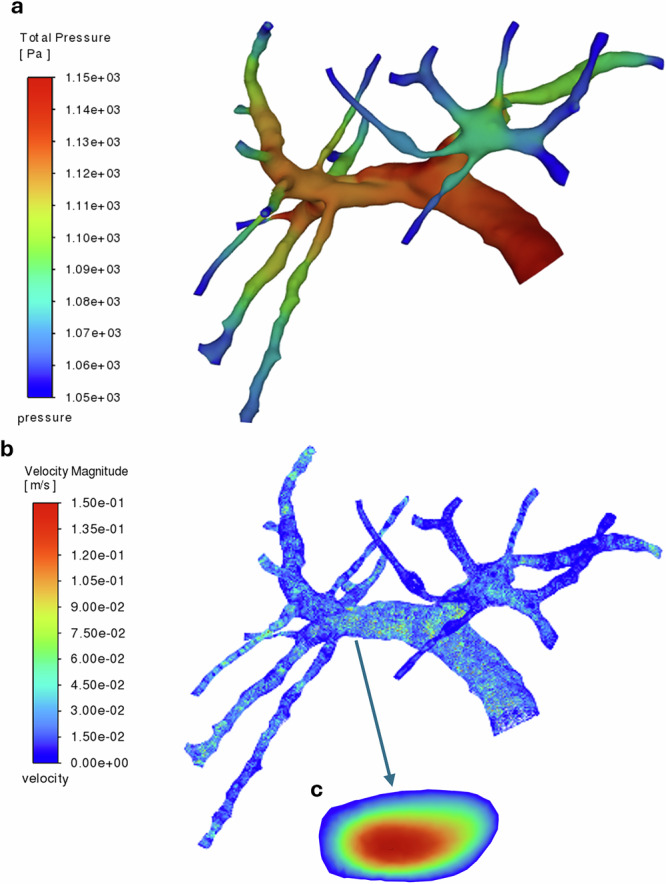
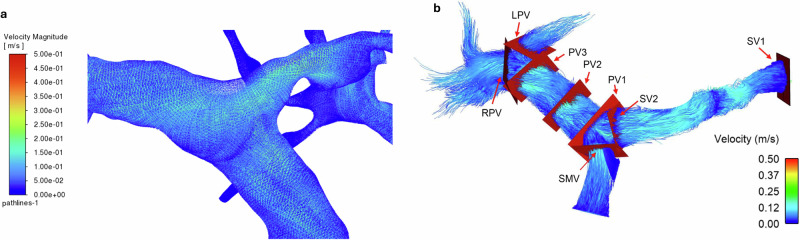
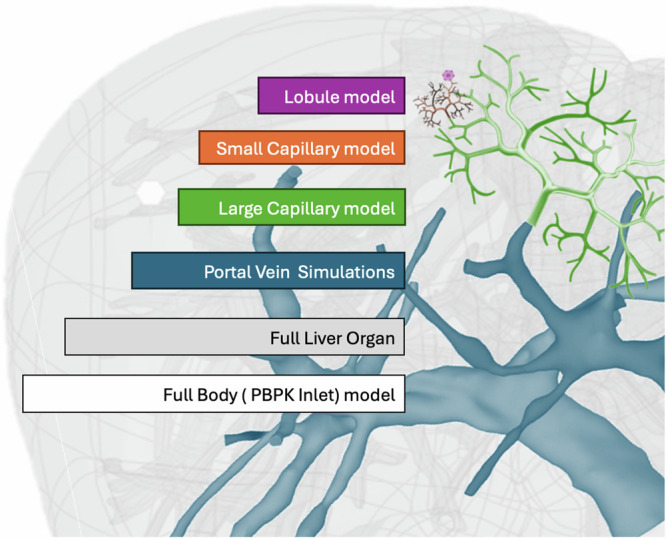
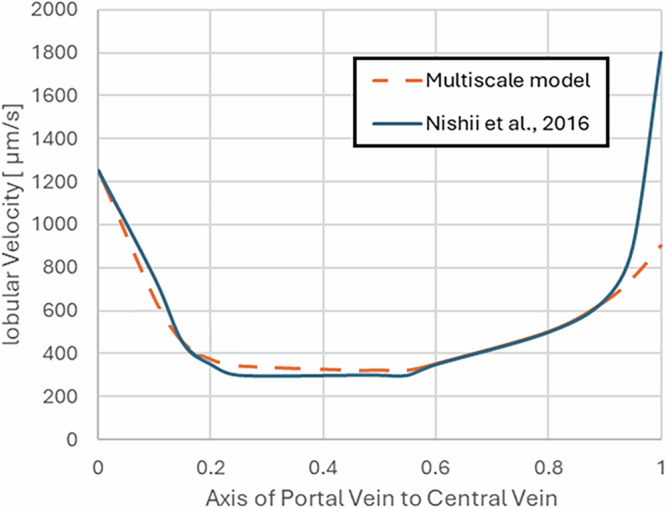
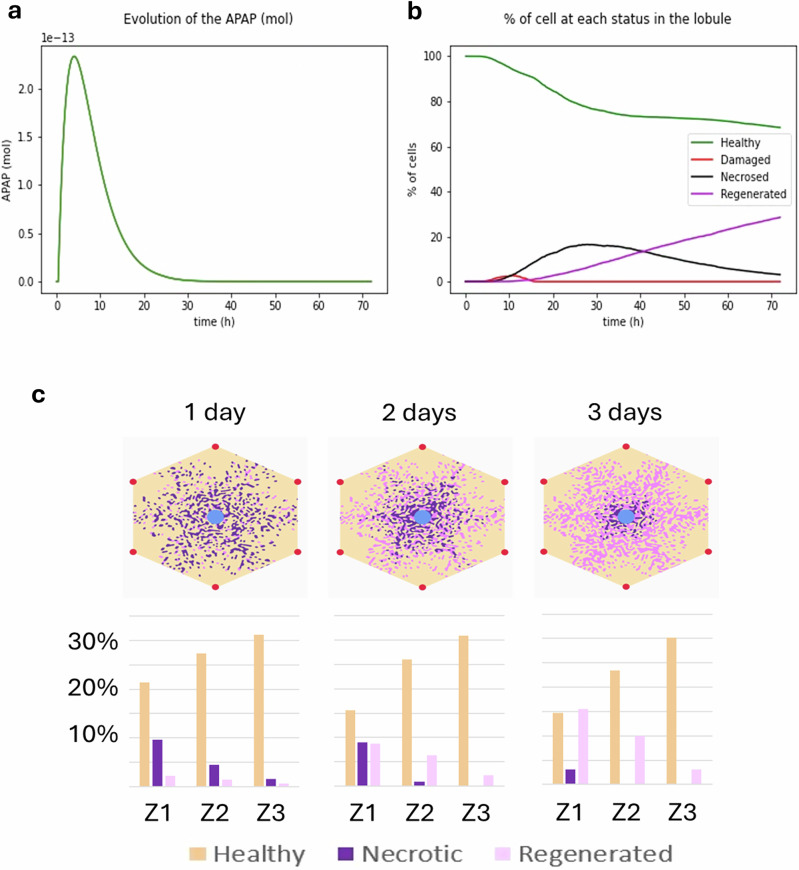
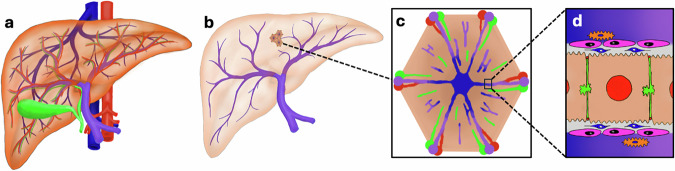
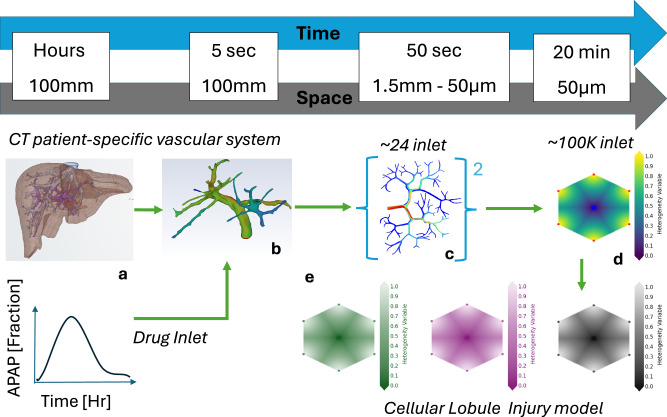
Drug-induced liver injury poses significant challenges in drug development and in clinical care. This study builds on prior work developing a Human Liver Virtual Twin by creating a Multiscale Computational Fluid Dynamics framework that integrates patient-specific anatomical data to predict acetaminophen-induced liver injury as a demonstration of its capability. The model bridges vascular, lobular, and cellular scales to simulate dynamic blood flow, drug transport, and injury mechanisms that accurately reflect clinically observed spatial heterogeneity. Results demonstrate accurate blood flow dynamics, predictions of hepatocellular damage, and a scalable framework for studying spatial heterogeneity applicable to other hepatic pathologies. This work establishes the foundational principles for a whole-organ virtual liver simulation methodology, potentially becoming a powerful tool to guide safety in therapeutic development and clinical treatment strategies, ultimately reducing reliance translation from animal models for preclinical drug testing.


Conflict of interest statement

Competing interests: S.M.L. is a Dassault Systemes employee. J.M.V. is a member of IQDILI and the NIH NIDDK Drug-Induced Liver Injury Network Data Safety and Management Board. N.R.G. has served as a consultant for Dassault Systemes. The remaining authors declare no competing interests.

Figures

Fig. 1
Fig. 1. Portal vein geometry and meshing.
a Full patient-specific liver geometry. b Geometry of the patient-specific Portal Vein CFD simulation. c Mesh cross-section.
Fig. 2
Fig. 2. Portal vein Blood flow rate and pressure inlet simulation.
Time-dependent simulation of portal vein inflow showing pulsatile pressure (blue) and flow rate (dashed orange) over a 2-s cardiac cycle. These dynamic inlet conditions are used to drive downstream liver simulations.
Fig. 3
Fig. 3. Portal vein CFD Simulation results.
a Pressure (Pa), (b) velocity streamlines (m/s), (c) representative cross-section of the velocity gradient in the portal vein.
Fig. 4
Fig. 4. Comparison of simulation CFD results of the PV with 4D MRI flow.
a PV velocity magnitude (m/s) predicted with multi-scale pipeline. b PV velocity magnitude (m/s) predicted measured with 4D MRI flow from Huang et al..
Fig. 5
Fig. 5. A multiscale method scheme.
Illustration of the multiscale hierarchical integration of models used to simulate drug transport and toxicity across physiological scales. The framework spans from the full-body PBPK model (bottom) to the lobule model (top), which represents the cellular microenvironment where tissue damage occurs.
Fig. 6
Fig. 6. Large CSM CFD simulation results.
a Pressure scheme (Pa). b Average inlet Velocity of 0.078 (m/s). c high inlet velocity of 0.12 (m/s). d Low inlet velocity of 0.035 (m/s).
Fig. 7
Fig. 7. Small CSM CFD simulation results.
a Pressure scheme (Pa). b Average inlet Velocity of 7.2 (mm/s). c High inlet velocity of 12.5 (mm/s). d Low inlet velocity of 2 (mm/s).
Fig. 8
Fig. 8. Lobule CFD simulation results.
a High velocity. b Average velocity. c Low velocity inlet of both pressure and velocity inside the lobule.
Fig. 9
Fig. 9. Validation of lobular velocity profile against literature data.
Velocity along the portal-to-central vein axis within the lobule is shown for the multiscale model (dashed orange) and experimental data from Nishii et al. (solid blue).
Fig. 10
Fig. 10. Results obtained for a 27.1 g overdose.
a Lobule cellular APAP input obtained for a 27.1 g overdose. b Induced proportion of cellular states in the lobule during overdose. c Resulting lobular damage map for the scenario.
Fig. 11
Fig. 11. Simulated DILI synthetic scenarios progression under varying lobular damage conditions.
2 mm/s velocity inlet of L-CSM model results. a Normal healthy capillary. b 1–4 outlets section (marked in red) that has damaged lobules with 820 Pa high-pressure. c All lobules are damaged with 820 Pa high pressure All 820 Pa.
Fig. 12
Fig. 12. Visualization of the different scales of the human liver.
The organ scale (cm) with (a) the liver and (b) the portal vasculature. c The functional scale (mm), the lobule and (d) the cellular scale (μm) with hepatocytes in beige, stellate cells in blue, Kupfer cells in orange and endothelial cells in pink. Figure adapted from Camara Dit Pinto et. al. with authorization.
Fig. 13
Fig. 13. Multiscale methodology.
a Introduction of patient-specific Portal Vien from MRI and APAP drug time concertation from PBPK models. b CFD simulations of Portal Vien. c CFD simulation of Large and Small capillaries model. d CFD Lobule models. eSchematic view of lobule Damage model.

References

    1. Hosack, T., Damry, D. & Biswas, S. Drug-induced liver injury: a comprehensive review. Ther. Adv. Gastroenterol.16, 17562848231163410 (2023). - PMC - PubMed
    1. Andrade, R. J. et al. Drug-induced liver injury. Nat. Rev. Dis. Prim.5, 58 (2019). - PubMed
    1. Mostafa, F. & Chen, M. Computational models for predicting liver toxicity in the deep learning era. Front Toxicol.5, 1340860 (2023). - PMC - PubMed
    1. Ellison, C., Hewitt, M. & Przybylak, K. In Silico Models for Hepatotoxicity. Methods Mol. Biol.2425, 355–392 (2022). - PubMed
    1. Speid, L. H., Lumley, C. E. & Walker, S. R. Harmonization of guidelines for toxicity testing of pharmaceuticals by 1992. Regulatory Toxicol. Pharmacol.12, 179–211 (1990). - PubMed

LinkOut - more resources