. 2025 Aug;44(15):4331-4351.
doi: 10.1038/s44318-025-00488-z. Epub 2025 Jun 23.

Epiblast-derived CX3CR1+ progenitors generate cardiovascular cells during cardiogenesis

Affiliations

Epiblast-derived CX3CR1+ progenitors generate cardiovascular cells during cardiogenesis

Kyuwon Cho et al. EMBO J. 2025 Aug.

Abstract

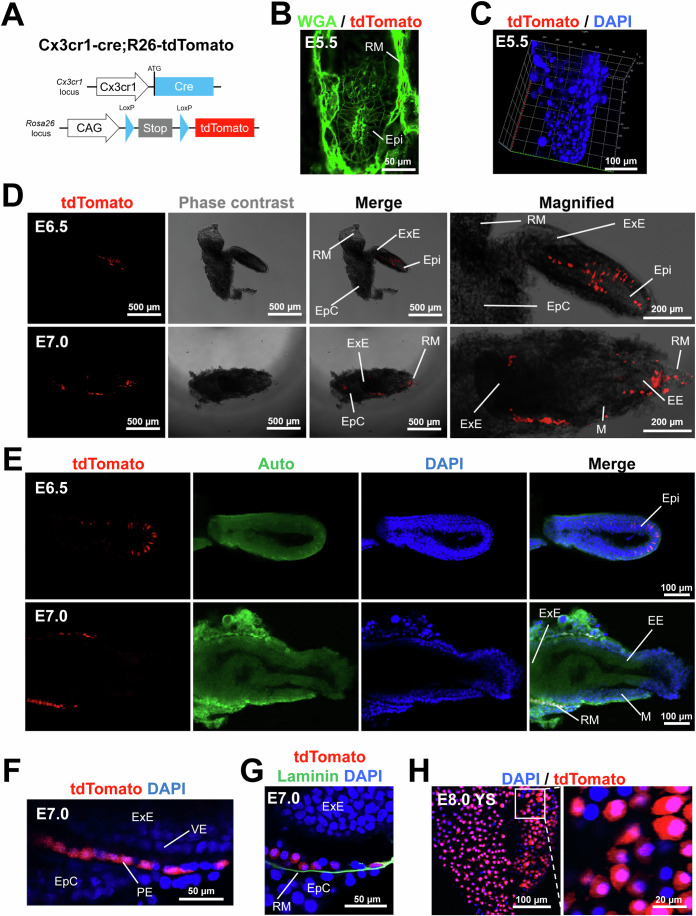
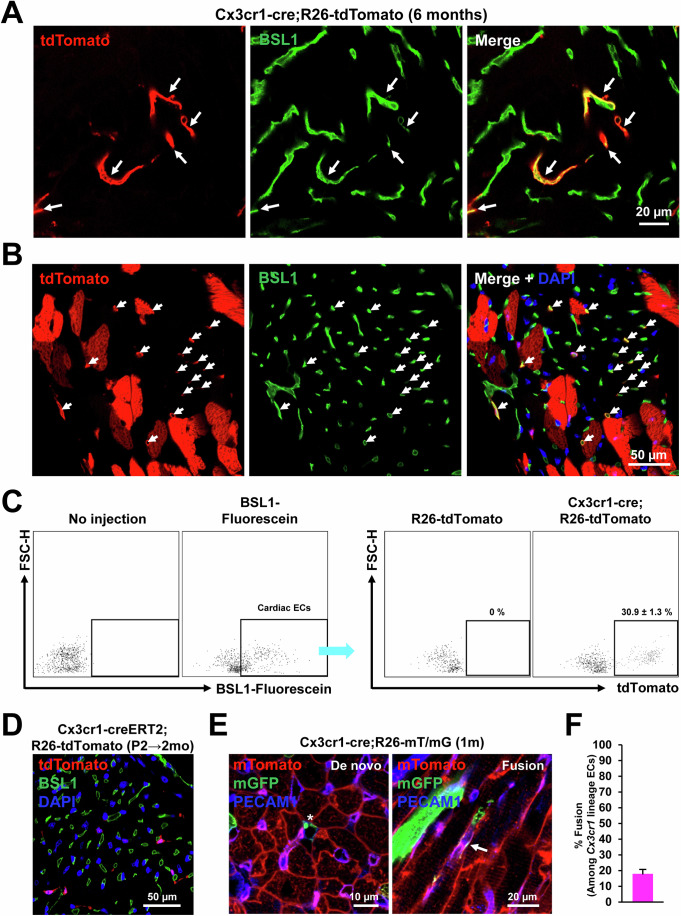
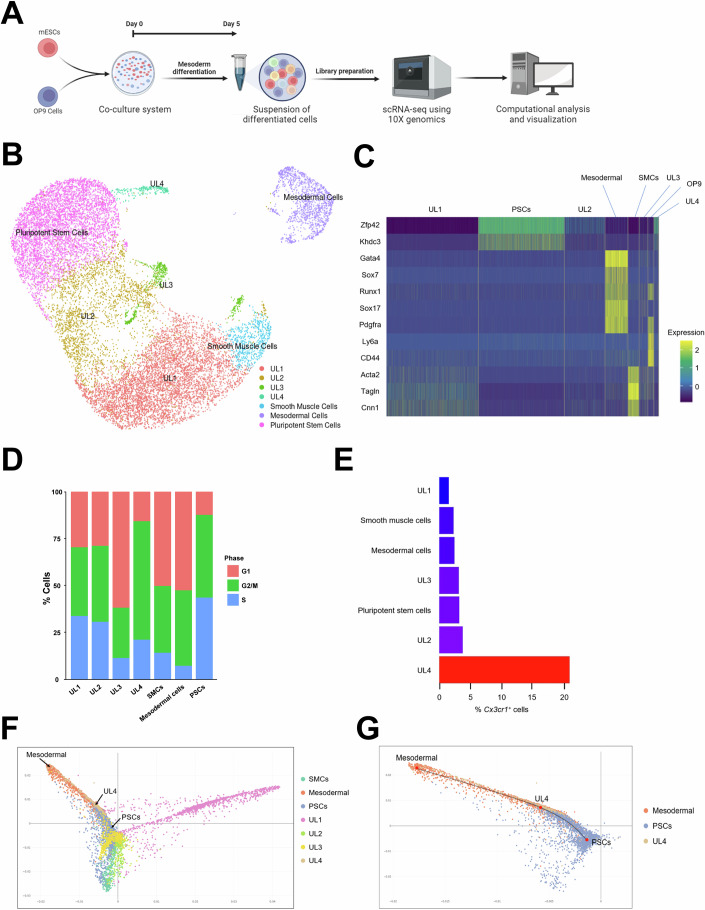
CX3CR1+ cells generate tissue macrophages in the developing heart and play cardioprotective roles in response to ischemic injuries in the adult heart. However, the origin and fate of CX3CR1+ cells during cardiogenesis remain unclear. Here, we performed genetic lineage tracing of CX3CR1+ cells and their progeny (termed Cx3cr1 lineage cells) in the mouse and demonstrated that they emerge from a subset of epiblast cells at embryonic day E6.5 and contribute to the parietal endoderm cells at E7.0. At E8.0-9.5 of development, Cx3cr1 lineage cells produced cardiomyocytes and endothelial cells via both de novo differentiation and fusion with pre-existing cardiomyocytes or endothelial cells, respectively. Cx3cr1 lineage cells persisted in the adult heart, comprising ~13% of cardiomyocytes and ~31% of endothelial cells. Additionally, CX3CR1+ cells differentiated from mouse embryonic stem cells generated cardiomyocytes, endothelial cells, and macrophages in vitro, ex vivo, and in vivo. Single-cell RNA sequencing revealed that Cx3cr1+ cells represent an intermediate cell population transitioning from embryonic stem cells to mesoderm. Taken together, embryonic CX3CR1+ cells constitute a multipotent epiblast-derived progenitor population that contributes not only to the formation of macrophages, but also of cardiomyocytes and endothelial cells.

Keywords: CX3CR1; Cardiogenesis; Cardiomyocyte; Endothelial Cells; Genetic Lineage Tracing.


Conflict of interest statement

Disclosure and competing interests statement. The authors declare that they have no competing interests or relevant financial or non-financial disclosures.

Figures

Figure 1
Figure 1. Genetic lineage tracing of CX3CR1+ cells during early mouse development.
(A) A schematic showing the genotype of embryos obtained by crossbreeding of Cx3cr1-cre mice and R26-tdTomato mice (Cx3cr1-cre;R26-tdTomato). The generated mice enable permanent labeling of CX3CR1+ cells and their progeny with tdTomato, a red fluorescent protein. (B) A representative confocal microscopic image of the E5.5 embryo stained for WGA (green fluorescence). (C) A 3D-reconstructed image of the E5.5 embryo stained for DAPI. (D) Representative phase contrast and fluorescent microscopic images of the embryo at E6.5 and E7.0. Epi epiblast, ExE extraembryonic ectoderm, EE embryonic ectoderm, RM Reichert’s membrane, M mesoderm, EpC ectoplacental cone. (E) Representative confocal microscopic images of the embryos at E6.5 and E7.0. Auto autofluorescence. DAPI (blue). (F) A magnified confocal microscopic image of the embryo at E7.0. VE visceral endoderm, PE parietal endoderm. (G) A representative confocal microscopic image of the embryo at E7.0 stained for laminin. DAPI (blue). (H) Confocal microscopic images of the YS membrane at E8.0 after DAPI staining. All images are representative of three individual embryos. Source data are available online for this figure.
Figure 2
Figure 2. Contribution of CX3CR1+ cells and their progeny to embryonic CMs in the developing heart.
(A) A representative confocal microscopic image of Cx3cr1-cre;R26-tdTomato mouse embryonic hearts at E9.5 in a cross-sectional view. The sectioned mouse embryos were immunostained for TNNT2 (green). DAPI (blue). (BE) Magnified images of the boxed area in panel (A). Arrows indicate tdTomato+TNNT2+ cells, which represent CMs derived from CX3CR1+ cells and their progeny. (F) Magnified images of the boxed area in panel (E). lv left ventricle, avc atrioventricular canal. All images are representative of three individual embryos. Source data are available online for this figure.
Figure 3
Figure 3. Prenatal contribution of CX3CR1+ cells and their progeny to CMs that persist into adulthood via both de novo differentiation and fusion with preexisting CMs.
(A) Representative confocal microscopic images of the adult heart (6 months old) of a Cx3cr1-cre;R26-tdTomato mouse. Heart tissues were sectioned and stained for ACTN2 (green). tdTomato (red). DAPI (blue). (B) Confocal microscopic images of the CMs dissociated from a Cx3cr1-cre;R26-tdTomato mouse (6 months old) heart after staining for TNNT2 and DAPI. (C) Flow cytometric plots for the dissociated CMs used in panel B (n = 8). TNNT2+ CM population was further gated to analyze the percentage of tdTomato+ cells. R26-tdTomato mice of the same age were used as a negative control. Cell population percentages were presented as mean ± standard error of the mean (s.e.m). (D) A representative confocal microscopic image of the Cx3cr1-creERT2;R26-tdTomato heart stained for TNNT2. P2 neonatal mice were given tamoxifen via a single subcutaneous injection, and hearts were harvested after 2 months. A confocal microscopic image of a one-month-old Cx3cr1-cre;R26-mT/mG heart and the quantification of the percentage of fusion-derived CMs. Asterisks indicate de novo CMs derived from Cx3cr1 lineage cells and arrows indicate CMs derived from fusion between Cx3cr1 lineage cells and preexisting CMs. DAPI (blue). The error bar is presented as mean ± s.e.m. (E, F) Quantification of the percentage of fusion-derived CMs. Five mice were examined. Representative images from nine different sections per mouse were assessed. In each mouse, the number of double-positive cells was summed and divided by the total number of mGFP-positive cells to calculate the fusion rate for each mouse. The error bar is presented as mean ± s.e.m. Source data are available online for this figure.
Figure 4
Figure 4. Prenatal contribution of CX3CR1+ cells and their progeny to cardiac ECs that persist into adulthood via both de novo and fusion with preexisting ECs.
(A, B) Representative confocal microscopic images of the Cx3cr1-cre;R26-tdTomato heart in a longitudinal section (A) and in a cross section (B). Adult (6 months old) mouse hearts were perfused with fluorescein-labeled BSL1 to visualize blood vessels. Arrows indicate cells with both tdTomato and BSL1 signals. (C) BSL1-perfused hearts were enzymatically digested and subjected to flow cytometry, showing the percentage of Cx3cr1 lineage ECs (n = 3). Cell population percentages were presented as mean ± standard error of the mean (s.e.m). (D) A representative confocal microscopic image of the Cx3cr1-creERT2;R26-tdTomato heart perfused with BSL1. P2 neonatal mice were given tamoxifen via a single subcutaneous injection, and hearts were harvested after 2 months. (E) Representative confocal microscopic images of the 1-month-old Cx3cr1-cre;R26-mT/mG hearts stained for PECAM1. An asterisk indicates de novo ECs derived from CX3CR1+ cells and their progeny and an arrow indicates ECs derived from cell fusion. DAPI (blue). (F) Quantification of the percentage of fusion-derived ECs. Three mice were examined. Representative images from seven different sections per mouse were assessed. In each mouse, the number of double-positive cells was summed and divided by the total number of mGFP-positive cells to calculate the fusion rate for each mouse. The error bar is presented as mean ± standard error of the mean (s.e.m). Source data are available online for this figure.
Figure 5
Figure 5. Generation of CMs, ECs, and macrophages by E6.5 CX3CR1+ cells during embryonic development.
(A) A schematic showing the genotype of mice obtained by crossbreeding Cx3cr1-creERT2 and R26-tdTomato mice (Cx3cr1-creERT2;R26-tdTomato) used in this figure. (B) The experimental timeline for lineage tracing of CX3CR1+ cells for panels C-I. Pregnant mice with E6.5 embryos were given tamoxifen via a single peritoneal injection, and embryos were harvested at E10.5. (C, D) Representative bright field and fluorescent microscopic images of the embryo at E10.5 taken at low (C) and high (D) magnifications. Arrows indicate cells positive for tdTomato signal. (EJ) Representative confocal microscopic images of the heart and brain stained for ACTN2 (E), PECAM1 (F, H) and CD68 (G, I, J) as indicated. DAPI (blue). For panel (J), tamoxifen was administered at E8.5 and embryos were harvested at E12.5. All images are representative of three individual embryos. Source data are available online for this figure.
Figure 6
Figure 6. Generation of CX3CR1+ cells from differentiating mESCs and their characterization in vitro, ex vivo, and in vivo.
(A) A schematic of experimental procedures used in panels B-C. mESCs were cocultured with OP9 cells and CX3CR1+ cells were sorted by MACS at D5. Cells were further cultured in cardiac (upper) or endothelial (lower) differentiation conditions. (B, C) Representative confocal microscopic images of cultured mESC-CX3CR1+ cells stained for TNNT2 at D15-20 (B) and KDR at D25 (C). DAPI (blue). (D) A schematic of experimental procedures used in panels E-F. FACS-isolated mESC-CX3CR1+ cells were labeled with DiI and loaded on top of the Matrigel containing E15.5 fetal mouse hearts (n = 12). (E, F). Representative confocal microscopic images of fetal mouse hearts stained for ACTN2 (E) and PECAM1 (F) at D7. Arrows indicate CMs (E) and ECs (F) contributed by DiI-labeled mESC-CX3CR1+ cells. DAPI (blue). (G) A schematic of experimental procedures used in panels H-L. FACS-isolated mESC-CX3CR1+ cells were labeled with DiI and injected into the adult mouse hearts together with injectable nanomatrix PA-RGDS (n = 3). (H) A representative confocal microscopic image of the heart at 10 days post-injection. LV left ventricle, RV right ventricle. (IL) Representative confocal microscopic images of the heart stained for ACTN2 (I, J) and PECAM1 (K, L). Arrows indicate CMs (J) and ECs (L) contributed by mESC-CX3CR1+ cells. DAPI (blue). Source data are available online for this figure.
Figure 7
Figure 7. scRNA-seq analysis of mESC-CX3CR1+ cells.
(A) A schematic showing the experimental procedures used in this figure. J1 mESCs and OP9 cells were cocultured for 5 days and subjected to scRNA-seq. (B) UMAP visualization of 19,550 cells harvested at Day 0 (J1 mESCs) and Day 5 after coculture with OP9 cells. The cell clusters that did not express any known cell type-specific genes were defined as “unknown lineage” (UL). The cluster for OP9 cells (Ly6a+CD44+) were removed because they were not derived from mESCs. (C) A heat map showing the expression of cell type-specific genes across cell clusters. (D) Cell cycle analysis of cell clusters using the CellCycleScoring algorithm. (E) A bar graph showing the percentage of Cx3cr1+ cells in each cluster. (F) A diffusion map showing all cell clusters. (G) A diffusion map showing only mesodermal cells, UL4, and PSCs.

Similar articles

References

    1. Abram CL, Roberge GL, Hu Y, Lowell CA (2014) Comparative analysis of the efficiency and specificity of myeloid-Cre deleting strains using ROSA-EYFP reporter mice. J Immunol Methods 408:89–100 - PMC - PubMed
    1. Akiyama T, Xin L, Oda M, Sharov AA, Amano M, Piao Y, Cadet JS, Dudekula DB, Qian Y, Wang W et al (2015) Transient bursts of Zscan4 expression are accompanied by the rapid derepression of heterochromatin in mouse embryonic stem cells. DNA Res 22:307–318 - PMC - PubMed
    1. Ali SR, Menendez-Montes I, Warshaw J, Xiao F, Sadek HA (2020) Homotypic fusion generates multinucleated cardiomyocytes in the murine heart. Circulation 141:1940–1942 - PMC - PubMed
    1. Arnold L, Perrin H, de Chanville CB, Saclier M, Hermand P, Poupel L, Guyon E, Licata F, Carpentier W, Vilar J, Mounier R, Chazaud B, Benhabiles N, Boissonnas A, Combadiere B, Combadiere C (2015) CX3CR1 deficiency promotes muscle repair and regeneration by enhancing macrophage ApoE production. Nat Commun 6:8972 - PMC - PubMed
    1. Ban K, Park HJ, Kim S, Andukuri A, Cho KW, Hwang JW, Cha HJ, Kim SY, Kim WS, Jun HW et al (2014) Cell therapy with embryonic stem cell-derived cardiomyocytes encapsulated in injectable nanomatrix gel enhances cell engraftment and promotes cardiac repair. ACS Nano 8:10815–10825 - PMC - PubMed

MeSH terms

Substances

LinkOut - more resources