. 2025 Jul;57(7):1708-1717.
doi: 10.1038/s41588-025-02233-y. Epub 2025 Jun 23.

Predicting resistance to chemotherapy using chromosomal instability signatures

Affiliations

Predicting resistance to chemotherapy using chromosomal instability signatures

Joe Sneath Thompson et al. Nat Genet. 2025 Jul.

Abstract

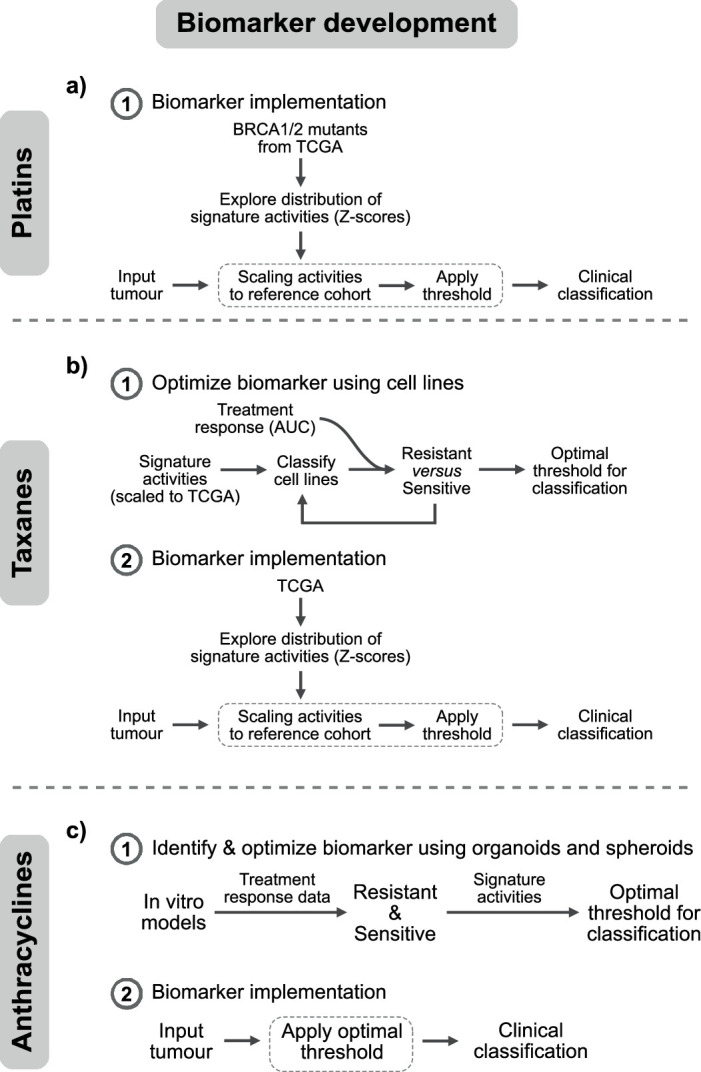
Chemotherapies are often given without precision biomarkers, exposing patients to toxic side effects without guaranteed benefit. Here we present chromosomal instability signature biomarkers that identify resistance to platinum-, taxane- and anthracycline-based treatments using a single genomic test. In retrospectively emulated randomized-control biomarker clinical trials using real-world cohorts (n = 840), predicted resistant patients had elevated treatment failure risk for taxane (hazard ratio (HR) of 7.44) and anthracycline (HR of 1.88) in ovarian, taxane (HR of 3.98) and anthracycline (HR of 3.69) in metastatic breast and taxane (HR of 5.46) in metastatic prostate. Nonrandomized emulations showed predictive capacity for platinum resistance in ovarian (HR of 1.46) and anthracycline in sarcoma (HR of 3.59). We demonstrate feasibility using whole-genome sequencing, capture-panel sequencing and cell-free DNA. Our findings highlight the clinical value of chromosomal instability signatures in predicting resistance to chemotherapies across multiple cancer types, with the potential to transform the one-size-fits-all chemotherapy approach into precise, tailored treatment.


Conflict of interest statement

Competing interests: G.M., A.M.P., J.D.B., J.Y. and F.M. are co-founders, directors and shareholders of Tailor Bio Ltd. J.S.T., L.M., D.G.-L., A.R., O.A. and A.E.C. are current or recent employees and shareholders of Tailor Bio Ltd. M.E.-R., W.-K.L., H.D. and D.D.S. are current or previous employees of Tailor Bio Ltd. G.M., F.M., A.M.P. and J.D.B. are inventors on a patent on using copy number signatures to predict response to doxorubicin treatment in ovarian cancer (patent no. PCT/EP2021/065058). G.M., B.H. and F.M. are inventors on a patent on a method for identifying pan-cancer copy number signatures (patent no. PCT/EP2022/077473). G.M., D.G.-L. and D.G.-S. are inventors on a patent on a method for capture bias correction for copy number calling in targeted sequencing data (patent no. PCT/EP2024/070580). The other authors declare no competing interests.

Figures

Fig. 1
Fig. 1. Optimization of biomarkers to predict chemotherapy resistance pan-cancer.
a, The workflow for using CIN signatures as biomarkers for predicting resistance to platinum-based chemotherapies. b, Cox proportional-hazards regression models showing overall survival in TCGA esophageal adenocarcinoma (TCGA-ESCA) patients (n = 90) classified as predicted or sensitive to platinum-based chemotherapy after applying the classifier from a. The dots and error bars represent the HR and its 95% CI, respectively. The Cox proportional-hazards models correct for stage and age at diagnosis. The asterisk denotes a significant result at a level of 0.05. c, The workflow for using CIN signatures as biomarkers for predicting resistance to taxanes. d, A dot plot showing the mean AUC of cell lines predicted as resistant (y axis) using a range of signature activities for thresholding (x axis). A total of 285 cell lines having high-quality paclitaxel response data were included in the analysis. The red dot denotes the activity value selected as the optimal threshold. The dashed lines show the lower and upper CX5 activity thresholds that match the expected rate of cells as resistant (30% to 60%). e, The workflow for using CIN signatures as biomarkers for predicting resistance to anthracyclines. f, A contingency table showing the agreement between the observed and the predicted response of patient-derived models to doxorubicin in vitro. Samples with at least one of the three amplification-related signatures (CX8/CX9/CX13) showing an activity higher than the optimal threshold were predicted as resistant.
Fig. 2
Fig. 2. Performance assessment of platinum, taxane and anthracycline resistance prediction in the clinical OV04 study.
a, Cox proportional-hazards model results for predicting resistance to platinum-based chemotherapy. b, Cox proportional-hazards model results for predicting resistance to taxane. c, Cox proportional-hazards model results for predicting resistance to anthracycline. PFS was used as the endpoint. All analyses were evaluated at a significance level of 0.05. An asterisk denotes significant results. Dots and error bars represent the HR and its 95% CI, respectively. Multiple testing correction was not applied as each combination of biomarker and cohort is unique.
Fig. 3
Fig. 3. Performance assessment of platinum, taxane and anthracycline resistance prediction across real-world cohorts of primary tumors.
a, Cox proportional-hazards regression models showing TTF in patients with primary ovarian cancer predicted as resistant to first-line platinum-based treatment stratified by age at diagnosis (<60, 60–69 and ≥70 years old) and controlling for tumor stage. b, Cox proportional-hazards regression models showing TTF in patients with relapsed ovarian cancer predicted as resistant to taxane stratified by age at diagnosis (<65 and ≥65 years) and controlling for an interaction term between the treatment arm and first-line TTF. The reported HR is a point estimate at 6 months after first-line treatment (further details in Supplementary Note 2). c, Cox proportional-hazards regression models showing TTF in patients with relapsed ovarian cancer predicted as resistant to anthracycline stratified by age at diagnosis (<65 and ≥65 years) and controlling for platinum sensitivity (≤6 and >6 months first-line TTF). d, Cox proportional-hazards regression models showing TTF in patients with primary sarcoma predicted as resistant to anthracycline controlled for ifosfamide as a co-therapy. The limited sample size precluded us from correcting the model by other clinical covariates. All analyses were evaluated at a significance level of 0.05. An asterisk denotes significant results. The dots and error bars represent the HR and its 95% CI, respectively. Multiple testing correction was not applied as each combination of biomarker and cohort is unique. Inverse probability weighting was applied in all analyses to account for treatment selection biases across patients due to year of treatment/biopsy.
Fig. 4
Fig. 4. Performance assessment of taxane and anthracycline resistance prediction across real-world cohorts of metastatic tumors.
a, Cox proportional-hazards regression models showing TTF in patients with metastatic prostate cancer predicted as resistant to taxane controlled for age at diagnosis. Gleason grade was not available for correction. b,c, Cox proportional-hazards regression models showing TTF in metastatic breast patients predicted as resistant to taxane (b) and anthracycline (c). Regression models were controlled for age at diagnosis. The limited sample size in the anthracycline-sensitive arm precluded us from performing a survival analysis. All analyses were evaluated at a significance level of 0.05. An asterisk denotes significant results. The dots and error bars represent the HR and its 95% CI, respectively. Multiple testing correction was not applied as each combination of biomarker and cohort is unique. Inverse probability weighting was applied in all analyses to account for treatment selection biases across patients due to year of treatment/biopsy.
Fig. 5
Fig. 5. Comparison of response prediction between paired samples.
a, A bar plot showing the activities of the 17 CIN signatures (CX) in tumor biopsies sequenced by using both sWGS (sW) and TSO500 (T5). Only tissue biopsies from patients with high-quality sWGS-derived copy number profiles that met the inclusion criteria were also sequenced with TSO500. A cosine similarity close to 1 indicates similar activities between sample-matched data. b, A contingency table showing the number of patients predicted as sensitive or resistant using our signature-based clinical classifiers in tumor samples sequenced by sWGS and TSO500. c, A bar plot showing signature activities in matched tumor tissue (T) and plasma (P) samples from the same patient. Only high-quality plasma samples were used for deriving copy number profiles and signature quantification. A cosine similarity close to 1 indicates similar activities between patient-matched biopsies. d, A contingency table showing the number of patients predicted as sensitive or resistant using our signature-based clinical classifiers in tumor tissue and plasma biopsies. The numbers in gray boxes represent the patient IDs.
Extended Data Fig. 1
Extended Data Fig. 1. Workflow for the development and optimisation of three biomarkers for predicting resistance to platinum, taxanes and anthracyclines.
a) Implementation of a robust signature scaling procedure for pan-cancer application of the platinum biomarker. All BRCA1/2 mutants in the TCGA dataset (n=375) are used as reference for scaling signature activities of new samples (see Methods). b) Optimisation and pan-cancer implementation of a clinical biomarker for predicting taxane resistance. Biomarker optimisation was initially performed using a collection of 285 cancer cell lines treated with taxanes. To achieve a pan-cancer implementation, all TCGA samples were used as reference for scaling signature activities of new samples (see Methods). c) Identification, optimisation and implementation of a biomarker for predicting resistance to anthracyclines. In vitro models derived from 23 ovarian cancer patients were treated with doxorubicin and then used to identify and optimise the biomarker (see Methods).
Extended Data Fig. 2
Extended Data Fig. 2. Pilot study (OV04) REMARK diagram.
a) REMARK diagram summarising the quality control filtering of samples and patients from the OV04 study obtain a curated cohort for assessing for platinum resistance prediction. b) REMARK diagram summarising the quality control filtering of samples and patients from the OV04 study to obtain a curated cohort for assessing taxane resistance prediction. c) REMARK diagram detailing the filtering procedure to obtain the organoids and spheroids for anthracycline biomarker discovery, as well as summarising the quality control filtering of samples and patients from the OV04 study to obtain a curated cohort for assessing anthracycline resistance prediction.
Extended Data Fig. 3
Extended Data Fig. 3. OV04 patients included in the single-arm study testing biomarker performance for platinum, taxane and anthracycline.
UpSet plot illustrating the number of ovarian cancer patients included across three distinct single-arm trial designs emulated in the OV04 cohort. The bar chart in the lower left displays the total number of patients tested with each of the three chemotherapy treatments. The main bar chart shows the size of each intersection between sets, as indicated by the matrix of overlapping sets below.
Extended Data Fig. 4
Extended Data Fig. 4. Distribution of different treatment combinations with platinum, taxanes and anthracyclines in the OV04 cohort.
a) Number of patients in the OV04 cohort for testing biomarker performance of platinum-based resistance. b) Number of patients in the OV04 cohort for testing biomarker performance of taxane resistance. c) Number of patients in the OV04 cohort for testing biomarker performance of anthracycline resistance.
Extended Data Fig. 5
Extended Data Fig. 5. Summary of the biomarker trial designs that were used for trial emulation.
a) Schematic illustrating the design of a Phase II single-arm biomarker trial. b) Schematic illustrating the design of a Phase III randomised-control biomarker trial. c) Schematic illustrating the design of a Phase III randomised-control enrichment biomarker trial.
Extended Data Fig. 6
Extended Data Fig. 6. Kaplan-Meier survival curves for the taxane biomarker.
Kaplan-Meier curves comparing time to treatment failure between patients receiving taxane therapy (Experimental arm) and those treated with other standard-of-care therapies (Control arm) across predicted resistant and sensitive subgroups in the emulated randomized controlled trials. Univariate p-values (p) were calculated using the log-rank test. a) Predicted resistant patients with relapsed ovarian cancer from the TCGA cohort. b) Predicted sensitive patients with relapsed ovarian cancer from the TCGA cohort. c) Predicted resistant patients with metastatic prostate cancer from the HMF cohort. d) Predicted sensitive patients with metastatic prostate cancer from the HMF cohort. e) Predicted sensitive patients with metastatic breast cancer from the HMF cohort. f) Predicted sensitive patients with metastatic breast cancer from the HMF cohort.
Extended Data Fig. 7
Extended Data Fig. 7. Kaplan-Meier survival curves for the anthracycline biomarker.
Kaplan-Meier curves comparing time to treatment failure between patients receiving taxane therapy (Experimental arm) and those treated with other standard-of-care therapies (Control arm) across predicted resistant and sensitive subgroups in the emulated randomized controlled trials. Univariate p-values (p) were calculated using the log-rank test. a) Predicted resistant patients with relapsed ovarian cancer from the TCGA cohort. b) Predicted sensitive patients with relapsed ovarian cancer from the TCGA cohort. c) Predicted resistant patients with metastatic breast cancer from the HMF cohort.

Similar articles

References

    1. Huang, R. & Zhou, P.-K. DNA damage repair: historical perspectives, mechanistic pathways and clinical translation for targeted cancer therapy. Signal. Transduct. Target. Ther.6, 254 (2021). - PMC - PubMed
    1. Kuderer, N. M., Desai, A., Lustberg, M. B. & Lyman, G. H. Mitigating acute chemotherapy-associated adverse events in patients with cancer. Nat. Rev. Clin. Oncol.19, 681–697 (2022). - PubMed
    1. Jørgensen, J. T. Companion and complementary diagnostics: clinical and regulatory perspectives. Trends Cancer2, 706–712 (2016). - PubMed
    1. Hunter, D. J., Khoury, M. J. & Drazen, J. M. Letting the genome out of the bottle—will we get our wish? N. Engl. J. Med.358, 105–107 (2008). - PubMed
    1. Simon, R. The use of genomics in clinical trial design. Clin. Cancer Res.14, 5984–5993 (2008). - PubMed

MeSH terms

LinkOut - more resources