Randomized Controlled Trial
. 2025 Jul;31(7):2255-2268.
doi: 10.1038/s41591-025-03724-5. Epub 2025 Jun 23.

An adaptive AI-based virtual reality sports system for adolescents with excess body weight: a randomized controlled trial

Jihong Wang #  1 Yiming Qin #  1   2   3   4   5 Qian Wu #  1   5   6 Dian Zeng #  7 Xiaojing Gao #  8 Qinyi Wang #  1   5   6 Zhen Li #  1 Yueqiong Ni #  1   6   9   10 Haoxuan Li #  11 Ping Zhang #  12   13 Jingyi Guo #  14 Weizhi Ma  15 Mamatkasim Maitusun  16 Xufeng Jin  17 Minghong Chen  18 Liping Zhu  17 Qin Lu  17 Qiandi Chen  18 Yuna Wu  17 Chengxiang Lin  18 Rui Han  1   6 Di Cheng  1   6 Jiacheng Ni  1   6 Xiaochun Wang  19 Fangshu Yao  19 Jie Zhuang  19 Jun Xia  11 Dan Liu  1   6 Yuwei Lu  1   6 Piao Kang  1   6 Shujie Yu  1   6 Anran Chen  1   6 Ying Zhang  1   6 Qian Li  1   6 Wenli Ge  1   6 Xiaoxue Long  1   6 Zehua Jiang  2   7 Zhouyu Guan  1   6 Zihao Jin  1 Pengfei Jin  20 Tingyao Li  1   4 Jia Shu  1   4 Jiale Yang  1   4 Jinyang Wang  11 Nan Jiang  21 Jing Qian  22 Younhyun Jung  23 Han Zhang  8   24 Qing Yang  24 Lifei Ma  1   6 Xiaomeng Wu  1   6 Xiaojun Huang  1   20 Dongyang Si  1 Jie Ren  19 Hui Qiao  25   26   27 Yuchen Guo  25   26   27 Zhifeng Huang  28 Wenxiao Wang  29 Weihong Deng  30 Lei Bi  31 Danyue Zhao  32 Yuehua Li  33 Rynson W H Lau  3 Yih-Chung Tham  34   35   36   37 Xindong Ma  38   39 Jing Ma  7 Dinggang Shen  8   24   40 Songhai Zhang  41 Haibing Guan  42 Weiwen Zou  43 Minyi Guo  42 Xinping Guan  44 Xiaokang Yang  45 Aimin Xu  46   47 Jiarui Wu  48 Gianni Panagiotou  9   10   47   49 Michael Andrew Tse  46   50 Jinman Kim  51 Enhua Wu  52 Daniel Thalmann  53 Nadia Magnenat Thalmann  54 Felipe Fregni  55 Tien Yin Wong  36   56   57   58   59 Weiping Jia  1   5   6 Rong Zeng  60   61 Chwee Teck Lim  62   63   64 Bin Sheng  65   66   67 Huating Li  68   69   70
Affiliations
Randomized Controlled Trial

An adaptive AI-based virtual reality sports system for adolescents with excess body weight: a randomized controlled trial

Jihong Wang et al. Nat Med. 2025 Jul.

Abstract

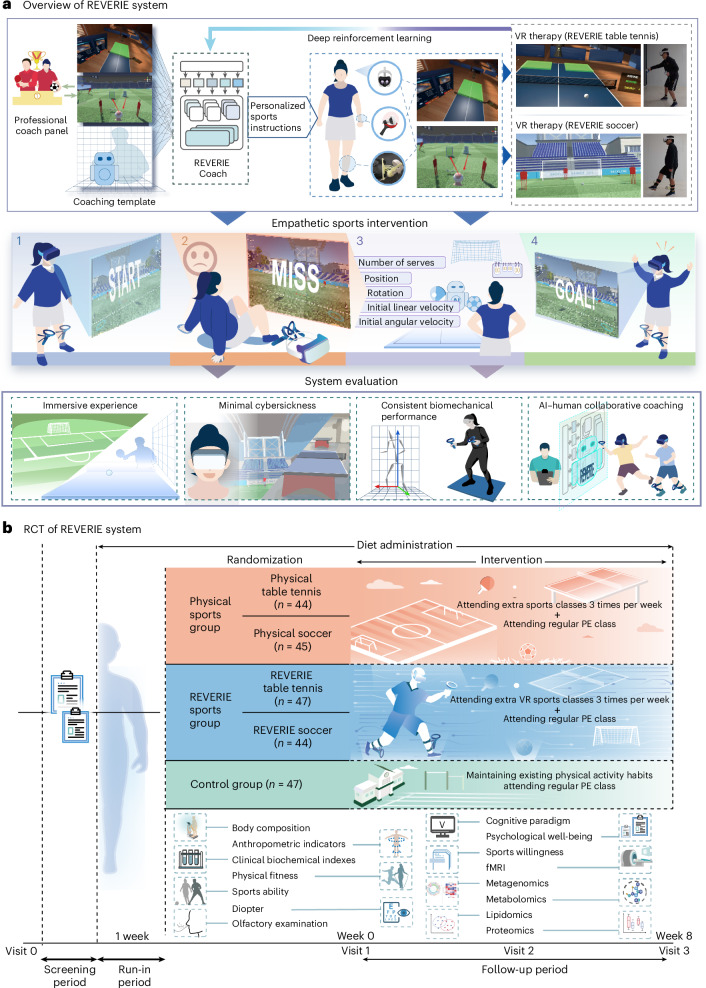
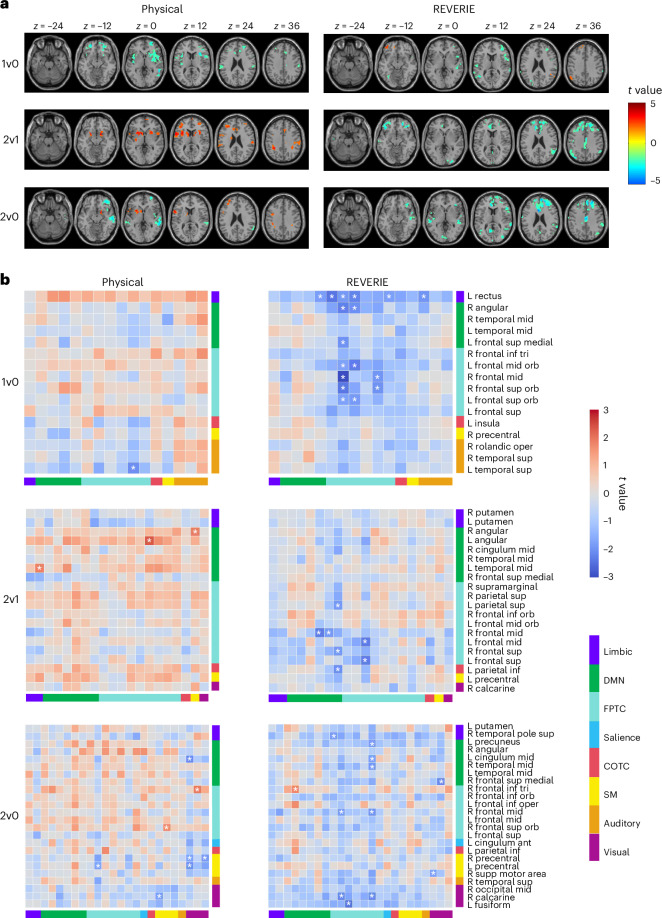
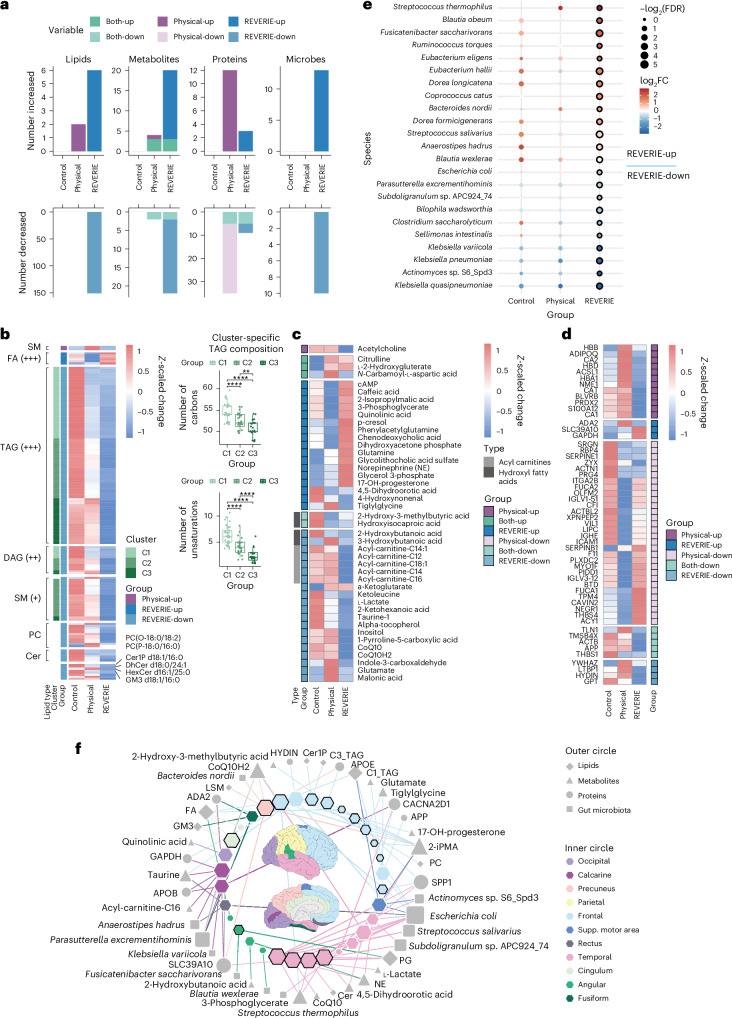
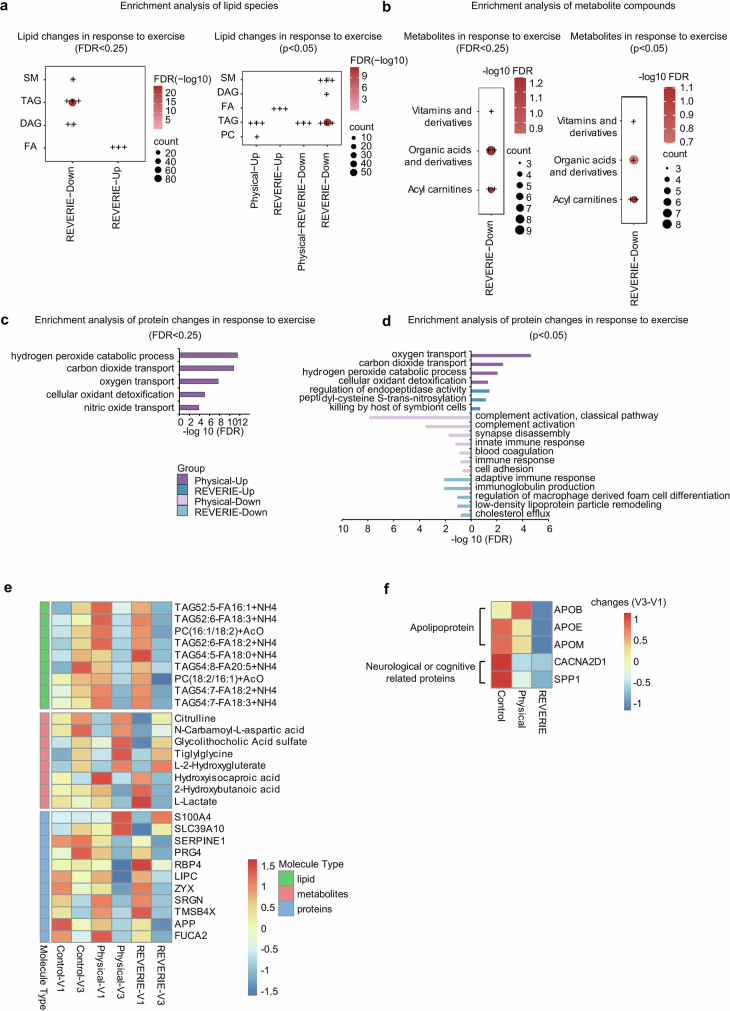
Adolescents with obesity face numerous health risks and encounter barriers that lead to physical inactivity. We developed a virtual reality sports system, named REVERIE (Real-World Exercise and VR-Based Exercise Research in Education), which used deep reinforcement learning to train transformer-based virtual coaching agents, offering immersive and effective sports guidance, with biomechanical performance comparable to real-world physical sports. We integrated REVERIE into a randomized controlled trial involving an 8-week intervention in adolescents with excess body weight (n = 227). Participants were randomized (1:1:1:1:1) to physical table tennis, physical soccer, REVERIE table tennis, REVERIE soccer or control. REVERIE sports intervention was effective in reducing primary outcome fat mass (mean -4.28 kg (95% confidence interval (CI) -6.35 to -2.22), relative to control), with no significant difference compared with physical sports (mean -5.06 kg (95% CI -7.13 to -2.98), relative to control). For secondary outcomes, decreases in liver enzymes and low-density lipoprotein cholesterol levels were found in physical and REVERIE sports groups compared to control. Physical and REVERIE sports showed improvements in physical fitness, psychological well-being and sports willingness after an 8-week intervention, which remained at the 6-month follow-up in the REVERIE sports group. REVERIE sports demonstrated superior cognitive enhancements compared to physical sports in exploratory analyses, as evidenced by olfactory tests (total score: mean 2.84 (95% CI 1.15 to 4.53)) and working memory paradigm (2-back accuracy: mean 10.88% (95% CI 1.19% to 20.56%)). Functional magnetic resonance imaging exhibited that REVERIE sports enhanced neural efficiency and neuroplasticity. Multi-omics analyses revealed distinct changes induced by REVERIE sports that were closely associated with cognitive improvement. Minimal injury rates were 7.69% for REVERIE and 13.48% for physical sports, with no serious adverse events. Collectively, this study demonstrates that the virtual reality sports therapy could provide an empathetic approach to addressing adolescent obesity, offering comprehensive improvements in physical, psychological and cognitive health beyond mere weight loss. Clinical Trial registration: ChiCTR2300068786 .


Conflict of interest statement

Competing interests: B.S., Huating Li, Y.Q., Q. Wu, Q. Wang and Haoxuan Li are inventors on a pending invention disclosure related to this work filed by Shanghai Sixth People’s Hospital and Shanghai Jiao Tong University (no. PCT/CN2025/071039, filed in January 2025). The other authors declare no competing interests.

Figures

Fig. 1
Fig. 1. CONSORT diagram.
Study flow diagram. CONSORT, Consolidated Standards of Reporting Trials.
Fig. 2
Fig. 2. Overview of REVERIE system development and evaluation.
a, Schematic of REVERIE system development and system evaluation. Professional coaches provide feedback to build the VR sports environment and coach templates. A transformer-based virtual coaching agent, REVERIE Coach, is trained to guide adolescents. Participants engage in table tennis or soccer using VR equipment and sport-specific controllers, performing guided motions with REVERIE Coach instruction. AI–human interactions during VR therapy are used to adaptively optimize REVERIE Coach through deep reinforcement learning. This strategy addresses challenges of participants during VR sports interventions, enabling empathetic sports interventions. System evaluations demonstrate that the REVERIE system delivers an immersive VR sports experience with minimal cybersickness, biomechanical performance comparable to real-world sports and an AI–human collaborative coaching tool. b, Design of the RCT. In this RCT, 227 adolescents with excess body weight were randomly allocated into the physical sports group, the REVERIE sports group or the control group. Both sports groups contained two sport types including table tennis and soccer. The effects of interventions were assessed in terms of metabolic, physical, psychological and cognitive outcomes. Meanwhile, fMRI and multi-omics analyses (including metagenomics, metabolomics, lipidomics and proteomics) were conducted.
Fig. 3
Fig. 3. Brain activation and functional connectivity under working memory tasks by fMRI.
a, Activation differences in brain regions in physical and REVERIE sports groups after an 8-week intervention (post-intervention versus pre-intervention conditions), represented by t-values from two-tailed paired Student’s t-tests. Results with cluster size ≥ 20 voxels and P < 0.05 are shown. b, t-statistics of each ROI pair for each PPI variable within each sports group at different task loads, before and after intervention. The y axis represents seed regions, and the x axis represents target regions. Under each task condition, the brain regions along the horizontal and vertical axes are the same, and the ordering is symmetrical along the diagonal from the top left to the bottom right. t-statistics were analyzed using a two-tailed paired Student’s t-test. Significant differences are indicated by white asterisks (*P < 0.05). Red signifies positive t-values, reflecting increased functional connectivity after intervention, while blue signifies negative t-values, reflecting decreased functional connectivity after intervention. n = 43 in physical sports group; n = 40 in REVERIE sports group. L, left; R, right; sup, superior; mid, middle; inf, inferior; ant, anterior; supp, supplementary; tri, triangular; orb, orbital; oper, opercular; COTC, cerebellar–occipital task control; SM, somatomotor.
Fig. 4
Fig. 4. Changes in multi-omics signatures in response to physical and REVERIE sports interventions.
a, Significant multi-omics changes in response to interventions. Two-tailed paired statistical tests were calculated for each group and divided different changes into six modes (FDR < 0.25). ‘Both-up’ indicates significant increase after both sports interventions. bd, Heat maps representing changes (V3–V1) before and after the interventions in the lipidome (b), metabolome (c) and proteome (d). Two lipid subclasses (TAGs and DAGs) were further divided into three clusters based on the degree of changes (P = 0.002 for the difference in aliphatic chains of TAGs between cluster 2 and cluster 3). Box plots in b show the median (centerlines), lower/upper quartiles (box limits) and whiskers (the last data points 1.5 times the IQR from the lower or upper quartiles). Comparisons between different TAG subclusters were performed using two-tailed one-way ANOVA followed by a Fisher’s LSD post hoc test. e, Bubble chart of significant changes before and after the intervention in microbial species. In bd, the colors of the six change modes are the same as those in a. The enrichment analysis of lipid/small metabolite classes and biological processes of proteins is shown in Extended Data Fig. 7a–d, and the FDR of the enrichment analysis is displayed in parentheses to the right of lipid class. f, Correlation network between changed multi-omics signatures and specific brain regions evaluated by fMRI. Node size represents the number of linked edges. The colors of ROI nodes and edges represent the areas that the (linked) ROIs belong to. ROI nodes with black borders indicate significant correlation with cognitive indicators. Lipid signatures are summed into categories. In ae, a two-tailed paired Student’s t-test (proteome) or a Wilcoxon signed-rank test (lipidome, metabolome and metagenome) was used to assess the significant changes after each intervention. **P < 0.01, ****P < 0.0001; +FDR < 0.25, ++FDR < 0.1, +++FDR < 0.05. The proportion of differential signatures and the proportion of differential molecules in each enriched class/pathway are shown in Supplementary Table 9. Abbreviations of multi-omics molecules are shown in Supplementary Table 13. PC, phosphatidylcholine; LSM. lysosphingomyelin; ADA2, adenosine deaminase 2; GAPDH, glyceraldehyde-3-phosphate dehydrogenase; APOB, apolipoprotein B; NE, norepinephrine; PG, phosphatidylglycerol; 2-iPMA, 2-isopropylmalic acid. Source data
Extended Data Fig. 1
Extended Data Fig. 1. Schematic overview of the template-driven and feedback-oriented deep reinforcement learning method in REVERIE-Agent Module.
In the digital twin stage, the REVERIE Coach based on the transformer network, is trained in VR sports environment conditioned on pre-set coaching templates to master standardised instructions of sports techniques. In the AI-human interaction stage, the REVERIE Coach is fine-tuned based on feedback from REVERIE Coach-adolescent interactions to develop personalised instructions of sports techniques tailored to each adolescent. Upon completion of the two-stage, we obtain REVERIE Coach capable of delivering empathetic sports guidance to each adolescent.
Extended Data Fig. 2
Extended Data Fig. 2. Evaluation of REVERIE system.
REVERIE table tennis (a) and soccer (b). (c) Compared success probability curves among REVERIE system, general and goal-based DRL methods on table tennis and soccer. (d) Ablation study results of REVERIE system and REVERIE system without coaching templates on table tennis and soccer. In (c) and (d), the curves display the median values with shaded areas showing the upper and lower boundaries. (e) Factor scores for control, sensory, distraction, and realism compare Eleven Table Tennis with REVERIE table tennis, and Football Nation VR with REVERIE soccer. (f-g) Total Simulator Sickness Questionnaire (SSQ) scores of the REVERIE system versus a version without the Rendering Module for table tennis (f, p = 0.047) and soccer (g, p = 0.035). (h) %HRmax curves of participants in REVERIE table tennis and soccer. (i) Borg Rating of Perceived Exertion (RPE) scores of participants after REVERIE table tennis and soccer. In (eg) and (i), black dots represent individual data points (n = 40), the box boundaries indicate the first and third quartiles, the thick black line is the median, and the thin black line marks the whisker bounds. Two-sided unpaired (e) and paired (f-g) Student’s t test were used. (j-k) The magnitude of the ball’s initial linear velocity under varying accelerometer outputs in both Physical and REVERIE table tennis (j) and soccer (k). (l-m) Participant movements (depicted as skeletons) and forces (red and blue arrows) are shown for forehand attack and backhand push instructions in Physical and REVERIE table tennis. These images capture the end of the forehand backswing, the moment of impact, the end of the backhand backswing, and its impact. (n-o) Participant movements and forces under heading and shooting instructions are depicted for Physical and REVERIE soccer. Red arrows show ground reaction forces on force platforms and blue arrows show forces applied to the participants’ bodies. For (j-k), multiple linear regression analysed the ball’s initial velocity (dependent variable) with accelerometer output and group number (independent variables); the P value indicates the interaction between output and group. DRL, Deep reinforcement learning. P < 0.05*, P < 0.001***. Source data
Extended Data Fig. 3
Extended Data Fig. 3. Effects of Physical and REVERIE sports interventions on metabolic-related outcomes.
(a) Average heart rate (HR) and (b) average exercise intensity during intervention sports classes (n = 51 in Physical; n = 79 in REVERIE). (c) The attendance that participants adhered to exercise classes (n = 85 in Physical; n = 80 in REVERIE). (d) The days that participants adhered to dietary recommendation (n = 46 in control; n = 85 in Physical; n = 80 in REVERIE). Effects of interventions on (e) fat mass, (f) body weight, (g) fat-free mass (FFM) percentage, (h) alanine aminotransferase (ALT), (i) gamma-glutamyl transferase (GGT), (j) total cholesterol (TC), (k) triglycerides (TG) and (l) low-density lipoprotein cholesterol (LDL-C). In a-c, unpaired Student’s t test was performed to compare the differences between Physical and REVERIE sports groups. In d, one-way ANOVA with Fisher’s LSD post hoc was performed to analyse differences among groups. (e-l) n = 47 in control; n = 89 in Physical; n = 91 in REVERIE. Paired Student’s t test was performed to verify changes from baseline (intragroup changes). A capped line with † indicates a significant intragroup difference (P < 0.05 †, P < 0.01 ††, P < 0.001 †††). Intragroup P values were 0.002 (body weight in REVERIE), 0.004 (GGT in REVERIE), 0.001 (TC in Physical), 0.007 (TG in REVERIE), and 0.003/0.001 (LDL-C in Physical/REVERIE). Intergroup changes were compared by ANCOVA (or a linear mixed model) adjusted for baseline, followed by Fisher’s LSD. A bar marked with * indicates significance of vs. control (P < 0.05 *, P < 0.01 **, P < 0.001 ***). P values were 0.004 (body weight, REVERIE-control), 0.003 (GGT, REVERIE-control), 0.005 (TC, REVERIE-control), 0.012 (TG, REVERIE-control), and 0.015/0.001 (LDL-C in Physical/REVERIE-control). A line with # under the groups indicates significance between Physical and REVERIE sports group (P < 0.05 #, P < 0.01 ##); p values were 0.036 (TC) and 0.008 (TG). Data are shown as box-and-whisker plots (median, quartiles, 5th-95th percentiles, and outliers as points). All P values are two-sided and not adjusted for multiple testing.
Extended Data Fig. 4
Extended Data Fig. 4. Changes in physical fitness, psychological status, body weight, BMI, sports willingness outcomes between baseline and 6-month follow-up.
Changes in physical fitness including sit and reach (a), 30 sec sit-to-stand test (b), standing long jump (c), 1 min rope skipping (d); psychological outcomes including GSES (e), RSES (f), WHO-5 (g), PSQI (h), Overall eating (i), Restrained eating (j), Emotional eating (k), External eating (l); body weight (m) and BMI (n) at 6-month follow-up among different groups. Overall eating and three subscales including Emotional eating, External eating and Restrained eating were assessed using Dutch Eating Behaviour Questionnaire. In a-n, Differences were assessed using linear mixed model adjusted for baseline values. (o) Sports willingness changes between baseline and 6-month follow-up. Differences were assessed using generalized linear mixed model adjusted for baseline values. P values are two-sided and not adjusted for multiple testing. For a, n = 46 in control; n = 87 in Physical; n = 87 in REVERIE. For b, n = 41 in control; n = 85 in Physical; n = 82 in REVERIE. For c, n = 45 in control; n = 88 in Physical; n = 87 in REVERIE. For d, n = 40 in control; n = 86 in Physical; n = 86 in REVERIE. For e-l and o, n = 45 in control; n = 85 in Physical; n = 85 in REVERIE. For m and n, n = 42 in control; n = 79 in Physical; n = 81 in REVERIE. GESE: General Self-Efficacy Scale; RSES: Rosenberg Self-Esteem Scale; PSQI: Pittsburgh Sleep Quality Index; WHO-5: the five-item World Health Organization Well-Being Index; BMI: body mass index.
Extended Data Fig. 5
Extended Data Fig. 5. Effects of Physical and REVERIE sports interventions on cognition-related outcomes.
(a) Schematic diagram of olfactory test. Change in (b) threshold score, (c) discrimination score, (d) identification score, (e) overall threshold-discrimination-identification score (TDI score) of olfactory tests. (f) Schematic diagram of behavioural experiments. For b-e, n = 35 in control; n = 52 in Physical; n = 48 in REVERIE. Change in (g) accuracy of 2-back task, (h-j) reaction time of 0-, 1- and 2-back task of behavioural experiments. For g-j, n = 23 in control; n = 43 in Physical; n = 40 in REVERIE. Data are shown as box-and-whisker plots. Box plot, median and quartiles; whiskers, 5th and the 95th percentiles. Points represent values outside the 5%-95% range. Two-sided paired Student’s t test was performed to verify changes from baseline (intragroup changes). When the difference is significant, a capped line is marked above the group concerned with the †. P < 0.05 †, P < 0.01 ††, P < 0.001 †††. Intragroup P values were 0.005 (identification score in REVERIE), 0.001, 0.009, 0.008 (reaction time of 0, 1, 2 back in Physical), 0.046 and 0.042 (reaction time of 0-back and 1back in REVERIE). The comparison of differential values among the three groups (intergroup changes) were performed using two-sided ANCOVA followed by a Fisher’s LSD post hoc test, with baseline levels serving as covariates. When the test is significant, a line is marked above the concerned groups with the *. P < 0.05 *, P < 0.01 **, P < 0.001 ***. P values were 0.010 (identification score, REVERIE-Physical), 0.001 (2-back accuracy, REVERIE-Physical), 0.002/0.041 (0-back reaction time, Physical/REVERIE-control), 0.003/0.008 (1-back reaction time, Physical/REVERIE-control), 0.013 (2-back reaction time, Physical-control).
Extended Data Fig. 6
Extended Data Fig. 6. Multi-omic remodelling after Physical and REVERIE sports interventions.
(a) Comparison of the overall changes (V3-V1) before and after sports interventions in lipidome (left), metabolome (middle) and proteome (right) among three intervention groups using partial least squares-discriminant analysis (PLS-DA). The axes represent the first two components (latent variables that maximize the separation among groups). (b) The overlap of multi-omic changes after each intervention using two-tailed paired Student’s t test or Wilcoxon signed-rank test (P < 0.05). The numbers in the bubbles indicate the number of changed circulating molecules in three intervention groups. Comparison of microbiota (c) alpha (Shannon index and Simpson index) and (d) beta diversity (weighted UniFrac distance). Control, n = 26; Physical, n = 52; REVERIE, n = 48. (e) Microbial species with significantly changed abundances after 8-week intervention (P < 0.05, two-tailed Wilcoxon signed-rank test). V1, visit 1 or baseline; V3, visit 3 or after 8-week intervention. Boxplots in c show median (centerlines), lower/upper quartiles (box limits), and whiskers (the last data points 1.5 times the interquartile range (IQR) from the lower or upper quartiles).
Extended Data Fig. 7
Extended Data Fig. 7. Enrichment analysis of differential plasma molecules in response to Physical and REVERIE sports interventions.
(a-b) Enrichment analysis of significantly changed (a) lipids or (b) metabolites after sports interventions using different confidence levels (two-tailed wilcoxon signed-rank test, FDR < 0.25 on the left and P < 0.05 on the right). (c-d) Enrichment of biological functions for significantly changed proteins in response to interventions using different confidence levels (two-tailed paired Student’s t test, FDR < 0.25 in c, P < 0.05 in d). (e) Some significantly changed circulating molecules after 8-week Physical and REVERIE sports (two-tailed paired Student’s t test or Wilcoxon signed-rank test, P < 0.05). (f) Heatmap of changes (V3-V1) in lipoproteins and neurological- or cognitive-related proteins after each intervention. These proteins have been reported to be related to cognition and showed significantly changed after REVERIE sports (two-tailed paired Student’s t test, P < 0.05), which were further used in subsequent correlation analysis with cognitive indicators. FDR < 0.25 + , FDR < 0.1 + + , FDR < 0.05 + + + . SM, sphingomyelin; TAG, triacylglycerol; DAG, diacylglycerol; FA, fatty acids; PC, phosphatidylcholine. V1, visit 1 or baseline; V3, visit 3 or after 8-week intervention. Abbreviations of multi-omics molecules are shown in Supplementary Table 13.
Extended Data Fig. 8
Extended Data Fig. 8. Correlations between changes in multi-omic signatures and the alterations in indicators related to metabolic, physical and psychological health.
Chord diagram displaying the interconnectivity (Spearman’s correlation, P < 0.05) among significant changes in multi-omic signatures and changes in metabolic (a, b), physical fitness indicators (c, d), and mental health and sports willingness indicators (e, f) in response to Physical (a, c, e) and REVERIE sports (b, d, f). Detailed results are shown in Supplementary Table 10 and 11. Link colours in red and blue represent positive and negative correlations, respectively. BMI, body mass index; FM, fat mass; FMP, fat mass percentage; WHtR, waist-to-height ratio; ALT, alanine transaminase; AST, aspartate transaminase; GGT, gamma-glutamyl transferase; UA, urea acid; TC, total cholesterol; TG, triglycerides; LDL-C, low-density lipoprotein cholesterol; GESE, the General Self-Efficacy Scale; RSES, Rosenberg Self-Esteem Scale; PSQI, Pittsburgh Sleep Quality Index; WHO-5, the five-item World Health Organization Well-Being Index. Overall eating and three subscales including Emotional eating, External eating and Restrained eating were assessed using Dutch Eating Behaviour Questionnaire. Abbreviations of multi-omics molecules are shown in Supplementary Table 13.
Extended Data Fig. 9
Extended Data Fig. 9. Correlation between changes in multi-omic signatures and the alterations in indicators related to cognitive function.
(a-b) Chord diagram showing the interconnectivity (Spearman’s correlation, P < 0.05) among significant changes in multi-omic signatures and changes in cognitive indicators after Physical (a) or REVERIE (b) sports intervention. Link colours in red and blue represent positive and negative correlations, respectively. (c) Crosstalk among brain cognitive function, circulating molecules, and gut microbiota. Links were based on Spearman’s correlations (P < 0.05) between circulating molecules and intestinal bacteria (brown), between circulating molecules themselves (blue), as well as between multi-omic signatures and brain indicators (brain activation in regions of interest and cognitive indicators) (red). The correlations between different signatures were preserved when they were both closely related to neural activities and cognitive indicators. Detailed results are shown in Supplementary Table 10-12. Node size represents the number of correlated multi-omic signatures. Node shape indicates data type. Reported lipoproteins and neurological- or cognitive-related proteins, which showed significant changes after REVERIE sports (two-tailed paired Student’s t test, P < 0.05), were also used in subsequent correlation analysis with cognitive indicators. RT, reaction time; ACC, accuracy; TDI score, overall threshold-discrimination-identification score of olfactory tests; Supp, supplementary. Abbreviations of multi-omics molecules are shown in Supplementary Table 13.
Extended Data Fig. 10
Extended Data Fig. 10. Deployment evaluation of REVERIE system.
(a) The satisfaction, standardisation, accessibility and empathy of the REVERIE system were evaluated by 170 participants. (b) The deployment evaluation was assessed by 16 coaches in the REVERIE sports group. (c) The sports abilities of participants in Physical and REVERIE sports groups were evaluated by independent coaches at baseline and after 8-week intervention. The data were analysed using a two-sided chi-square test. A, B, C, D: the different levels of sports ability, where A represents the best, and D represents the worst.

References

    1. Jebeile, H., Kelly, A. S., O’Malley, G. & Baur, L. A. Obesity in children and adolescents: epidemiology, causes, assessment, and management. Lancet Diabetes Endocrinol.10, 351–365 (2022). - PMC - PubMed
    1. Hannon, T. S. & Arslanian, S. A. Obesity in adolescents. N. Engl. J. Med.389, 251–261 (2023). - PubMed
    1. Laurent, J. S. et al. Associations among body mass index, cortical thickness, and executive function in children. JAMA Pediatr.174, 170–177 (2020). - PMC - PubMed
    1. Zeng, Q., Li, N., Pan, X. F., Chen, L. & Pan, A. Clinical management and treatment of obesity in China. Lancet Diabetes Endocrinol.9, 393–405 (2021). - PubMed
    1. Stankov, I., Olds, T. & Cargo, M. Overweight and obese adolescents: what turns them off physical activity? Int. J. Behav. Nutr. Phys. Act.9, 53 (2012). - PMC - PubMed

Publication types

LinkOut - more resources