

Prognostic and clinicopathological value of fibrinogen-to-albumin ratio in patients with esophageal cancer: a meta-analysis
- PMID: 40551119
- PMCID: PMC12183830
- DOI: 10.1186/s12957-025-03886-z
Prognostic and clinicopathological value of fibrinogen-to-albumin ratio in patients with esophageal cancer: a meta-analysis
Abstract
Background: Fibrinogen-to-albumin ratio (FAR) has been widely examined for its prognostic value in esophageal cancer (EC), although findings across studies have been inconsistent. This meta-analysis aimed to assess the predictive role of FAR in EC.
Methods: A comprehensive search was conducted across Web of Science, Embase, PubMed, and Cochrane Library. The prognostic value of FAR in EC was assessed by pooling hazard ratios (HRs) and 95% confidence intervals (CIs). Additionally, the correlation between FAR and clinicopathological features of EC was evaluated using pooled odds ratios (ORs) and 95%CIs.
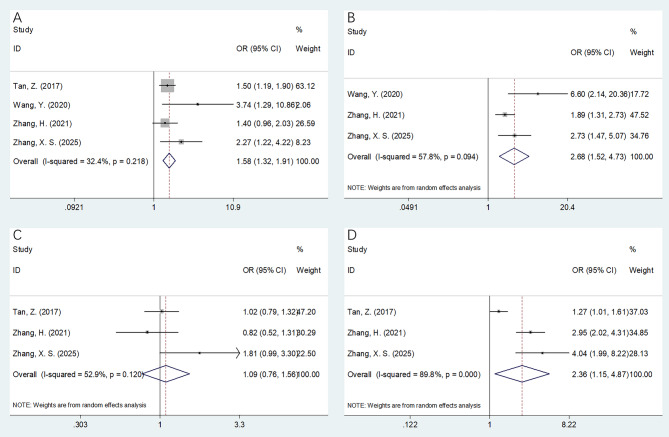
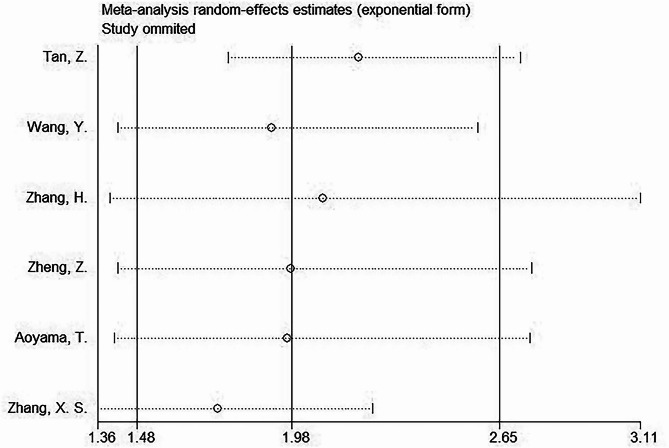
Results: A total of six studies involving 2,616 patients were included. The analysis revealed that a high FAR was significantly associated with poor overall survival (OS) in EC (HR = 1.98, 95%CI = 1.48-2.65, p < 0.001). Furthermore, elevated FAR correlated significantly with male sex (OR = 1.38, 95%CI = 1.09-1.74, p = 0.007), T3-T4 stages (OR = 2.36, 95%CI = 1.93-2.87, p < 0.001), N1-N3 stages (OR = 1.58, 95%CI = 1.32-1.91, p < 0.001), TNM III-IV stages (OR = 2.68, 95%CI = 1.52-4.73, p = 0.001), and tumor length > 3 cm (OR = 2.36, 95%CI = 1.15-4.87, p = 0.020). However, FAR showed no significant association with age (OR = 0.87, 95%CI = 0.48-1.60, p = 0.660), tumor location (OR = 0.98, 95%CI = 0.77-1.25, p = 0.886), or tumor differentiation (OR = 1.09, 95%CI = 0.76-1.56, p = 0.634).
Conclusion: This meta-analysis highlights that an elevated FAR is a strong prognostic indicator of poor OS in patients with EC. Moreover, high FAR is significantly associated with clinical features indicative of tumor progression and metastasis.
Keywords: Biomarker; Esophageal cancer; Evidence-based medicine; Fibrinogen-to-albumin ratio; Meta-analysis.
© 2025. The Author(s).
Conflict of interest statement
Declarations. Ethics approval and consent to participate: Not applicable. Consent for publication: Not applicable. Competing interests: The authors declare no competing interests. Conflict of interest: The authors declare that there is no conflict of interest. Supplemental files: Supplemental file 1 The PRISMA checklist. Supplemental file 2 The detailed search strategies for each database.
Figures


Similar articles
-
Prognostic and clinicopathological value of fibrinogen-to-albumin ratio in colorectal cancer: a meta-analysis.Ann Med. 2025 Dec;57(1):2530689. doi: 10.1080/07853890.2025.2530689. Epub 2025 Jul 11. Ann Med. 2025. PMID: 40650392 Free PMC article.
-
Prognostic impact of the red cell distribution width in esophageal cancer patients: A systematic review and meta-analysis.World J Gastroenterol. 2018 May 21;24(19):2120-2129. doi: 10.3748/wjg.v24.i19.2120. World J Gastroenterol. 2018. PMID: 29785080 Free PMC article.
-
Prognostic and clinicopathological significance of circulating tumor cells detected by RT-PCR in non-metastatic colorectal cancer: a meta-analysis and systematic review.BMC Cancer. 2017 Nov 7;17(1):725. doi: 10.1186/s12885-017-3704-8. BMC Cancer. 2017. PMID: 29115932 Free PMC article.
-
Impact of residual disease as a prognostic factor for survival in women with advanced epithelial ovarian cancer after primary surgery.Cochrane Database Syst Rev. 2022 Sep 26;9(9):CD015048. doi: 10.1002/14651858.CD015048.pub2. Cochrane Database Syst Rev. 2022. PMID: 36161421 Free PMC article.
-
Prognostic role of fibrinogen-to-albumin ratio in patients with gynecological cancers: a meta-analysis.Front Oncol. 2025 Jul 3;15:1580940. doi: 10.3389/fonc.2025.1580940. eCollection 2025. Front Oncol. 2025. PMID: 40678069 Free PMC article.
References
-
- Bray F, Laversanne M, Sung H, Ferlay J, Siegel RL, Soerjomataram I, Jemal A. Global cancer statistics 2022: GLOBOCAN estimates of incidence and mortality worldwide for 36 cancers in 185 countries. Cancer J Clin. 2024;74(3):229–63. - PubMed
Publication types
MeSH terms
Substances
LinkOut - more resources
Full Text Sources
Medical
