. 2025 Jun 23;27(1):112.
doi: 10.1186/s13058-025-02065-y.

In vivo imaging of the spatial heterogeneity of intratumoral acidosis (pH) as a marker of the metastatic phenotype in breast cancer

Affiliations

In vivo imaging of the spatial heterogeneity of intratumoral acidosis (pH) as a marker of the metastatic phenotype in breast cancer

Alessia Corrado et al. Breast Cancer Res. .

Abstract

Background: Metabolic alterations, including acidosis in the tumor microenvironment, have been extensively linked to more aggressive phenotypes and increased therapy resistance. However, current imaging techniques are limited in their ability to capture extracellular tumor acidosis precisely and assess spatial heterogeneity in vivo, making its association with augmented malignancy poorly understood. In this study, we investigated whether Magnetic Resonance Imaging- Chemical Exchange Saturation Transfer (MRI-CEST) technique for tumor pH imaging of intratumoral acidosis could differentiate between metastatic and non-metastatic breast cancers.

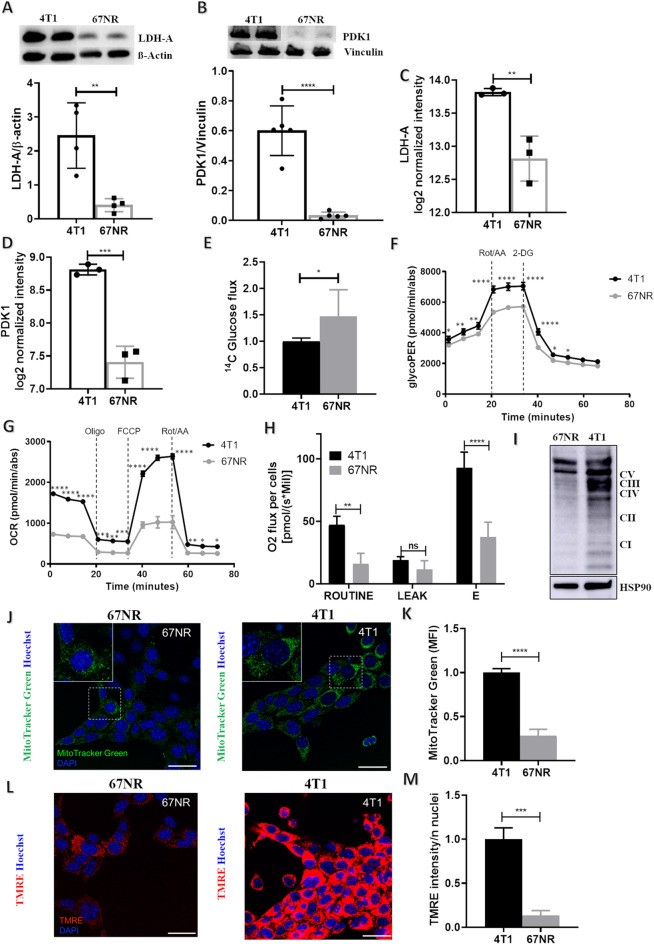
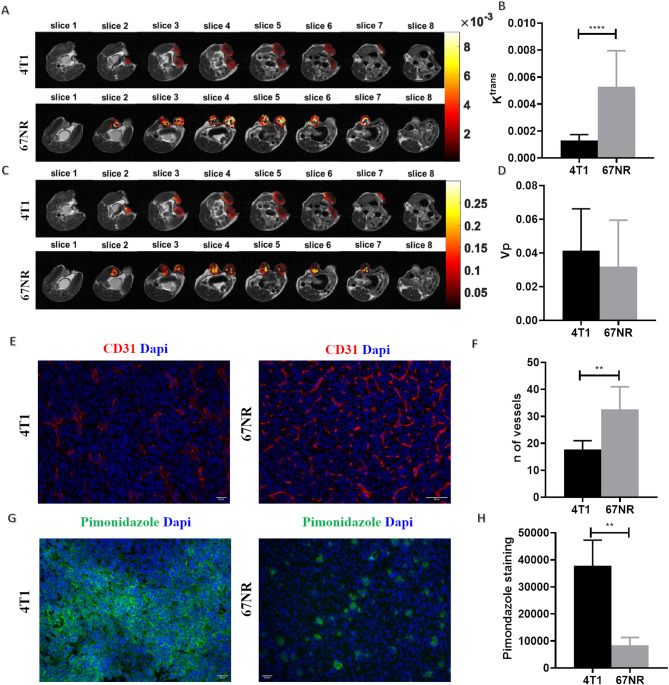
Methods: Isogenic metastatic (4T1) and non-metastatic (67NR) breast cancer cell lines were characterized for their metabolic and acidosis features, including LDH-A/PDK-1 expression, glucose consumption, extracellular acidification rate (ECAR) and oxygen consumption rate (OCR). Potential relationship between tumor acidosis, vascularization and hypoxia with metastatic potential was assessed in vivo by MRI-based imaging approaches in orthotopic breast tumors. Validation of MRI findings was assessed ex vivo by western blot, immunohistochemistry and immunofluorescence assays for a multiparametric characterization of tumor microenvironment and metabolic properties.

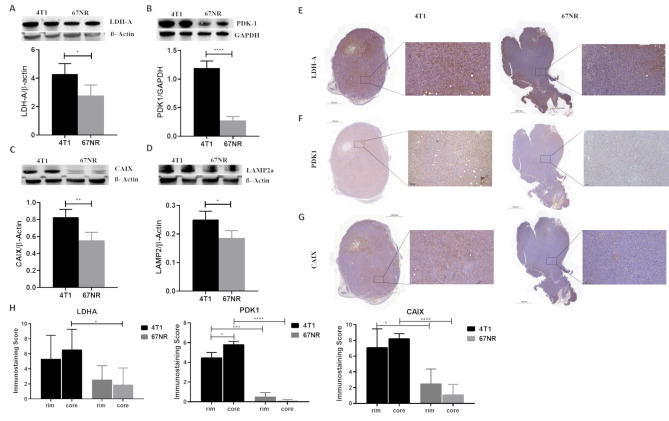
Results: We observed a higher energetic profile of the 4T1 cells compared to the 67NR cells, alongside elevated glycolytic (LDH-A, PDK-1), hypoxia (CAIX, Pimonidazole), and vascularization (CD31) markers in 4T1 orthotopic primary tumors, which were associated with a greater metastatic propensity. MRI-CEST tumor pH imaging revealed increased extracellular tumor acidity in 4T1 tumors, along with marked spatial intratumoral heterogeneity, in contrast to the more homogenous 67NR tumors, as further confirmed by LAMP-2 staining. Notably, this spatial intratumor heterogeneity in acidosis enables clear differentiation between high- and low-malignancy tumors.

Conclusions: These findings underscore the role of tumor acidosis and its spatial heterogeneity in promoting aggressive phenotypes and highlight the potential of in vivo tumor pH imaging as a marker of malignancy in breast cancers.

Keywords: Breast cancer; Chemical exchange saturation transfer (CEST); Imaging; MRI; Metastatic potential; Tumor acidosis; Tumor metabolism.


Conflict of interest statement

Declarations. Ethics approval and consent to participate: Animal manipulation and experimental procedures were carried out in accordance with the European Community guidelines (directive 2010/63) and under the approval of the Italian Ministry of Health (authorization #741/2022). Consent for publication: Not applicable. Competing interests: The authors declare no competing interests.

Figures

Fig. 1
Fig. 1
In cellulo characterization of energy metabolism in 4T1 and 67NR cells. A, B) Protein quantification of (A) LDHA and (B) PDK1 assessed by western blotting. C, D) Gene expression levels of (C) LDH-A and (D) PDK1, n = 3 biological replicates. (E) 14C-glucose uptake measured in 67NR and 4T1 cells. The relative upload capacity is shown using metastatic cells as the comparator. Data represent means ± SEMs. n = 3 biological replicates in at least technical triplicate. Student’s t-test. F) Seahorse XFe96 glycolytic rate assay performed in 4T1 and 67NR cells subjected to serial injections of the respiratory complex I inhibitor rotenone together with the respiratory complex III inhibitor antimycin A (Rot/AA, 0.5 µM) and 2-deoxyglucose (2-DG, 50 µM). The glycolytic proton efflux rate (glycoPER) was calculated in real-time. Data represent means ± SEMs and are normalized on protein content. n = 3 biological replicates in at least either duplicate or technical triplicate. Two-way ANOVA, Tukey’s correction. G) Seahorse XFe96 Mito Stress Test performed in 4T1 and 67NR cells in the presence of standard condition (full medium). The oxygen consumption rate (OCR) was calculated in real-time after the administration of the ATP synthase inhibitor oligomycin (Olygo, 1.5 µM), the proton uncoupler carbonyl cyanide p-triflouromethoxyphenylhydrazone (FCCP, 1 µM), and a mixture of rotenone and antimycin A (Rot/AA, 0.5 µM). Data represent means ± SEMs and are normalized on protein content. n = 3 biological replicates in at least either duplicate or technical triplicate. Two-way ANOVA, Tukey’s correction. H) TNBC cells subjected to high-resolution respirometry analysis by Oroboros-O2K instrument. Bar chart graphs of basal oxygen consumption (ROUTINE), proton leak (LEAK), and maximal oxygen consumption (E) values subtracted from residual oxygen consumption (ROX) in 4T1 and 67NR cells are shown. Data represent means ± SEMs. n = 3 biological replicates. Student’s t-test. I) Western blot analysis for the electron transport chain (ETC) complexes (CI-V, total OXPHOS). J, K) TNBC cells subjected to confocal (J) and cytofluorimetric (K) analyses. Representative pictures of MitoTracker green-stained cells are shown (green: mitochondria; blue: Hoechst, nuclei). The data represent means ± SEMs. n = 3 biological replicates. Student’s t-test. L, M) 4T1 and 67NR cells were subjected to TMRE staining by confocal microscopy. Representative images are shown (L, red: active mitochondria; blue: Hoechst, nuclei). The TMRE intensity was quantified as described in the Methods section. Data represent the means ± SEMs. n = 3 biological replicates. Student’s t-test (M). * P ≤ 0.05; ** P ≤ 0.01; *** P ≤ 0.001; **** P ≤ 0.0001
Fig. 2
Fig. 2
Imaging results from CEST-MRI. (A) Iopamidol extracellular pH maps of representative patients, reporting more acidic pHe values (orange and yellow pixels) in 4T1 tumors (top) and less acidic pHe values (more green pixels) in 67NR tumors (bottom). Bar graphs of (B) pHe values of 4T1 and 67NR tumors. (C) Correlation between tumor volume and pHe calculated via CEST-pH imaging. (D) Correlation between pHe and different tumor volumes (small < 220 mm3 and medium > 220 mm3). The data represent means ± SDs. (E) Bar graph of TGR of 4T1 and 67NR tumors. (F) Correlation between tumor pHe calculated via CEST pH imaging and TGR. (G) ROC curve comparisons for distinguishing between metastatic and non-metastatic tumors in terms of tumor pHe. (H) Immunofluorescence staining of LAMP2 (n = 4 biological replicates). (I) Quantification of the positive fluorescent area in 4T1 and 67NR tumor samples. The data represent the means ± SDs. ** P ≤ 0.01; *** P ≤ 0.001
Fig. 3
Fig. 3
In vivo and ex vivo characterization of tumor heterogeneity. (A) Bar graph of the acidity score as a metric of pHe heterogeneity. (B) ROC curve comparison of the acidity score for distinguishing between metastatic and non-metastatic tumors. (C) Bar graph of acidity score values with different tumor volumes (small < 220 mm3 and medium > 220 mm3). Bar graphs of (D) tumor pHe and (E) acidity score value distribution in 4T1 and 67NR tumors according to subregion analysis of the rim and core regions. (F) IHC analysis of LAMP2 expression and distribution of signals through rim and core regions in 4T1 and 67NR representative patients (n = 4 biological replicates). The data represent the means ± SDs. * P ≤ 0.05; ** P ≤ 0.01; *** P ≤ 0.001
Fig. 4
Fig. 4
DCE-MRI results of tumor vessel permeability and perfusion and ex vivo characterization of the tumor microenvironment. (A) Ktrans (permeability) parametric maps of representative patients (4T1 top, 67NR bottom). (B) Bar graph of Ktrans values. (C) vp (plasma volume fraction) parametric maps of representative patients (4T1 top, 67NR bottom). (D) Bar graph of vp. (E) Immunofluorescence staining of CD31 and (F) the number of vessels resulting from the MVD count of the 4T1 and 67NR tumor samples. (G) Pimonidazole staining and (H) quantification of the positive fluorescent area in 4T1 and 67NR tumor samples. The data represent the mean ± SDs (n = 4 biological replicates). ** P ≤ 0.01; **** P ≤ 0.0001
Fig. 5
Fig. 5
Ex vivo metabolic characterization of tumor specimens. Western blot analyses and protein quantification of (A) LDH-A, (B) PDK1, (C) CAIX, and (D) LAMP2. Immunohistochemistry of (E) LDH-A, (F) PDK1, and (G) CAIX in 4T1 and 67NR (left and right, respectively) specimens. (H) Semiquantitative analysis of the immunohistochemistry sections reporting the immunostaining score for LDH-A, PDK1 and CAIX calculated in the rim and in the core regions of the 4T1 and 67NR tumors. The data represent the mean ± SDs. * P ≤ 0.05; ** P ≤ 0.01; **** P ≤ 0.0001

References

    1. Siegel RL, Miller KD, Fuchs HE, Jemal A. Cancer statistics, 2022. CA Cancer J Clin. 2022;72(1):7–33. - PubMed
    1. Wang Z, Jiang Q, Dong C. Metabolic reprogramming in triple-negative breast cancer. Cancer Biol Med. 2020;17(1):44–59. - PMC - PubMed
    1. Fang JS, Gillies RD, Gatenby RA. Adaptation to hypoxia and acidosis in carcinogenesis and tumor progression. Semin Cancer Biol. 2008;18(5):330–7. - PMC - PubMed
    1. Pillai SR, Damaghi M, Marunaka Y, Spugnini EP, Fais S, Gillies RJ. Causes, consequences, and therapy of tumors acidosis. Cancer Metastasis Rev. 2019;38(1–2):205–22. - PMC - PubMed
    1. Cappellesso F, Mazzone M, Virga F. Acid affairs in anti-tumour immunity. Cancer Cell Int. 2024;24(1):354. - PMC - PubMed

Substances

LinkOut - more resources