

Analysis of the nonlinear relationships between insulin resistance indicators such as LAP and TyG and depression, and population characteristics: a cross-sectional study
- PMID: 40551244
- PMCID: PMC12183857
- DOI: 10.1186/s40001-025-02802-1
Analysis of the nonlinear relationships between insulin resistance indicators such as LAP and TyG and depression, and population characteristics: a cross-sectional study
Abstract
Background: Accumulating evidence indicates a potential link between insulin resistance (IR) and depression, although the bidirectional nature and underlying mechanisms of this association remain poorly understood. This study aims to systematically investigate the associations between multiple IR indices-specifically the Homeostatic Model Assessment of Insulin Resistance (HOMA-IR), Lipid Accumulation Product (LAP), and Triglyceride-Glucose indice (TyG)-and the prevalence of depression.
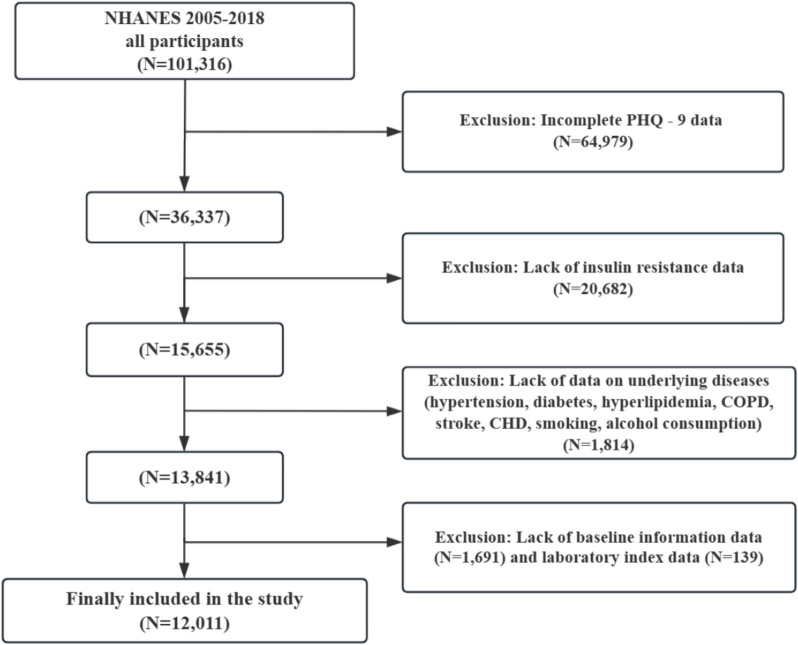
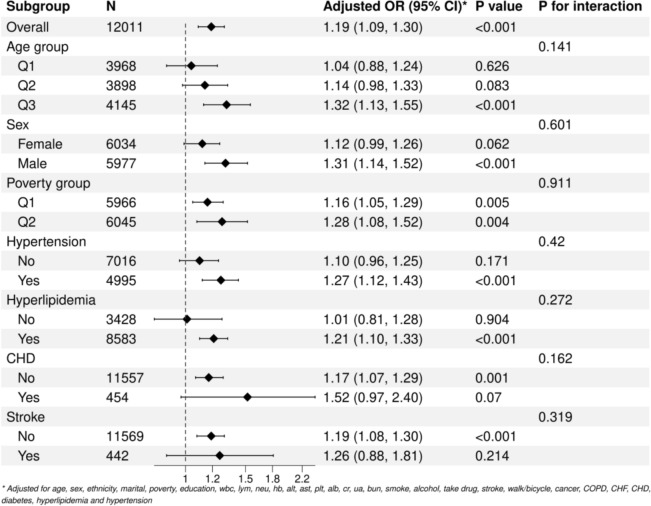
Methods: Data from 12,011 participants in the National Health and Nutrition Examination Survey (NHANES) were analyzed. IR was quantified using three indices: HOMA-IR, LAP, and TyG. Baseline demographic and clinical characteristics were compared between participants with and without depression following stratification by depression status. Weighted multivariate logistic regression models were employed to evaluate the associations between IR indices (categorized into quartiles) and depression. Nonlinear relationships were explored using threshold effect analysis, restricted cubic spline (RCS) models, and smooth curve fitting. Subgroup analyses were performed to assess heterogeneity by age, gender, poverty level, and comorbidities (e.g., cardiovascular disease, hypertension).
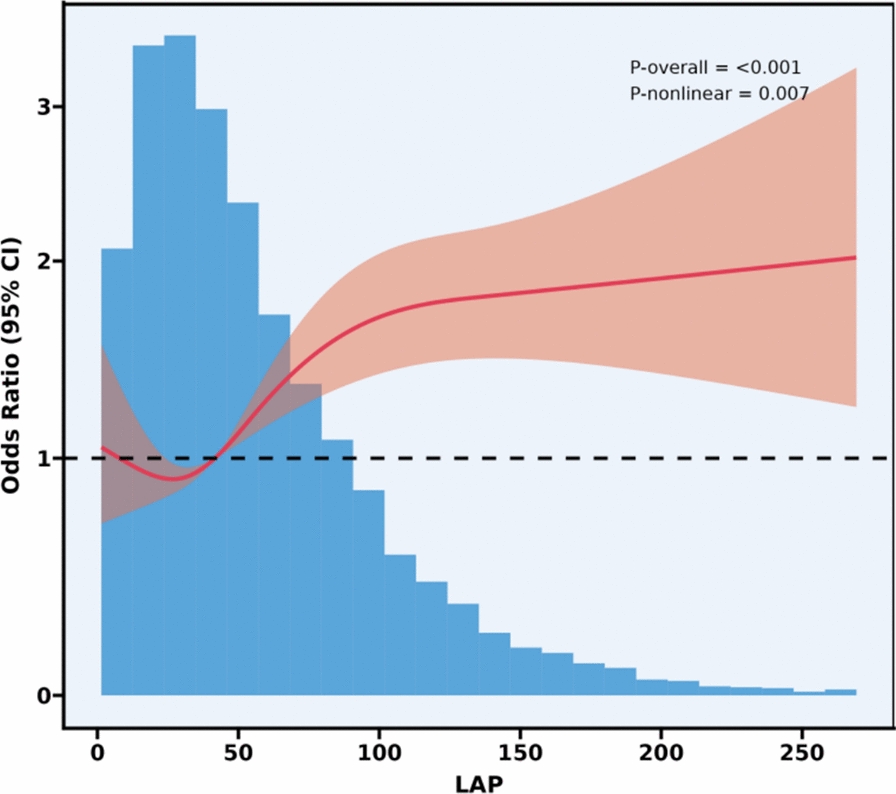
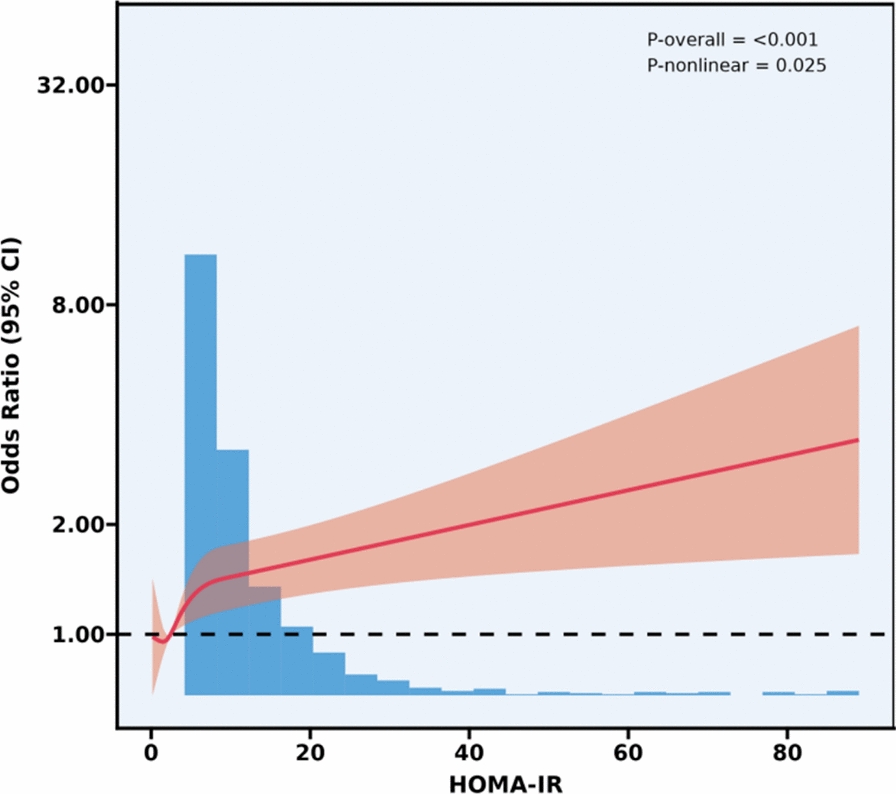
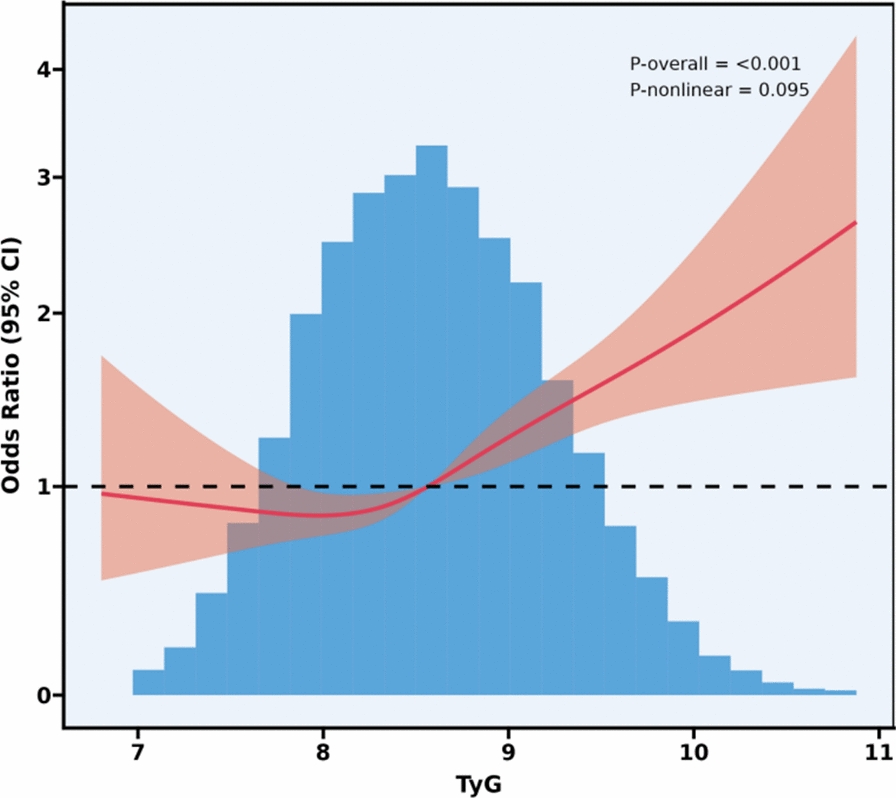
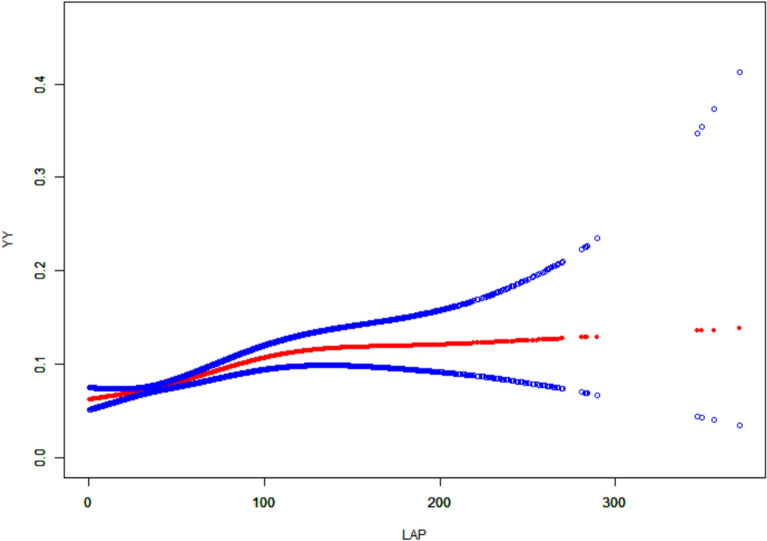
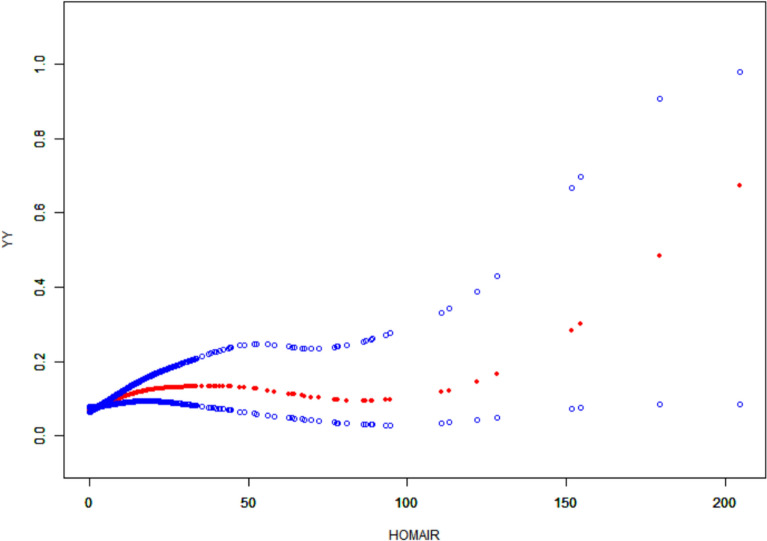
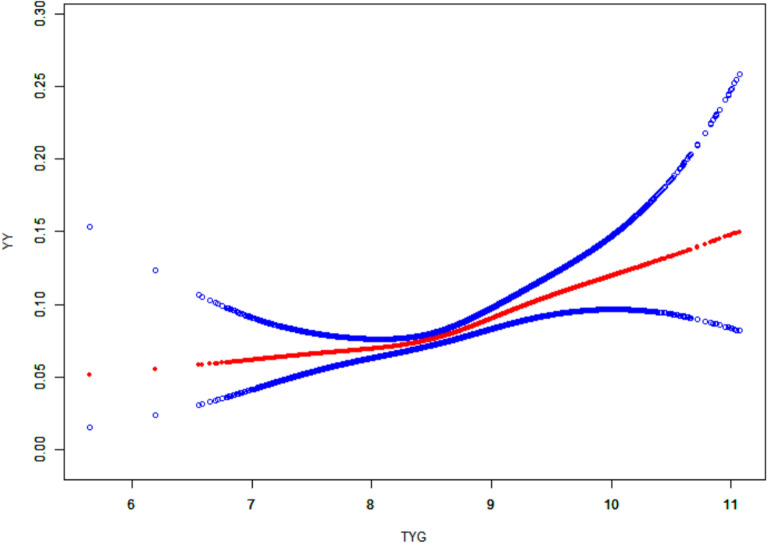
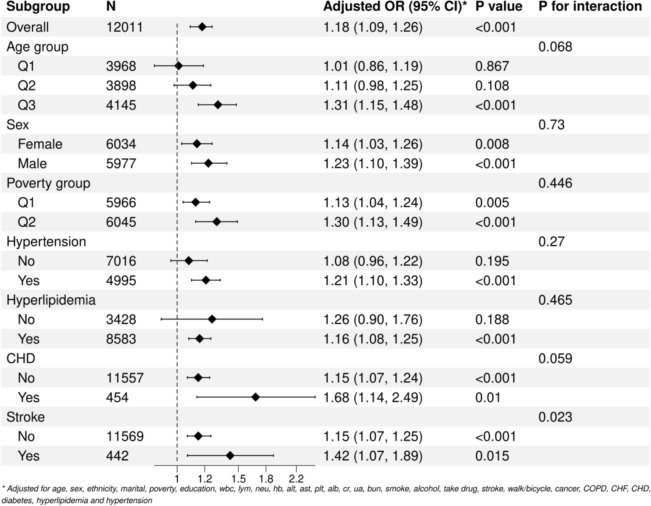
Results: The depressed group (n = 971) exhibited significantly higher IR indices compared to the non-depressed group (n = 11,040). In the fully adjusted model (Model 3), both LAP (Q4 vs. Q1: OR = 1.569, 95% CI 1.234-1.998) and TyG (Q4 vs. Q1: OR = 1.497, 95% CI 1.182-1.896) were significantly associated with depression, whereas the association for HOMA-IR was attenuated (Q4 vs. Q1: OR = 1.310, p = 0.099). Threshold effect analysis revealed a nonlinear "inverted L-shaped" relationship between HOMA-IR, LAP, and depression, with effect modification observed at specific indice thresholds. Subgroup analyses demonstrated stronger associations in males (LAP: OR = 1.23, p < 0.01; TyG: OR = 1.31, p < 0.05), individuals with coronary heart disease (LAP: OR = 1.68, p < 0.001), and stroke survivors (LAP: OR = 1.42, p = 0.023 for interaction).
Conclusions: This study provides robust evidence of significant associations between IR indices (LAP and TyG) and depression, with a notable nonlinear "inverted L-shaped" relationship observed for LAP. Subgroup analyses highlighted stronger correlations in older adults (≥ 59 years), patients with coronary heart disease, stroke survivors, males, and individuals with hypertension. These findings enhance our understanding of the metabolic pathways underlying depression and emphasize the importance of integrating IR indices into mental health risk assessments. The results also offer a theoretical basis for personalized interventions targeting metabolic abnormalities in depression prevention and treatment.
Keywords: Depression; Insulin resistance; NHANES; Nonlinear association; Threshold effect.
© 2025. The Author(s).
Conflict of interest statement
Declarations. Ethics approval and consent to participate: Data collection for the NHANES was approved by the NCHS Research Ethics Review Board (ERB). An individual investigator utilizing the publicly available NHANES data do not need to file the institution internal review board (IRB). Consent for publication: Not applicable. Competing interests: The authors declare no competing interests.
Figures
References
MeSH terms
Substances
Grants and funding
- J2019Y01/Hefei Science and Technology Bureau "Borrow, Transfer and Supplement" Project (J2019Y01)
- J2019Y01/Hefei Science and Technology Bureau "Borrow, Transfer and Supplement" Project (J2019Y01)
- J2019Y01/Hefei Science and Technology Bureau "Borrow, Transfer and Supplement" Project (J2019Y01)
- J2019Y01/Hefei Science and Technology Bureau "Borrow, Transfer and Supplement" Project (J2019Y01)
- J2019Y01/Hefei Science and Technology Bureau "Borrow, Transfer and Supplement" Project (J2019Y01)
- J2019Y01/Hefei Science and Technology Bureau "Borrow, Transfer and Supplement" Project (J2019Y01)
- GJ2022SM07/Hefei Key Common Technology R&D"Projects (GJ2022SM07)
- GJ2022SM07/Hefei Key Common Technology R&D"Projects (GJ2022SM07)
- GJ2022SM07/Hefei Key Common Technology R&D"Projects (GJ2022SM07)
- GJ2022SM07/Hefei Key Common Technology R&D"Projects (GJ2022SM07)
- 2024ykc012/The Hospital - level Scientific Research Fund Project of Hefei Second People's Hospital" Project (2024ykc012)
- 2024ykc012/The Hospital - level Scientific Research Fund Project of Hefei Second People's Hospital" Project (2024ykc012)
- 2024ykc012/The Hospital - level Scientific Research Fund Project of Hefei Second People's Hospital" Project (2024ykc012)
- 2024ykc012/The Hospital - level Scientific Research Fund Project of Hefei Second People's Hospital" Project (2024ykc012)
LinkOut - more resources
Full Text Sources
Medical
Research Materials
