Prevotella stercorea increases fat deposition in Jinhua pigs fed alfalfa grass-based diets
- PMID: 40551275
- PMCID: PMC12186324
- DOI: 10.1186/s40104-025-01217-6
Prevotella stercorea increases fat deposition in Jinhua pigs fed alfalfa grass-based diets
Abstract
Background: Fat is a key component of body composition in both humans and animals, with intramuscular fat (IMF) being a critical determinant of pork quality. Higher IMF level enhances meat qualities such as flavor, tenderness, and juiciness, directly influencing consumer preference and market demand. Therefore, identifying microbial biomarkers associated with fat deposition is essential for improving meat quality in livestock and understanding how gut microbiota regulates host metabolism.
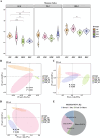
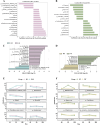
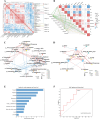
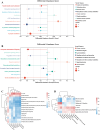
Results: In this study, we examined changes in meat quality, fat metabolism, and gut microbiota during the pig life cycle, from weaning to marketing. We found that Jinhua pig exhibited higher IMF content and marbling score, and higher α diversity of colonic microbial communities. Microbiome Multivariate Association with Linear Models was used to identify the core genera associated with age, breed, and feed, and Prevotella was found to respond to both age and breed factors. The correlation analysis of fat deposition indicators with microbial genera revealed that Prevotella was a potential biomarker in response to IMF. In addition, the P. stercorea DSM 18206 (P. stercorea) was identified in porcine sample and administered to pseudo sterile mouse to examine the effect on IMF deposition. We found that the gavage of P. stercorea with alfalfa-enriched diet led to a significant increase in triglyceride (TG) and IMF contents in muscle. Metabolomic analysis further confirmed P. stercorea may potentially regulate fat deposition through the sphingolipid signaling pathway.
Conclusions: We identified P. stercorea as a potential biomarker linked to higher IMF deposition and validated their role in shaping the gut microbiota and promoting fat accumulation in a mouse model, which correlated with the sphingolipid signaling pathway. These findings provide valuable insights into the role of P. stercorea in regulating fat deposition and metabolic health, offering implications for improving both livestock meat quality and lipid metabolism in humans.
Keywords: Prevotella; Intramuscular fat; Jinhua pig; Microbiome.
© 2025. The Author(s).
Conflict of interest statement
Declarations. Ethics approval and consent to participate: All animal procedures such as ethical and animal welfare issues were approved by the Committee on Animal Care and Use and Committee on the Ethics of Animal Experiments of Zhejiang University (approval number: ZJU20001). Consent for publication: Not applicable. Competing interests: The authors declare that they have no known competing financial interests or personal relationships that could have appeared to influence the work reported in this paper.
Figures


Similar articles
-
Alternative polyadenylation landscape of longissimus dorsi muscle with high and low intramuscular fat content in cattle.J Anim Sci. 2024 Jan 3;102:skae357. doi: 10.1093/jas/skae357. J Anim Sci. 2024. PMID: 39565284
-
Research advances in intramuscular fat deposition and chicken meat quality: genetics and nutrition.J Anim Sci Biotechnol. 2025 Jul 16;16(1):100. doi: 10.1186/s40104-025-01234-5. J Anim Sci Biotechnol. 2025. PMID: 40665461 Free PMC article. Review.
-
Signs and symptoms to determine if a patient presenting in primary care or hospital outpatient settings has COVID-19.Cochrane Database Syst Rev. 2022 May 20;5(5):CD013665. doi: 10.1002/14651858.CD013665.pub3. Cochrane Database Syst Rev. 2022. PMID: 35593186 Free PMC article.
-
Transcriptome analysis reveals key genes and regulatory networks underlying intramuscular fat deposition in rabbits.BMC Genomics. 2025 Aug 28;26(1):785. doi: 10.1186/s12864-025-11950-x. BMC Genomics. 2025. PMID: 40877790 Free PMC article.
-
Integrating Gut Microbiome and Metabolomics with Magnetic Resonance Enterography to Advance Bowel Damage Prediction in Crohn's Disease.J Inflamm Res. 2025 Jun 11;18:7631-7649. doi: 10.2147/JIR.S524671. eCollection 2025. J Inflamm Res. 2025. PMID: 40535353 Free PMC article.
References
-
- Xie L, Qin J, Rao L, Tang X, Cui D, Chen L, et al. Accurate prediction and genome-wide association analysis of digital intramuscular fat content in longissimus muscle of pigs. Anim Genet. 2021;52(5):633–44. 10.1111/age.13121. - PubMed
-
- Kucha CT, Liu L, Ngadi M, Gariépy C. Anisotropic effect on the predictability of intramuscular fat content in pork by hyperspectral imaging and chemometrics. Meat Sci. 2021;176:108458. 10.1016/j.meatsci.2021.108458. - PubMed
-
- Cani PD, Van Hul M. Gut microbiota in overweight and obesity: crosstalk with adipose tissue. Nat Rev Gastroenterol Hepatol. 2024;21(3):164–83. 10.1038/s41575-023-00867-z. - PubMed
Grants and funding
LinkOut - more resources
Full Text Sources
Miscellaneous

