

Effect of Air Pollution Reductions on Mortality During the COVID-19 Lockdowns in Early 2020
- PMID: 40551404
- PMCID: PMC12185919
Effect of Air Pollution Reductions on Mortality During the COVID-19 Lockdowns in Early 2020
Abstract
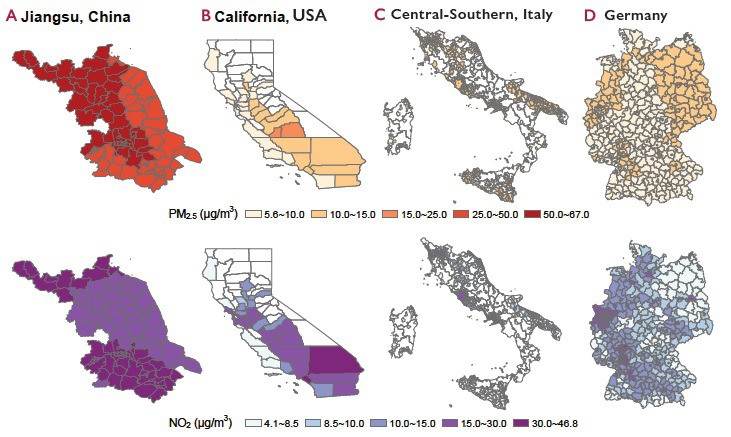
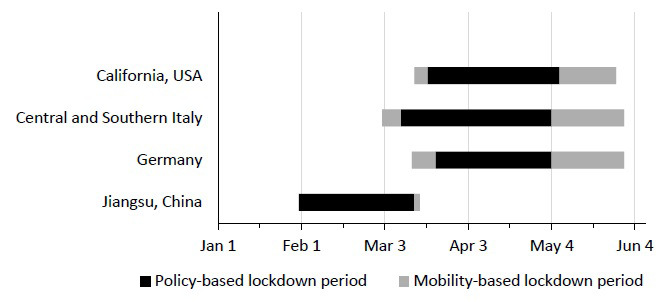
Introduction: COVID-19 lockdowns led to considerable reductions in air pollutant emissions worldwide, providing a unique opportunity to examine the impacts of reduced air pollution on mortality. This project aimed to quantify changes in nitrogen dioxide (NO2) and fine particulate matter (PM2.5) concentrations due to COVID-19 lockdowns, estimate associations between short-term exposures to these air pollutants and mortality rates, and calculate the attributable changes in mortality in four regions that implemented lockdowns but were mildly affected by the pandemic in early 2020, including Jiangsu Province, China; California, USA; Central and Southern Italy; and Germany.
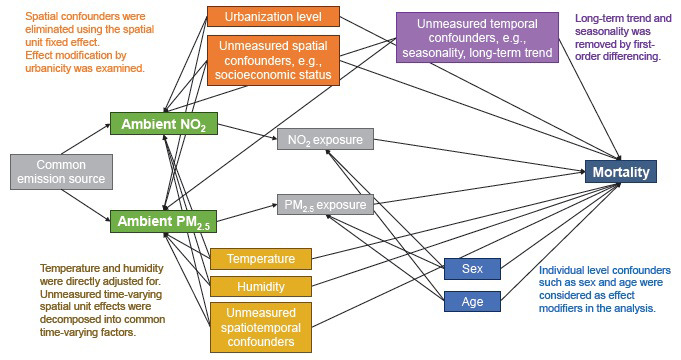
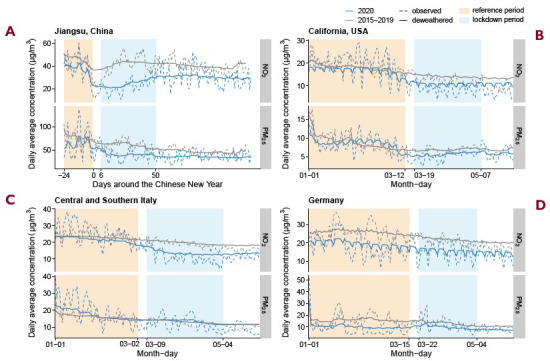
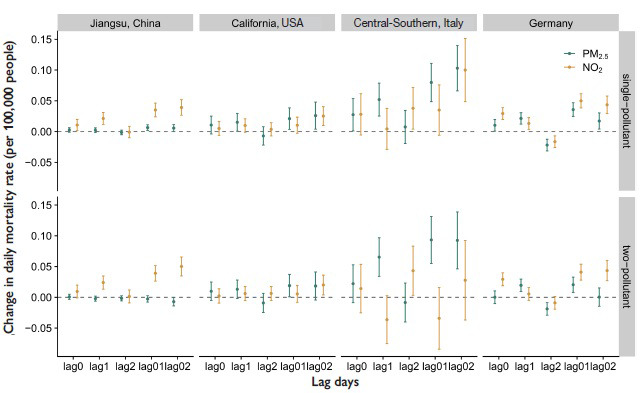
Methods: To account for meteorological impacts and air pollution time trends, we used a machine learning-based meteorological normalization technique and the difference-in-differences approach to quantify changes in NO2 and PM2.5 concentrations due to lockdowns in early 2020. Using daily air pollution and mortality data from 2015 to 2019, we applied interactive fixed effects models (a causal modeling approach) to estimate associations between day-to-day changes in PM2.5 and NO2 concentrations and all-cause, natural-cause, and cardiovascular mortality rates before the pandemic in each region. Finally, using the quantified air pollution changes and the estimated air pollution-mortality relationships, we calculated the changes in mortality that were attributable to air pollution changes due to the lockdowns.
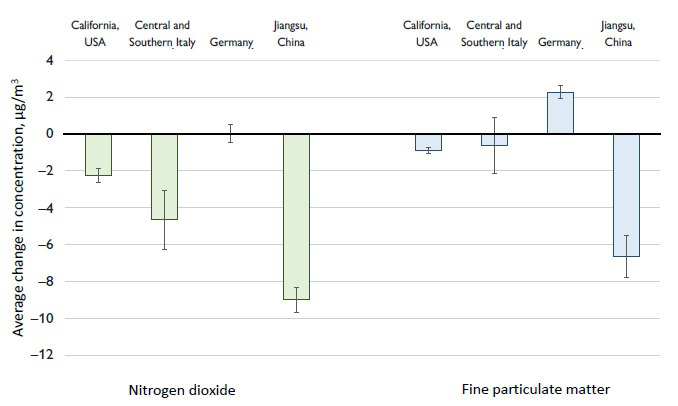
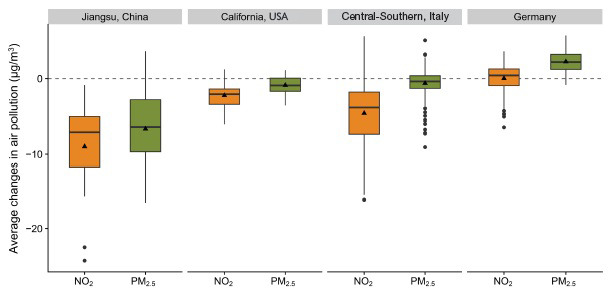
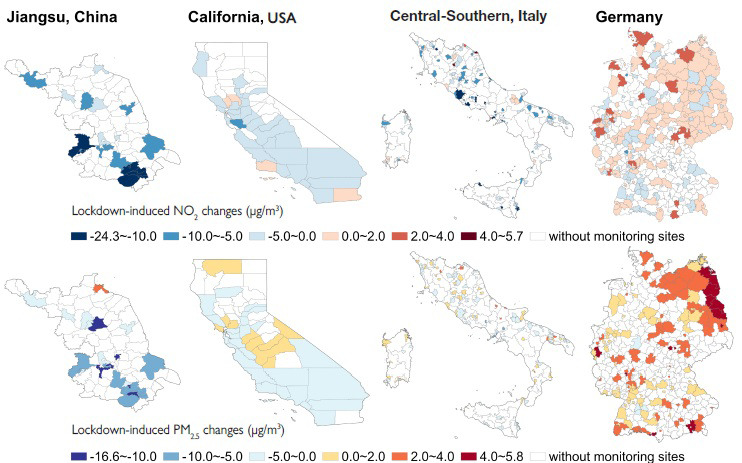
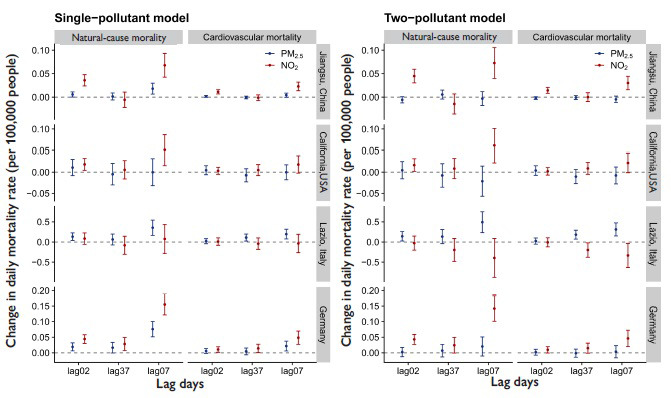
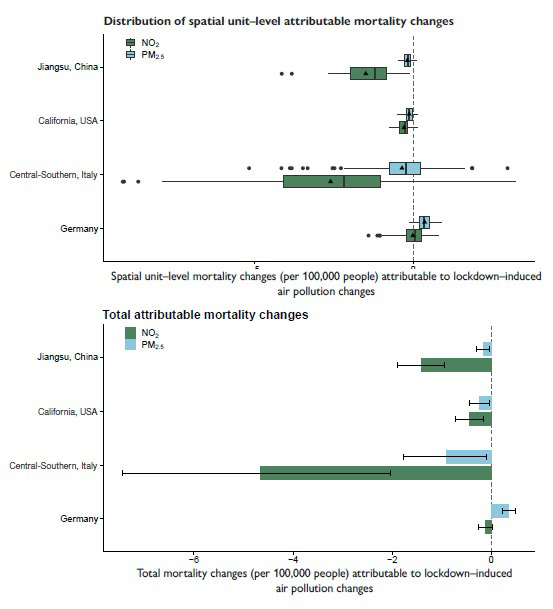
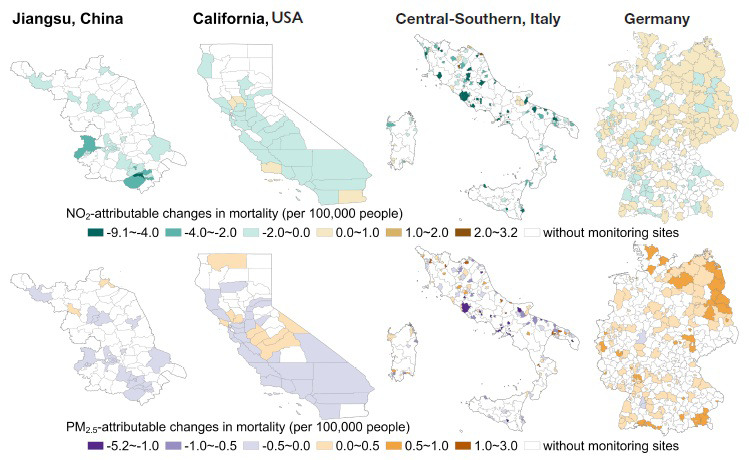
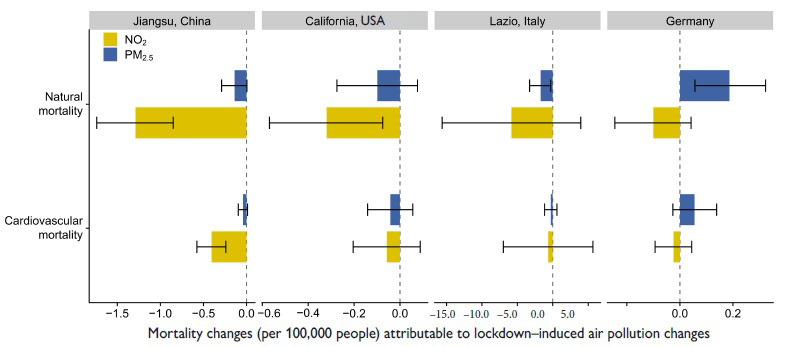
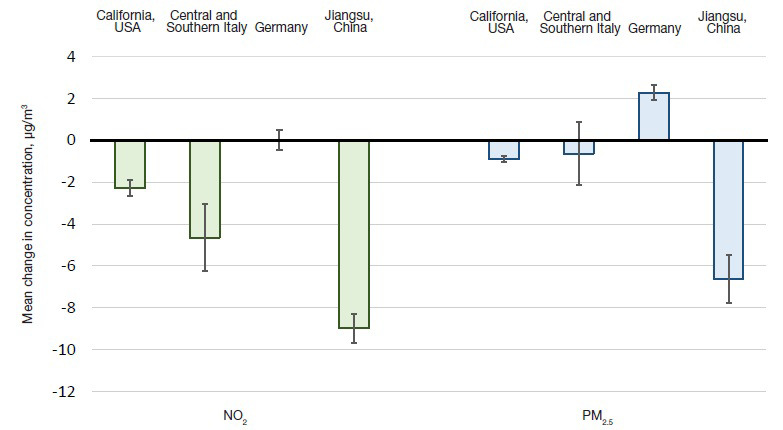
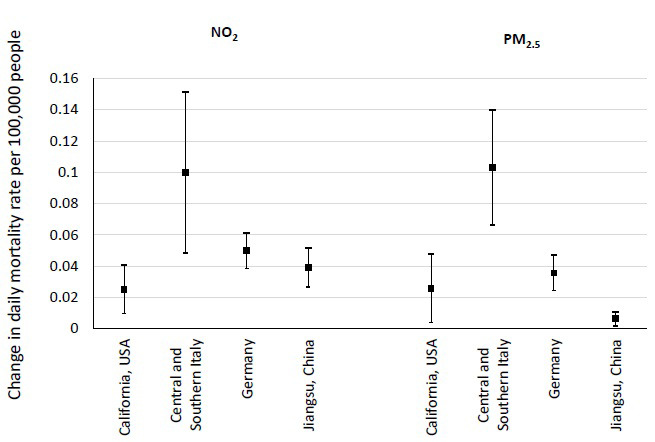
Results: We found that meaningful improvements in air quality occurred during the lockdowns in early 2020 in Jiangsu, China; California, USA; and Central and Southern Italy, with smaller magnitudes of reduction in PM2.5 compared to NO2. We observed no significant reduction in NO2 and a small increase in PM2.5 in Germany. After controlling for unmeasured spatial and temporal confounders, we detected statistically significant associations between short-term increases in PM2.5 and NO2 concentrations and increases in daily all-cause, natural-cause, and cardiovascular mortality rates in all four study regions from 2015 to 2019. Specifically, we determined that lockdown-induced reductions in NO2 resulted in avoiding 1.41 (95% empirical confidence interval [eCI]: 0.94-1.88), 0.44 (95% eCI: 0.17-0.71), and 4.66 (95% eCI: 2.03-7.44) deaths per 100,000 people in Jiangsu, China; California, USA; and Central and Southern Italy, respectively. Mortality benefits attributable to PM2.5 reductions in these regions also were statistically significant, albeit of a smaller magnitude, and resulted in avoiding 0.16 (95% eCI: 0.04-0.29), 0.23 (95% eCI: 0.03-0.43), and 0.91 (95% eCI: 0.09-1.78) deaths per 100,000 people in Jiangsu, China; California, USA; and Central and Southern Italy, respectively. In Germany, the mortality benefits attributable to NO2 changes were not statistically significant (mortality change of -0.11; 95% eCI: -0.25 to 0.03 deaths per 100,000 people), and an observed increase in PM2.5 was associated with an increase in mortality of 0.35 (95% eCI: 0.22-0.48) deaths per 100,000 people during the lockdown.
Conclusions: Using a causal modeling approach, this study contributes to the growing body of evidence that short-term exposures to PM2.5 and NO2 are associated with increased all-cause and cause-specific mortality rates. In areas mildly affected by the COVID-19 pandemic, lockdowns in early 2020 generally improved air quality and led to health benefits, especially in association with NO2 reductions, with notable heterogeneity across regions. This study underscores the importance of accounting for local characteristics when policymakers adapt successful emission control strategies from other regions.
© 2025 Health Effects Institute. All rights reserved.
Figures

Similar articles
-
Air pollution changes due to COVID-19 lockdowns and attributable mortality changes in four countries.Environ Int. 2024 May;187:108668. doi: 10.1016/j.envint.2024.108668. Epub 2024 Apr 16. Environ Int. 2024. PMID: 38640613
-
Effects of city design on transport mode choice and exposure to health risks during and after a crisis: a retrospective observational analysis.Lancet Planet Health. 2025 Jun;9(6):e467-e479. doi: 10.1016/S2542-5196(25)00088-9. Lancet Planet Health. 2025. PMID: 40516538
-
COPD Exacerbations, Air Pollutant Fluctuations, and Individual-Level Factors in the Pandemic Era.Int J Chron Obstruct Pulmon Dis. 2025 Mar 17;20:735-751. doi: 10.2147/COPD.S498088. eCollection 2025. Int J Chron Obstruct Pulmon Dis. 2025. PMID: 40125072 Free PMC article.
-
Effects of air pollution on restricted activity days: systematic review and meta-analysis.Environ Health. 2023 Mar 30;22(1):31. doi: 10.1186/s12940-023-00979-8. Environ Health. 2023. PMID: 36991377 Free PMC article.
-
Individual-level interventions to reduce personal exposure to outdoor air pollution and their effects on people with long-term respiratory conditions.Cochrane Database Syst Rev. 2021 Aug 9;8(8):CD013441. doi: 10.1002/14651858.CD013441.pub2. Cochrane Database Syst Rev. 2021. PMID: 34368949 Free PMC article.
References
-
- Achebak H, Petetin H, Quijal-Zamorano M, Bowdalo D, García-Pando CP, Ballester J. 2020. Reduction in air pollution and attributable mortality due to COVID-19 lockdown. Lancet Planet Health 4:e269; https://doi.org/10.1016%2FS2542-5196(20)30149-2. - PMC - PubMed
-
- Achebak H, Petetin H, Quijal-Zamorano M, Bowdalo D, García-Pando CP, Ballester J. 2021. Trade-offs between short-term mortality attributable to NO2 and O3 changes during the COVID-19 lockdown across major Spanish cities. Environ Pollut 286:117220; https://doi.org/10.1016/j.envpol.2021.117220. - DOI - PMC - PubMed
-
- Alotaibi R, Bechle M, Marshall JD, Ramani T, Zietsman J, Nieuwenhuijsen MJ, et al. 2019. Traffic-related air pollution and the burden of childhood asthma in the contiguous United States in 2000 and 2010. Environ Int 127:858–867; https://doi.org/10.1016/j.envint.2019.03.041. - DOI - PubMed
-
- Apple.com. 2021. Mobility Trends Reports. https://covid19.apple.com/mobility [accessed 18 October 2021].
-
- Atkinson RW, Kang S, Anderson HR, Mills IC, Walton HA. 2014. Epidemiological time series studies of PM2.5 and daily mortality and hospital admissions: A systematic review and meta-analysis. Thorax 69:660–665; https://doi.org/10.1136/thoraxjnl-2013-204492. - DOI - PMC - PubMed
MeSH terms
Substances
LinkOut - more resources
Full Text Sources
Medical