. 2025 Jun 9:12:1539118.
doi: 10.3389/fnut.2025.1539118. eCollection 2025.

Personalized glucose prediction using in situ data only

Affiliations

Personalized glucose prediction using in situ data only

Rohan Singh et al. Front Nutr. .

Abstract

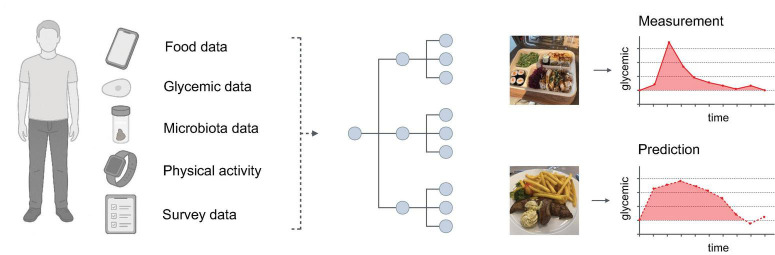
The worldwide rise in blood glucose levels is a major health concern, as various metabolic diseases become increasingly common. Diet, a modifiable health behaviour, is a primary target for the preventive management of glucose levels. Recent studies have shown that blood glucose responses after meals (post-prandial glucose responses, PPGR) can vary greatly among individuals, even with identical food consumption, and demonstrated accurate PPGR prediction using various features like microbiome data and blood parameters. Our study addresses whether accurate PPGR prediction can be achieved with a limited and easily obtainable set of data collected in real-world, everyday settings. Here, we show that a machine learning algorithm with such real-world data (RWD) collected from a digital cohort with over 1,000 participants can achieve high accuracy in PPGR prediction. Interestingly, we find that the best PPGR prediction model only required glycemic and temporally resolved diet data. This ability to predict PPGR accurately without the need for biological lab analysis offers a path toward highly scalable personalized nutrition and glucose management strategies.

Keywords: digital cohort; gut microbiome; personalized nutrition; real-world data; real-world evidence.


Conflict of interest statement

The authors declare that the research was conducted in the absence of any commercial or financial relationships that could be construed as a potential conflict of interest.

Figures

FIGURE 1
FIGURE 1
Study setup. Left: The Food and You digital cohort collected data on diet, glycemia, microbiota, physical activity, and other factors. Middle: These data are used to train a machine learning model (gradient-boosted trees) for PPGR prediction. Right: Each meal has a corresponding PPGR value measured as incremental area under the curve (iAUC, see Materials and methods). The model tries to predict the iAUC of a given meal - iAUC predictions and iAUC measurements are then compared to assess model performance.
FIGURE 2
FIGURE 2
Macronutrient composition and glycemic response of standardized meals, and nutritional features comparison between breakfast, lunch, and dinner meals. (A) Displays the mean grams of carbohydrates, proteins, and fats in the standardized breakfasts: A glucose drink, white bread, and white bread with added butter. (B) Illustrates the distribution of postprandial incremental area under the curve (iAUC) for glucose after consumption of each standardized breakfast. Dashed vertical lines indicate the median iAUC for each type, demonstrating the shift in glucose response. (C) Displays glucose responses for the standardized meals (shaded regions highlight confidence intervals at 99%). (D,E) Compare carbohydrate and iAUC values for standardized breakfasts vs. other breakfast meals. (F) Presents the interquartile range for the time elapsed since the last meal for breakfast, lunch, and dinner. (G) Boxplots illustrate the proportion of macronutrients—carbohydrates, proteins, fats, and fiber—consumed during breakfast, lunch, and dinner. (H) Boxplot for past 3-h kcal consumption for breakfast, lunch, and dinner meals.
FIGURE 3
FIGURE 3
Different model implementations and corresponding dataset size and Pearson correlation scores. Presence of a particular feature set is shown in green. M represents microbiome features (which includes alpha diversity indices and 10 principle components of unweighted UniFrac distances). Dataset size refers to the number of observations, i.e., food loggings across all users, without missing data in any of the features. Feature list for each variable group are detailed in Supplementary Table 1.
FIGURE 4
FIGURE 4
Feature importances for top features across different model combinations, correlation between predicted and measured PPGR for different meal timings (using gradient boosted tree models), and explained variance% (R2) of different feature sets (using linear regression models). (A) Heatmap of top features by their importance in different model combinations containing glycemic, compositional dietary, and temporal dietary features. (B) Scatter plots comparing the predicted iAUC against the measured iAUC for breakfast, lunch, dinner, and all meal logged data. Pearson correlation coefficient shown as “R” indicates the strength of the relationship. Blue dots in breakfast data demarcates standardized meals data points. The red dotted line represents the line of best fit, illustrating the predictive accuracy of the model for each meal timing type. (C) Explained variance (R2 in%) for different feature sets: Glycemic, Diet Composition, Diet Temporal, Microbiome, Personal (i.e., demographic such as age, BMI etc.) and Activity (sleep and physical), over meals consumed during different times of the day.
FIGURE 5
FIGURE 5
SHAP summary plot correlating feature impact on iAUC and SHAP dependency plots showcasing the relationship between six key features and their SHAP values. (A) provides the mean SHAP value, i.e., impact on predicted iAUC, for top 15 features in the XGBoost model of glycemic and dietary features sets implementation (G + Dc + Dt + P). (B) plot visualizes the directionality of SHAP values with the corresponding feature magnitude depicted by color intensity. (C–H) display the SHAP dependency plots of different features on iAUC prediction, highlighting the ranges of features which contribute toward prediction power [dots are additionally colored according to carbohydrates eaten, or previous 3 h carbohydrate eaten in the case of (C)]. (C) Carbohydrate intake demonstrates a significant increase in PPGR impact as carbohydrate consumption rises. The peak at around 50 g corresponds to the standardized breakfasts. (D) Baseline glucose and (E) glucose trend from 4 h prior show inverse influence on SHAP values. (F) Time since the last meal presents a decreasing pattern, suggesting its diminishing impact over time. (G,H) Show dependency plot for past 3 h energy kcal and protein-carb ratio. Each plot is annotated with a mean line for the corresponding features. Horizontal zero lines highlight the neutral point of no impact.

Similar articles

References

    1. International Diabetes Federation. IDF Diabetes Atlas. 10th ed. Brussels: International Diabetes Federation; (2021).
    1. Gentilcore D, Chaikomin R, Jones K, Russo A, Feinle-Bisset C, Wishart J, et al. Effects of fat on gastric emptying of and the glycemic, insulin, and incretin responses to a carbohydrate meal in type 2 diabetes. J Clin Endocrinol Metab. (2006) 91:2062–7. 10.1210/jc.2005-2644 - DOI - PubMed
    1. Moghaddam E, Vogt J, Wolever T. The effects of fat and protein on glycemic responses in nondiabetic humans vary with waist circumference, fasting plasma insulin, and dietary fiber intake. J Nutr. (2006) 136:2506–11. 10.1093/jn/136.10.2506 - DOI - PubMed
    1. Zeevi D, Korem T, Zmora N, Israeli D, Rothschild D, Weinberger A, et al. Personalized nutrition by prediction of glycemic responses. Cell. (2015) 163:1079–94. 10.1016/j.cell.2015.11.001 - DOI - PubMed
    1. Berry S, Valdes A, Drew D, Asnicar F, Mazidi M, Wolf J, et al. Human postprandial responses to food and potential for precision nutrition. Nat Med. (2020) 26:964–73. 10.1038/s41591-020-0934-0 - DOI - PMC - PubMed

LinkOut - more resources