Safflower plant extract as a sustainable corrosion inhibitor for carbon steel in acidic media: a combined electrochemical and computational study
- PMID: 40551842
- PMCID: PMC12183547
- DOI: 10.1039/d5ra03333k
Safflower plant extract as a sustainable corrosion inhibitor for carbon steel in acidic media: a combined electrochemical and computational study
Abstract
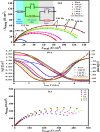
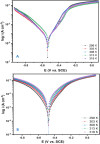
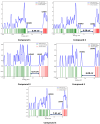
This study investigates the corrosion inhibition efficiency of safflower plant (SP) extract on carbon steel in hydrochloric acid (HCl) solutions. The SP extract, obtained through Soxhlet extraction, was tested for its ability to reduce corrosion using electrochemical techniques, including potentiodynamic polarization, electrochemical impedance spectroscopy (EIS), and electrochemical frequency modulation (EFM). The study revealed that the SP extract functions as an effective mixed-type inhibitor, significantly reducing the corrosion current density and enhancing inhibition efficiency at concentrations up to 2.5 g L-1. It achieved an inhibition efficiency of 89.56% at 2.5 g L-1. The adsorption mechanism is described in terms of both physical and chemical adsorption processes, with the Langmuir isotherm fitting the adsorption data. Computational modeling using density functional theory (DFT) further supported the experimental findings, identifying key active compounds in SP extract that contribute to its inhibitory performance. The study demonstrates the potential of SP extract as a sustainable and eco-friendly corrosion inhibitor for industrial applications.
This journal is © The Royal Society of Chemistry.
Conflict of interest statement
The authors declare that they have no known competing financial interests or personal relationships that could have appeared to influence the work reported in this paper.
Figures


References
-
- Sayin K. Jafari H. Mohsenifar F. J. Taiwan Inst. Chem. Eng. 2016;68:431–439.
-
- Bahraq A. A. Obot I. B. Al-Osta M. A. Ibrahim M. Constr. Build. Mater. 2024;412:134808.
-
- Baladi M. Yousif Q. A. Valian M. Salavati-Niasari M. J. Alloys Compd. 2022;896:163032.
-
- Abd El Wanees S. Saleh M. G. A. Alahmdi M. I. Elsayed N. H. Aljohani M. M. Abdelfattah M. Soliman K. A. Lotfy Alalati M. Elyan S. S. Mater. Chem. Phys. 2024;311:128484.
LinkOut - more resources
Full Text Sources

