. 2025 Jun 23;4(6):e70062.
doi: 10.1002/jex2.70062. eCollection 2025 Jun.

Serum Extracellular Vesicles Reveal Metabolic Responses to Time-Restricted Feeding in High-Fat Diet-Induced Obesity in Male Mice

Affiliations

Serum Extracellular Vesicles Reveal Metabolic Responses to Time-Restricted Feeding in High-Fat Diet-Induced Obesity in Male Mice

Theresa Bushman et al. J Extracell Biol. .

Abstract

Extracellular vesicle (EV) secretion and cargo composition are dysregulated in metabolic diseases. This study aimed to investigate how changes in serum EV concentration and protein composition reflect the metabolic effects of a high-fat diet (HFD) and time-restricted feeding (TRF), with a particular focus on adipocyte-derived EVs (Ad-EVs) in circulation. Mice were fed an HFD for 18 weeks prior to being placed either ad libitum or on a TRF for an additional 10 weeks. Mice on a normal chow ad libitum served as the control. The TRF group had food available for 10 h and fasted for 14 h per day. The serum EV size profile and amount displayed sex- and age-dependent changes in HFD-induced obesity, with age reducing EV amounts. HFD decreased small EV populations and increased larger EV populations, while TRF reversed these changes. Quantitative proteomic analysis showed that the abundance and composition of EV proteins changed in response to both acute stimulation with lipopolysaccharides (LPS) and HFD. Gene ontology analysis identified specific sets of EV proteins and their involved biological processes, reflecting the effect of LPS and HFD, as well as the reversal effect of TRF on metabolic and inflammatory pathways. EV proteins altered by HFD and those reversed by TRF had low protein overlap but significant functional overlap in biological processes. TRF activated the PPAR signalling pathway and the AKT-mTOR signalling pathway. The most significant impacts of HFD and TRF were observed on lipoprotein and carbohydrate metabolism, the complement system, and neutrophil degranulation. Additionally, we showed that serum Ad-EVs respond dynamically to HFD and TRF. Our findings suggest that EVs play a role in diet-induced metabolic and inflammatory responses, with changes in circulating EVs, particularly Ad-EVs, reflecting metabolic adaptations to dietary exposures and interventions.

Keywords: extracellular vesicles; inflammation; obesity; proteomics; time‐restricted feeding.


Conflict of interest statement

The authors declare no conflict of interest.

Figures

FIGURE 1
FIGURE 1
Effect of HFD and TRF on serum EV profiling in middle‐aged male and female mice. (A) Nanoparticle tracking analysis plots for middle‐age male mice. (B) Nanoparticle tracking analysis plots for middle‐age female mice. (C) Violin plot depicting the distribution of serum EV diameter in middle‐aged female (n = 3) and male mice (n = 4). Two‐way ANOVA revealed significance between sex and diet type. (D) Violin plot illustrating the distribution of the average total number of particles of EVs per mL for middle‐aged females (n = 3) and males (n = 4). Two‐way ANOVA only showed significance between sexes. Student t‐test was employed for comparisons between groups. Capitalised letters indicate statistical significance between the experimental groups of male mice, whereas lowercase indicate differences within the female mice group. Different letters indicate statistical significance. *: Indicates statistical significance between the male and female mice. (E) serum EV size distribution of middle‐aged male mice. (F) Middle‐aged female experimental group EV distribution. (G) Old female experimental group EV distribution. p values for statistical analysis provided. For the EV size distribution (E)–(G), two‐way ANOVA showed significance between sex and age. Student t‐test was employed for comparisons between groups.
FIGURE 2
FIGURE 2
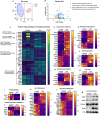
Proteomics characterisation of serum EV proteins in young male mice. (A) Scatter plot of the first two principal components (PC1 and PC2) derived from PCA of EV proteins in LPS (n = 3) and control (n = 3) groups. (B) Volcano plot depicting EV protein characterisation. (C) Heatmap depicting EV protein characterisation. (D)–(L) Heatmaps depicting alterations of EV proteins in multiple pathways. For all heatmaps, the average fold change (Avg FC) of each protein was calculated as the ratio of its abundance to the average abundance across all control and LPS‐treated groups. (M) Western blots of serum EVs from young male mice treated with or without LPS (0.3 mg/kg, intraperitoneal injection) for 6 h. Each lane displays a sample taken from an individual animal.
FIGURE 3
FIGURE 3
Effect of HFD and TRF on serum EV protein profiles in middle‐aged male mice. (A) Scatter plot of the first two principal components (PC1 and PC2) derived from the PCA of EV proteins in control (n = 3), HFD‐AL (n = 4), and HFD‐TRF (n = 4) groups. (B) Circos plot showing overlap of altered EV proteins from three group comparisons. (C) Circos plot showing shared enriched ontologies of altered EV proteins from three group comparisons. (D) Enriched ontology clusters of altered EV proteins from three group comparisons. (E) Protein‐protein interaction network of altered EV proteins merged and pied by three group comparisons. (F)–(H) The abundance of altered EV proteins in their respective clusters or pathways. For the Circos plots (B and C), on the outside, each arc represents the identity of each EV protein list. On the inside, each arc represents an EV protein list, where each protein member of that list is assigned a spot on the arc. Dark orange colour represents the proteins that are shared by multiple lists and light orange colour represents proteins that are unique to that protein list. Purple lines link the same protein that are shared by multiple protein lists. The greater the number of purple links and the longer the dark orange arcs implies greater overlap among the input protein lists.
FIGURE 4
FIGURE 4
GSEA of altered serum EV proteins in metabolism by HFD and TRF. (A) Enrichment score plot of metabolism pathways for group comparisons of EV protein abundance between control and HFD‐EVs. (B) Enrichment score plot of metabolism pathways for group comparisons of EV protein abundance between control and TRF‐EVs. (C) Enrichment score plot of metabolism pathways for group comparisons of EV protein abundance between HFD‐EVs and TRF‐EVs. (D)–(F) Corresponding heatmaps of EV protein abundance to the enrichment score plots. (G) Enriched ontology clusters of altered EV proteins from three group comparisons. (H)–(J) The abundance of altered EV proteins in their respective clusters or pathways. The degree of enrichment is indicated on the figures by a normalised enrichment score (NES) (A)–(C). A significant positive NES value indicates that proteins in the enrichment core tend to appear towards the top of the protein set, whereas a significant negative NES indicates the opposite, towards the bottom of the protein set, as shown in the heatmaps (D)–(F).
FIGURE 5
FIGURE 5
Western blotting analysis of adipocyte‐derived EV proteins altered by HFD and TRF. (A) and B) Western blots and band density quantification of general EV and Ad‐EV markers in serum EVs from middle‐aged male mice on HFD‐AL and HFD‐TRF. (C) and (D) Western blots and band density quantification of general EV and Ad‐EV markers in serum EVs from middle‐aged female mice on HFD‐AL and HFD‐TRF. n = 3–4, *< 0.05. Each lane displays a sample taken from an individual animal.

Update of

Similar articles

References

    1. Alberro, A. , Iparraguirre L., Fernandes A., and Otaegui D.. 2021. “Extracellular Vesicles in Blood: Sources, Effects, and Applications.” International Journal of Molecular Sciences 22: 8163. - PMC - PubMed
    1. Alibhai, F. J. , Lim F., Yeganeh A., et al. 2020. “Cellular Senescence Contributes to Age‐Dependent Changes in Circulating Extracellular Vesicle Cargo and Function.” Aging Cell 19: 1–14. - PMC - PubMed
    1. Amosse, J. , Durcin M., Malloci M., et al. 2018. “Phenotyping of Circulating Extracellular Vesicles (EVs) in Obesity Identifies Large EVs as Functional Conveyors of Macrophage Migration Inhibitory Factor.” Molecular Metabolism 18: 134–142. - PMC - PubMed
    1. Bavisotto, C. C. , Scalia F., Marino Gammazza A., et al. 2019. “Extracellular Vesicle‐Mediated Cell–Cell Communication in the Nervous System: Focus on Neurological Diseases.” International Journal of Molecular Sciences 20: 1–23. - PMC - PubMed
    1. Blandin, A. , Amosse J., Froger J., et al. 2023. “Extracellular Vesicles Are Carriers of Adiponectin With Insulin‐Sensitizing and Anti‐Inflammatory Properties.” Cell Reports 42: 112866. - PubMed

LinkOut - more resources