. 2025 Jun 23;4(6):e70067.
doi: 10.1002/jex2.70067. eCollection 2025 Jun.

iMSC-Derived Extracellular Vesicles Improve Atopic Dermatitis by Augmenting Skin Barrier Integrity and Inhibiting Inflammation, Pruritus and Th2 Immune Responses

Affiliations

iMSC-Derived Extracellular Vesicles Improve Atopic Dermatitis by Augmenting Skin Barrier Integrity and Inhibiting Inflammation, Pruritus and Th2 Immune Responses

Soo Kim et al. J Extracell Biol. .

Abstract

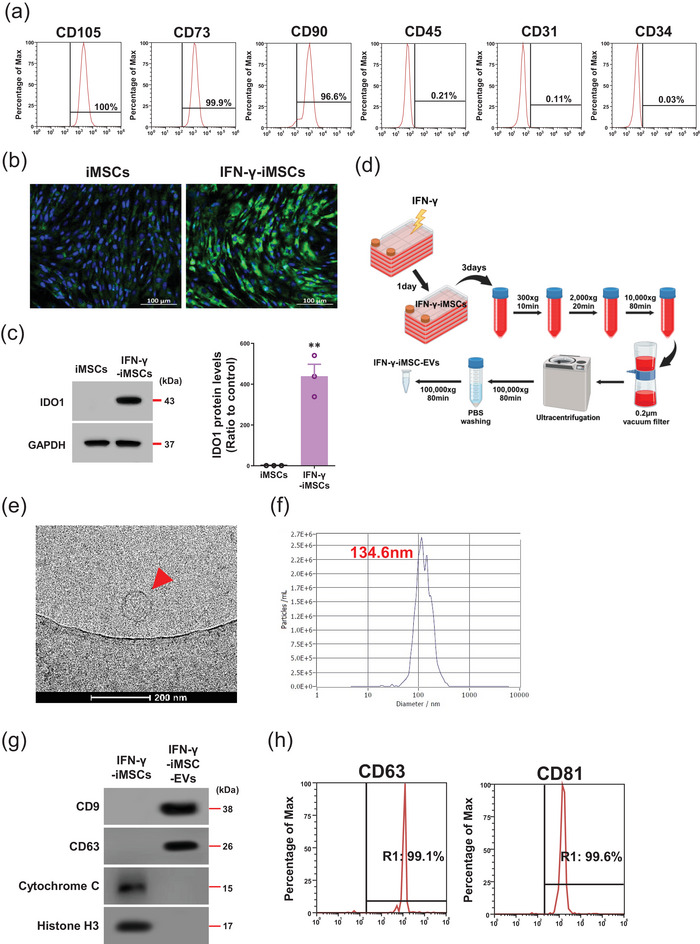
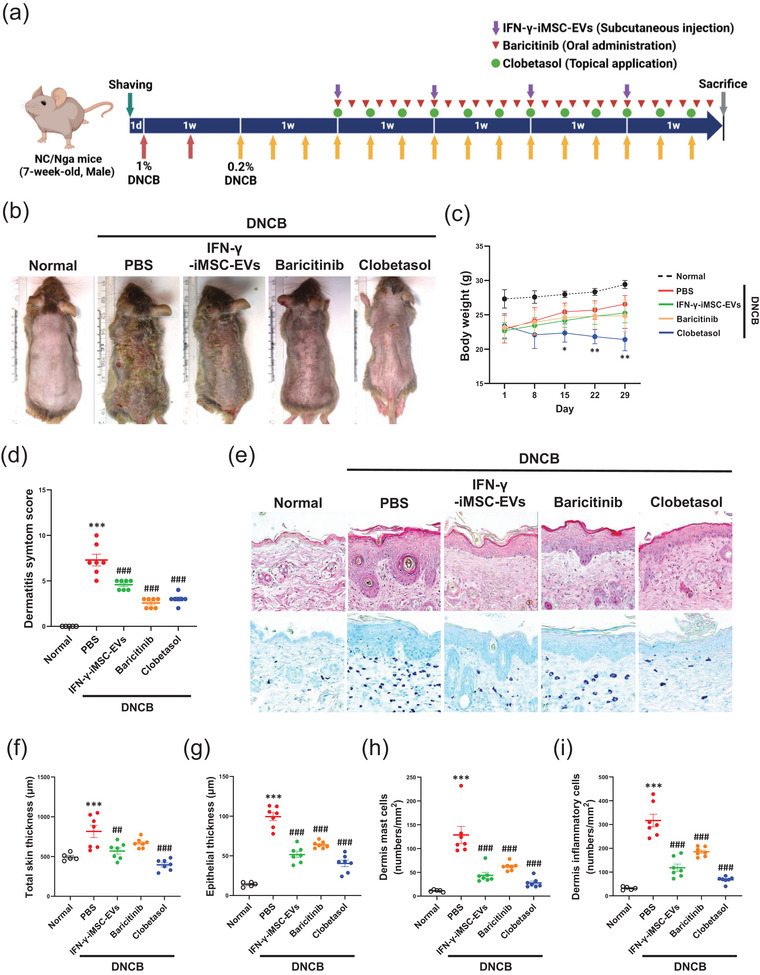
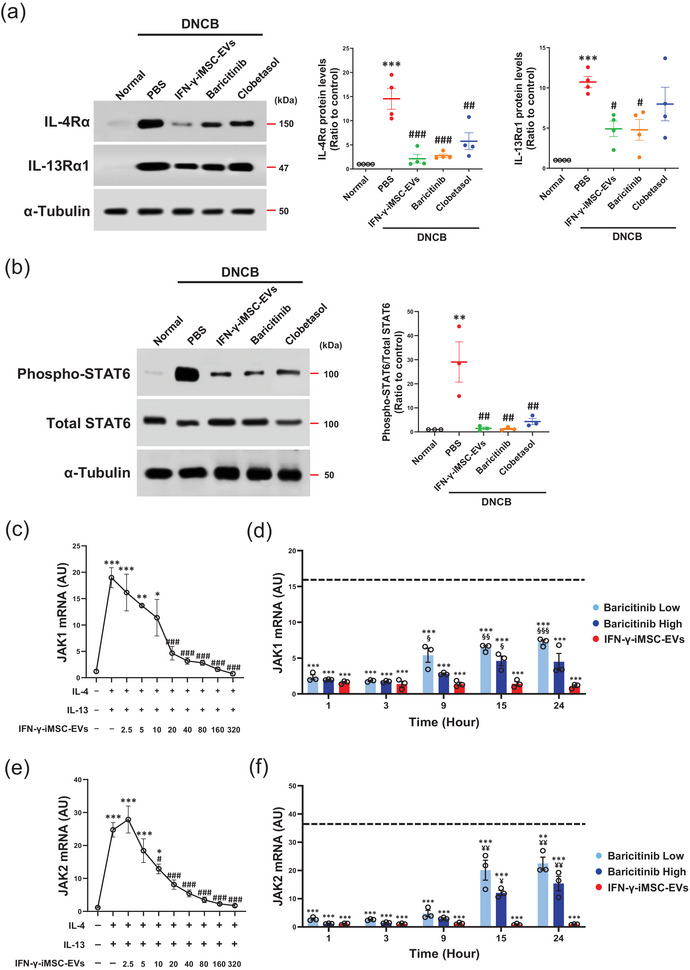
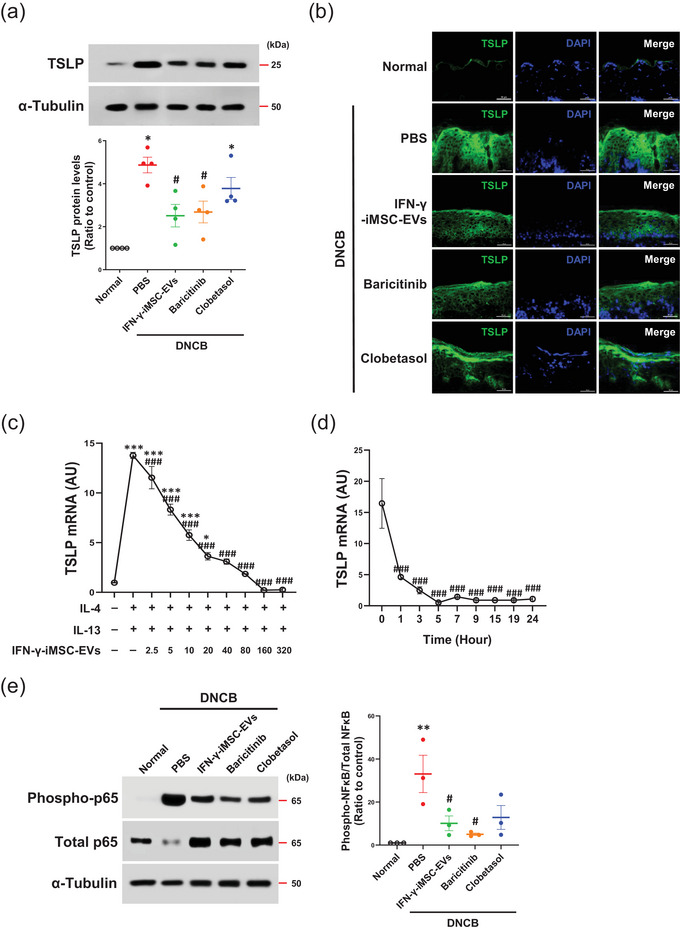
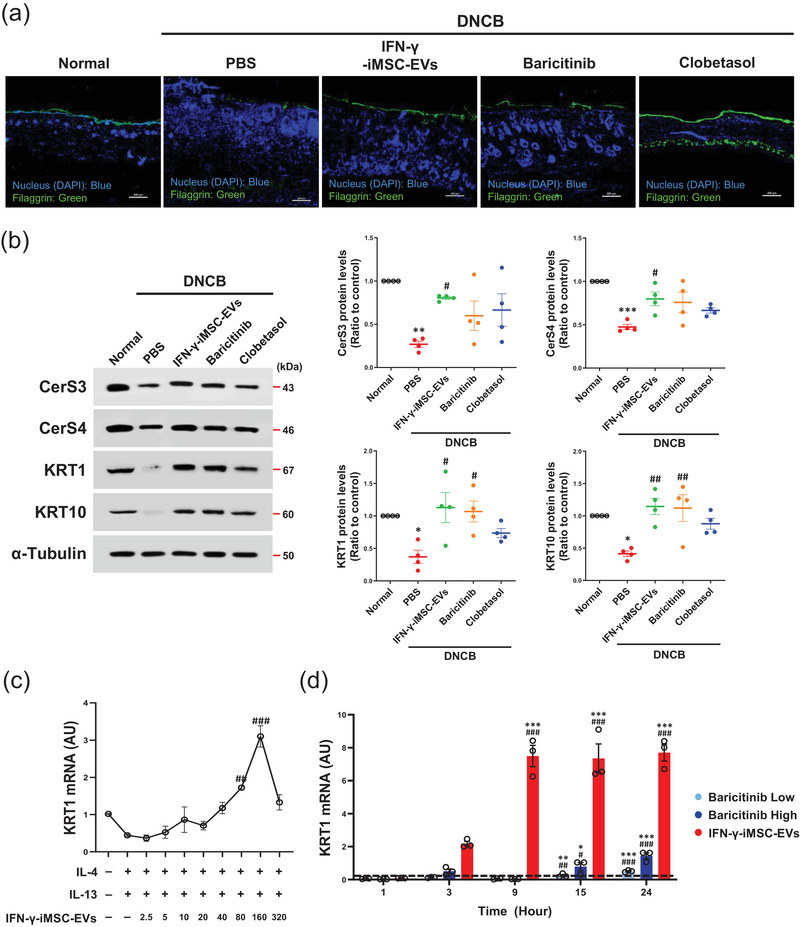
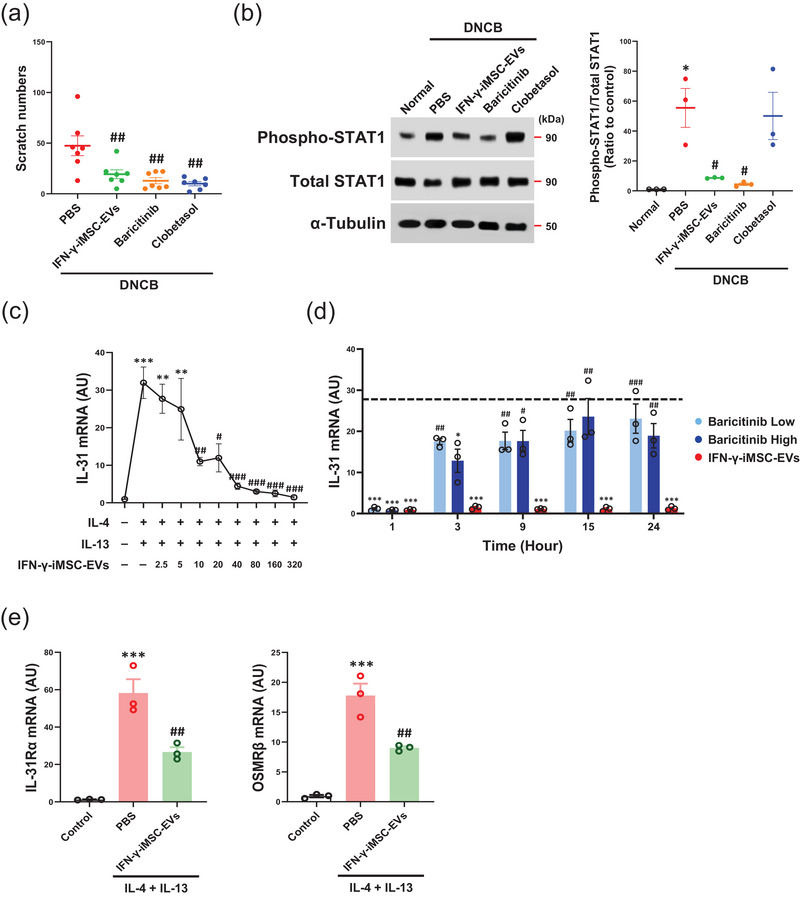
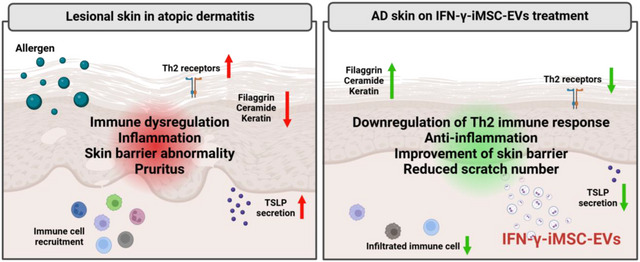
Atopic dermatitis (AD) is a chronic inflammatory disease characterized by severe itching and eczematous lesions. Despite various treatments, AD patients experience side effects and fail to achieve full remission. This study investigated the therapeutic potential of extracellular vesicles (EVs) derived from IFN-γ-primed induced mesenchymal stem cells (IFN-γ-iMSC-EVs) in a 2,4-dinitrochlorobenzene (DNCB)-induced AD mouse model. We also examined whether IFN-γ-iMSC-EVs could suppress IL-4/13-induced Th2 responses in keratinocytes. The therapeutic outcome of IFN-γ-iMSC-EVs was comparable to or more effective than baricitinib or clobetasol. While severe weight loss was observed in mice treated with clobetasol, no significant weight reduction occurred in those receiving IFN-γ-iMSC-EVs. Histological analysis demonstrated reduced skin thickness, decreased infiltration of mast cells and inflammatory cells, and suppression of the Th2 immune response, as evidenced by decreased signalling of IL-4, IL-13, and IL-31. IFN-γ-iMSC-EVs also led to a greater reduction in inflammation and pruritus compared to baricitinib and clobetasol. Additionally, skin barrier integrity and epidermal protein expression were improved in IFN-γ-iMSC-EVs. In IL-4/13-stimulated keratinocytes, the decrease in JAK1/2 gene expression and the increase in Keratin 1 gene expression were more prominent in IFN-γ-iMSC-EVs than in baricitinib. The results suggest that IFN-γ-iMSC-EVs have the potential to inhibit AD progression and represent a novel therapeutic option for AD.

Keywords: IFN‐γ; Th2 immune response; atopic dermatitis; extracellular vesicles; mesenchymal stem cells.


Conflict of interest statement

Soo Kim is the chief executive officer of Brexogen Inc. Other authors declare no conflicts of interest.

Figures

FIGURE 1
FIGURE 1
Characterization of IFN‐γ‐iMSCs and IFN‐γ‐iMSC‐EVs. (a) Flow cytometry analysis of IFN‐γ‐iMSCs. The reactivities of IFN‐γ‐iMSCs against positive (CD105, CD73 and CD90) or negative (CD45, CD31 and CD34) markers of MSCs were evaluated. (b) Representative image of IDO1 protein expression in iMSCs and IFN‐γ‐iMSCs by immunocytochemistry analysis. Green and blue denote cells stained with anti‐IDO1 antibody and DAPI, respectively. (c) Immunoblot analysis of IDO1 protein levels in iMSCs and IFN‐γ‐iMSCs. n = 3. Data are presented as mean ± SE. **p < 0.01 versus Control. (d) Scheme of the IFN‐γ‐iMSC‐EVs manufacturing. IFN‐γ‐iMSC‐EVs were isolated from the IFN‐γ‐iMSCs culture medium using ultracentrifugation. (e) Morphology of IFN‐γ‐iMSC‐EVs under cryo‐TEM. Scale bar = 200 nm. (f) Size distribution of IFN‐γ‐iMSC‐EVs shown by NTA. The average size is 134.6 nm. (g) Western blot analyses for markers of extracellular vesicles (CD9 and CD63) or cellular organelles (Cytochrome C and Histone H3) in IFN‐γ‐iMSCs and IFN‐γ‐iMSC‐EVs. (h) Expression analysis of EV markers (CD63 and CD81) in IFN‐γ‐iMSC‐EVs by flow cytometry.
FIGURE 2
FIGURE 2
Suppressive effects of IFN‐γ‐iMSC‐EVs on AD progression in DNCB‐induced NC/Nga mice. (a) Overall scheme of animal experiments. AD was induced by topical treatments of 1.0% and 0.4% of DNCB on the skin at Days 0 and 7, respectively. AD mice were subcutaneously injected with PBS or IFN‐γ‐iMSC‐EVs, orally administered with baricitinib or topically applied with clobetasol, respectively. (b) Gross appearance of the skin lesions of AD mice that received IFN‐γ‐iMSC‐EVs, baricitinib or clobetasol. (c) Measurement of body weight from AD mice that received IFN‐γ‐iMSC‐EVs, baricitinib or clobetasol. n = 5. Data are presented as mean ± SE. *p < 0.05; **p < 0.01 versus DNCB + PBS. (d) Analysis of dermatitis symptom score. n = 5; Normal mice, n = 7; AD mice. Data are presented as mean ± SE. ***p < 0.001 versus Normal, ### p < 0.001 versus DNCB + PBS. (e) Representative image of skin tissues from AD mice that received IFN‐γ‐iMSC‐EVs, baricitinib or clobetasol. The upper and bottom images are tissues stained with H&E and toluidine blue, respectively. Magnification: 200×. Analysis of total skin thickness (f) and epithelial thickness (g) in the skin layer of AD mice that received IFN‐γ‐iMSC‐EVs, baricitinib or clobetasol. n = 5; Normal mice, n = 7; AD mice. Data are presented as mean ± SE. ***p < 0.001 versus Normal, ## p < 0.01; ### p < 0.001 versus DNCB + PBS. The number of mast cells (h) and inflammatory cells (i) in the dermis layer of AD mice that received IFN‐γ‐iMSC‐EVs, baricitinib or clobetasol. n = 5; Normal mice, n = 7; AD mice. Data are presented as mean ± SE. ***p < 0.001 versus Normal, ### p < 0.001 versus DNCB + PBS.
FIGURE 3
FIGURE 3
Repression of IL‐4/13 signalling cascade by IFN‐γ‐iMSC‐EVs in AD models. (a) Immunoblot analysis of IL‐4Rα and IL‐13Rα1 in skin tissues from AD mice that received IFN‐γ‐iMSC‐EVs, baricitinib or clobetasol. n = 4. Data are presented as mean ± SE. ***p < 0.001 versus Normal, # p < 0.05, ## p < 0.01, ### p < 0.001 versus DNCB + PBS. (b) Immunoblot analysis of phosphorylated STAT6 in skin tissues from AD mice that received IFN‐γ‐iMSC‐EVs, baricitinib or clobetasol. The density of phosphorylated STAT6 was normalized to that of total STAT6. n = 3. Data are presented as mean ± SE. **p < 0.01 verssus Normal, ## p < 0.01 versus DNCB + PBS. qPCR analysis of JAK1 (c) and JAK2 (e) in IL‐4/13‐stimulated HaCaT keratinocytes that dose‐dependently treated with IFN‐γ‐iMSC‐EVs. n = 3. Data are presented as the mean ± SE. *p < 0.05; **p < 0.01; ***p < 0.001 versus Control, # p < 0.05; ## p < 0.01; ### p < 0.001 versus IL‐4 + IL‐13 + PBS. qPCR analysis of JAK1 (d) and JAK2 (f) in IL‐4/13‐stimulated HaCaT keratinocytes that were treated with PBS, IFN‐γ‐iMSC‐EVs or baricitinib (low or high concentrations) for various durations. The dashed line is IL‐4 + IL‐13 + drug treatment at 0 h. n = 3. Data are presented as the mean ± SE. **p < 0.01; ***p < 0.001 versus IL‐4 + IL‐13 + drug treatment at 0 h, § p < 0.05; §§ p < 0.01; §§§ p < 0.001 versus IL‐4 + IL‐13 + drug treatment at 3 h, ¥ p < 0.05; ¥¥ p < 0.01 versus IL‐4 + IL‐13 + drug treatment at 9 h.
FIGURE 4
FIGURE 4
Reduction of inflammation by IFN‐γ‐iMSC‐EVs in AD models. (a) Immunoblot analysis of TSLP in the skin tissues collected from AD mice that received IFN‐γ‐iMSC‐EVs, baricitinib or clobetasol. n = 4. Data are presented as mean ± SE. *p < 0.05 versus Normal, # p < 0.05 versus DNCB + PBS. (b) Representative image of TSLP protein expression in skin tissues from AD mice that received IFN‐γ‐iMSC‐EVs, baricitinib or clobetasol by immunofluorescence staining. Scale bar: 50 µm. (c) qPCR analysis of TSLP in IL‐4/13‐stimulated HaCaT keratinocytes that were treated with various concentrations of IFN‐γ‐iMSC‐EVs. n = 3. Data are presented as the mean ± SE. *p < 0.05; ***p < 0.001 versus Control, ### p < 0.001 versus IL‐4 + IL‐13 + PBS. (d) qPCR analysis of TSLP in IL‐4/13‐stimulated HaCaT keratinocytes that were treated with IFN‐γ‐iMSC‐EVs for various durations. n = 3. Data are presented as the mean ± SE. ### p < 0.001 versus IL‐4 + IL‐13 + IFN‐γ‐iMSC‐EVs treatment at 0 h. (e) Immunoblot analysis of phosphorylated p65 in skin tissues from AD mice that received IFN‐γ‐iMSC‐EVs, baricitinib or clobetasol. The density of phosphorylated p65 was normalized to that of total p65. n = 3. Data are presented as mean ± SE. **p < 0.01 versus Normal, # p < 0.05 versus DNCB + PBS.
FIGURE 5
FIGURE 5
Restoration of skin barrier and lipid synthesis by IFN‐γ‐iMSC‐EVs. (a) Representative image of filaggrin protein expression in skin tissues collected from AD mice that received IFN‐γ‐iMSC‐EVs, baricitinib or clobetasol by immunofluorescence staining. Scale bar: 200 µm. (b) Immunoblot analysis of skin barrier– or lipid synthesis–related proteins in skin tissues of AD mice that received IFN‐γ‐iMSC‐EVs, baricitinib or clobetasol. n = 4. Data are presented as mean ± SE. *p < 0.05; **p < 0.01; ***p < 0.001 versus Normal, # p < 0.05; ## p < 0.01 versus DNCB + PBS. (c) qPCR analysis of KRT1 in IL‐4/13‐stimulated HaCaT keratinocytes treated with various concentrations of IFN‐γ‐iMSC‐EVs. n = 3. Data are presented as the mean ± SE. ## p < 0.01; ### p < 0.001 versus IL‐4 + IL‐13 + PBS. (d) qPCR analysis of KRT1 in IL‐4/13‐stimulated HaCaT keratinocytes that are time‐dependently treated with PBS, IFN‐γ‐iMSC‐EVs or baricitinib low or high. The dashed line is the mRNA level from IL‐4 + IL‐13 + drug treatment at 0 h. n = 3. Data are presented as the mean ± SE. *p < 0.05; **p < 0.01; ***p < 0.001 versus IL‐4 + IL‐13 + drug treatment at 0 h, # p < 0.05; ## p < 0.01; ### p < 0.001 versus IL‐4 + IL‐13 + drug treatment at 1 h.
FIGURE 6
FIGURE 6
Suppression of pruritus by IFN‐γ‐iMSC‐EVs. (a) Analysis of scratch numbers in AD mice that received IFN‐γ‐iMSC‐EVs, baricitinib or clobetasol. n = 7. Data are presented as mean ± SE. ## p < 0.01 versus DNCB + PBS. (b) Immunoblot analysis of phosphorylated STAT1 expression in skin tissues of AD mice that received IFN‐γ‐iMSC‐EVs, baricitinib or clobetasol. Densities of phosphorylated STAT1 were normalized to those of total STAT1. n = 3. Data are presented as mean ± SE. *p < 0.05 versus Normal, # p < 0.05 versus DNCB + PBS. (c) qPCR analysis of IL‐31 in IL‐4/13‐stimulated HaCaT keratinocytes treated with various concentrations of IFN‐γ‐iMSC‐EVs. n = 3. Data are presented as the mean ± SE. **p < 0.01; ***p < 0.001 versus Control, # p < 0.05; ## p < 0.01; ### p < 0.001 versus IL‐4 + IL‐13 + PBS. (d) qPCR analysis of IL‐31 in IL‐4/13‐stimulated HaCaT keratinocytes that are treated with PBS, IFN‐γ‐iMSC‐EVs or baricitinib (low or high concentrations) for various durations. The dashed line is IL‐4 + IL‐13 + drug treatment at 0 h. n = 3. Data are presented as the mean ± SE. *p < 0.05; ***p < 0.001 versus IL‐4 + IL‐13 + PBS; # p < 0.05; ## p < 0.01; ### p < 0.001 versus IL‐4 + IL‐13 + drug treatment at 1 h. (e) qPCR analysis of IL‐31Rα and OSMRβ in IL‐4/13‐stimulated HaCaT keratinocytes treated with IFN‐γ‐iMSC‐EVs. n = 3. Data are presented as mean ± SE. ***p < 0.001 versus Control, ## p < 0.01 versus IL‐4 + IL‐13 + PBS.
FIGURE 7
FIGURE 7
The schematic diagram of the proposed mechanism of INF‐γ‐iMSC‐EVs in improving AD.

Similar articles

References

    1. Aghayan, A. H. , Mirazimi Y., Fateh K., Keshtkar A., Rafiee M., and Atashi A.. 2024. “Therapeutic Effects of Mesenchymal Stem Cell‐Derived Extracellular Vesicles in Sepsis: A Systematic Review and Meta‐Analysis of Preclinical Studies.” Stem Cell Reviews and Reports 20, no. 6: 1480–1500. 10.1007/s12015-024-10741-3. - DOI - PubMed
    1. Almoghayer, I. H. I. , Soomro A. M., Dev S., et al. 2024. “Baricitinib as Monotherapy and With Topical Corticosteroids in Moderate‐to‐Severe Atopic Dermatitis: A Systematic Review and Meta‐Analysis of Dose‐Response.” Front Allergy 5: 1486271. 10.3389/falgy.2024.1486271. - DOI - PMC - PubMed
    1. Al‐Salama, Z. T. , and Scott L. J.. 2018. “Baricitinib: A Review in Rheumatoid Arthritis.” Drugs 78, no. 7: 761–772. 10.1007/s40265-018-0908-4. - DOI - PubMed
    1. Aviv, H. , Herzinger T., and Molin S.. 2020. “Skin Barrier Dysfunction in Contact Dermatitis and Atopic Dermatitis‐Treatment Implications.” Current Treatment Options in Allergy 7, no. 3: 390–402. 10.1007/s40521-020-00264-w. - DOI
    1. Bieber, T. 2010. “Atopic Dermatitis.” Annals of Dermatology 22, no. 2: 125–137. 10.5021/ad.2010.22.2.125. - DOI - PMC - PubMed

LinkOut - more resources