

Lower respiratory tract co-infection of Streptococcus pneumoniae and respiratory syncytial virus shapes microbial landscape and clinical outcomes in children
- PMID: 40552118
- PMCID: PMC12183261
- DOI: 10.3389/fcimb.2025.1593053
Lower respiratory tract co-infection of Streptococcus pneumoniae and respiratory syncytial virus shapes microbial landscape and clinical outcomes in children
Abstract
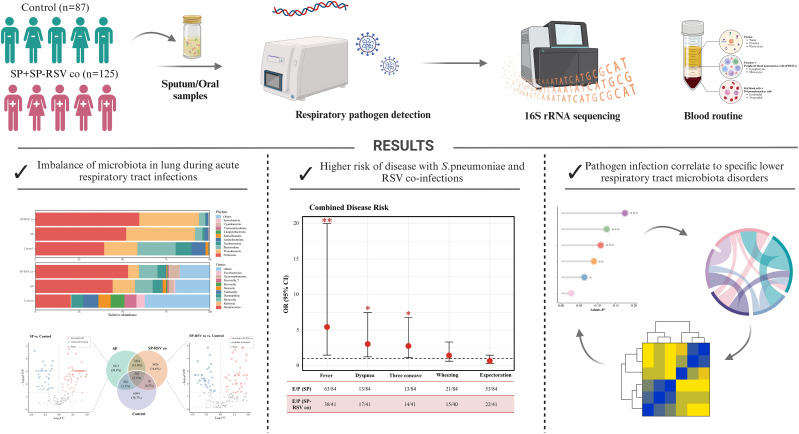
Background: Lower respiratory tract infections (LRTI), which are most commonly caused by Streptococcus pneumoniae (SP) and respiratory syncytial virus (RSV), pose a substantial global health burden in children. However, the causal pathways of bacterial-viral co-infections, particularly the mechanisms by which commensal microbiota could modulate SP-RSV-associated LRTI outcomes remain to be elucidated.
Methods: A population-based cross-sectional study was conducted on children aged 0-18 years who were admitted to Beijing Children's Hospital and Baoding Children's Hospital in China from September 2021 to August 2022. Children with LRTI who underwent respiratory pathogen testing were divided into SP single infection and SP-RSV co-infection groups, with sex- and time-matched non-LRTI children as controls. Sputum and LRT secretion samples were collected for microbiota analysis using 16S rRNA sequencing, and child characteristics were obtained from medical records and pharmacy data.
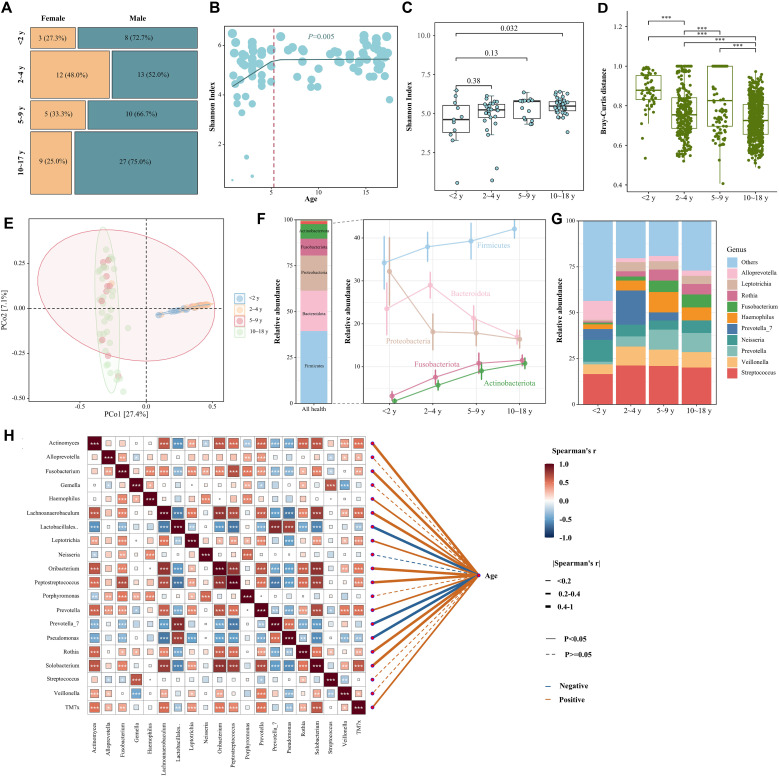
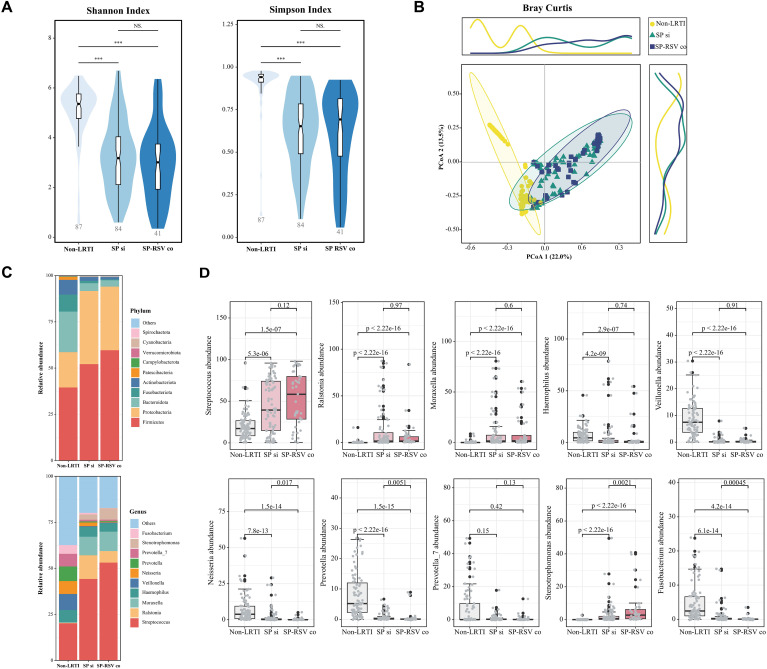
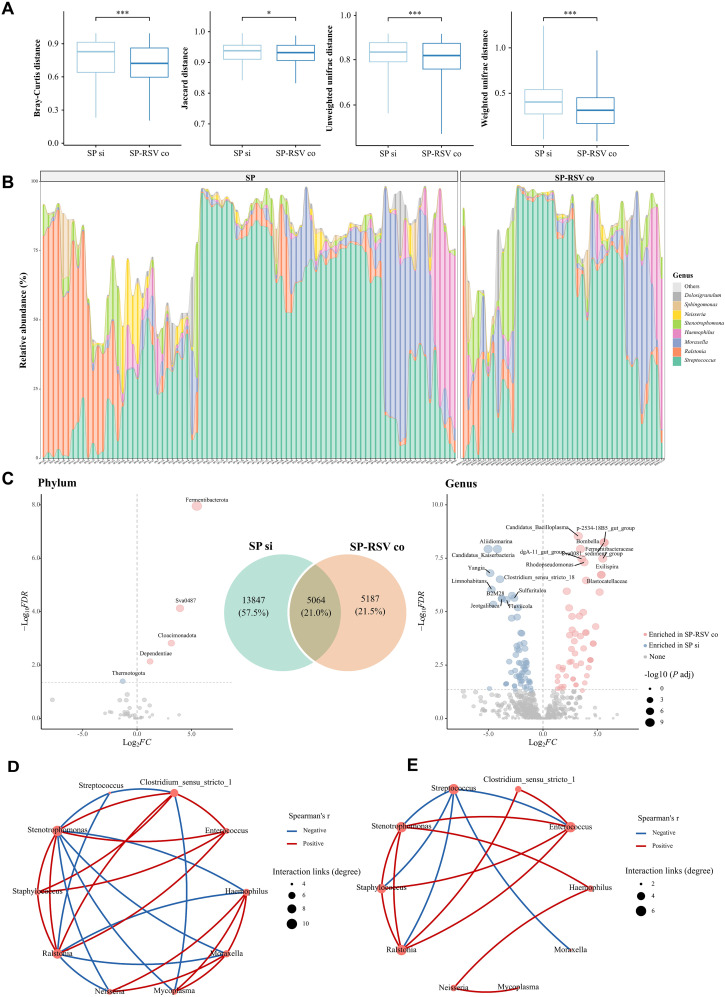
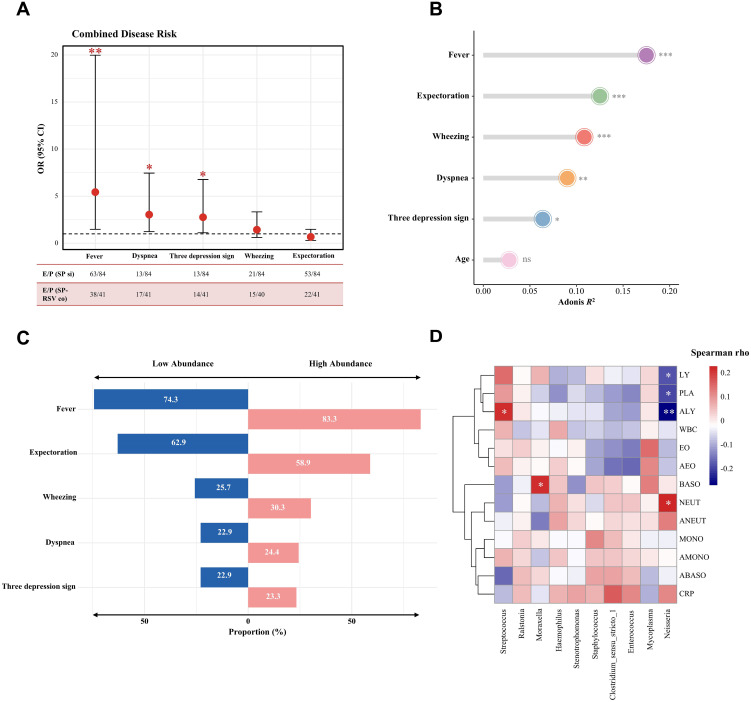
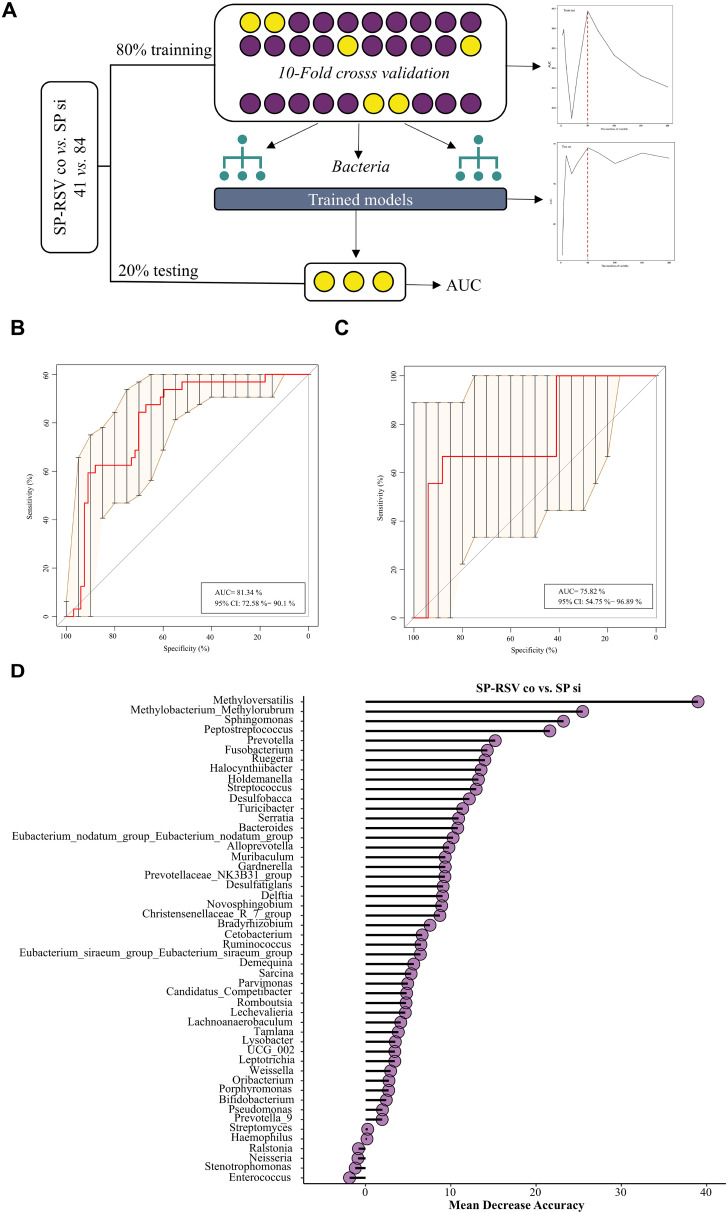
Results: A total of 125 children with LRTI (84 with SP infection and 41 with SP-RSV co-infection) and 87 children without LRTI were recruited for this study. We found that LRT microbiota composition was strongly related to age, with a more pronounced increase in Shannon index within the first 5 years of life. Children with SP and RSV infection exhibited significantly altered microbiota composition in comparison to children without LRTI, particularly a higher abundance of Streptococcus. The competitive interactions among respiratory bacteria were found to be more complex in the SP single-infection group and simpler in the SP-RSV co-infection group.
Conclusion: Our findings show that RSV co-infection exacerbates SP-induced LRTI microbiota disorder and disease severity. This study may help us to better understand the characteristics of SP-RSV interaction and provide direction for the pathogen diagnosis of LRTI.
Keywords: Streptococcus pneumoniae; children; lower respiratory tract infections; microbiota; respiratory syncytial virus.
Copyright © 2025 Yu, Yang, Song, Yu, Jiang, Tang, Yang, Zeng, Bi, Shen and Sun.
Conflict of interest statement
The authors declare that the research was conducted in the absence of any commercial or financial relationships that could be construed as a potential conflict of interest. The reviewer WZ declared a shared parent affiliation with the authors XY, JY, XZ, AS, LS to the handling editor at the time of review
Figures
Similar articles
-
Budget impact of maternal vaccination with RSVpreF to protect privately insured infants in Dubai against respiratory syncytial virus.Hum Vaccin Immunother. 2025 Dec;21(1):2523106. doi: 10.1080/21645515.2025.2523106. Epub 2025 Jul 2. Hum Vaccin Immunother. 2025. PMID: 40600492 Free PMC article.
-
Understanding the interaction of upper respiratory tract infection with respiratory syncytial virus and Streptococcus pneumoniae using a human challenge model: a multicenter, randomized controlled study protocol.PLoS One. 2025 Jul 1;20(7):e0325149. doi: 10.1371/journal.pone.0325149. eCollection 2025. PLoS One. 2025. PMID: 40591700 Free PMC article.
-
Respiratory bacterial and viral pathogen spectrum among influenza-positive and influenza-negative patients.BMC Infect Dis. 2025 Jul 1;25(1):866. doi: 10.1186/s12879-025-11232-7. BMC Infect Dis. 2025. PMID: 40597844 Free PMC article.
-
Immunoprophylaxis against respiratory syncytial virus (RSV) with palivizumab in children: a systematic review and economic evaluation.Health Technol Assess. 2008 Dec;12(36):iii, ix-x, 1-86. doi: 10.3310/hta12360. Health Technol Assess. 2008. PMID: 19049692
-
The association between bacteria colonizing the upper respiratory tract and lower respiratory tract infection in young children: a systematic review and meta-analysis.Clin Microbiol Infect. 2021 Sep;27(9):1262-1270. doi: 10.1016/j.cmi.2021.05.034. Epub 2021 Jun 7. Clin Microbiol Infect. 2021. PMID: 34111578 Free PMC article.
References
-
- Achten N. B., van Rossum A. M. C., Bacharier L. B., Fitzpatrick A. M., Hartert T. V. (2022). Long-term respiratory consequences of early-life respiratory viral infections: A pragmatic approach to fundamental questions. J. Allergy Clin. Immunol. Pract. 10, 664–670. doi: 10.1016/j.jaip.2021.12.005 - DOI - PubMed
-
- Avadhanula V., Rodriguez C. A., Devincenzo J. P., Wang Y., Webby R. J., Ulett G. C., et al. (2006). Respiratory viruses augment the adhesion of bacterial pathogens to respiratory epithelium in a viral species- and cell type-dependent manner. J. Virol. 80, 1629–1636. doi: 10.1128/jvi.80.4.1629-1636.2006 - DOI - PMC - PubMed
-
- Bender R. G., Sirota S. B., Swetschinski L. R., Villanueva Dominguez R.-M., Novotney A., Wool E. E., et al. (2024). Global, regional, and national incidence and mortality burden of non-COVID-19 lower respiratory infections and aetiologies, 1990-2021: a systematic analysis from the Global Burden of Disease Study 2021. Lancet Infect. Dis. 24, 974–1002. doi: 10.1016/s1473-3099(24)00176-2 - DOI - PMC - PubMed
-
- Besteman S. B., Bogaert D., Bont L., Mejias A., Ramilo O., Weinberger D. M., et al. (2024). Interactions between respiratory syncytial virus and Streptococcus pneumoniae in the pathogenesis of childhood respiratory infections: a systematic review. Lancet Respir. Med. 12, 915–932. doi: 10.1016/s2213-2600(24)00148-6 - DOI - PubMed
MeSH terms
Substances
LinkOut - more resources
Full Text Sources
Medical