. 2025 Jun 9:16:1590688.
doi: 10.3389/fphar.2025.1590688. eCollection 2025.

Molecular pharmacokinetic mechanism of quercetin-encapsulated polymeric micelles in alleviating cisplatin-induced nephrotoxicity and enhancing antineoplastic effects

Affiliations

Molecular pharmacokinetic mechanism of quercetin-encapsulated polymeric micelles in alleviating cisplatin-induced nephrotoxicity and enhancing antineoplastic effects

Tangna Hao et al. Front Pharmacol. .

Abstract

Introduction: Cisplatin (DDP), a platinum-based chemotherapy drug, shows broad antineoplastic activity, however, its clinical use is limited by dose-dependent nephrotoxicity, a major challenge in cancer therapy. The purpose of this study was to investigate the mechanism by which quercetin-polyethylene glycol-polycaprolactone (Que-PEG-PCL) micelles simultaneously enhance the cytotoxicity of DDP against cancer cells and reduce its nephrotoxicity.

Methods: Rodent models and HEK293 cells were used to evaluate the renoprotective effects of Que-PEG-PCL micelles. Pharmacokinetics focused on OCT2-mediated renal DDP disposition. Antitumor activity was assessed in CT26 cells and syngeneic tumors. Key assessments included oxidative stress, apoptosis, renal markers, and histopathology.

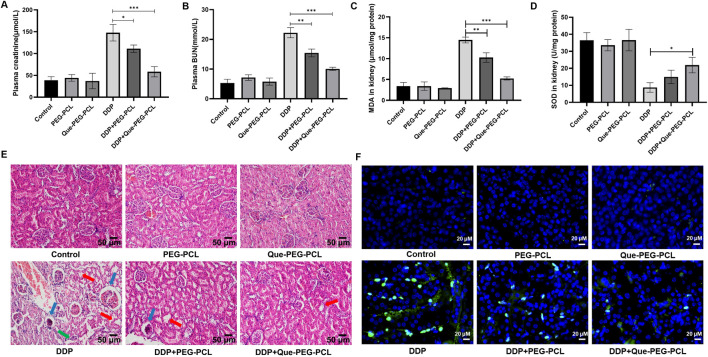
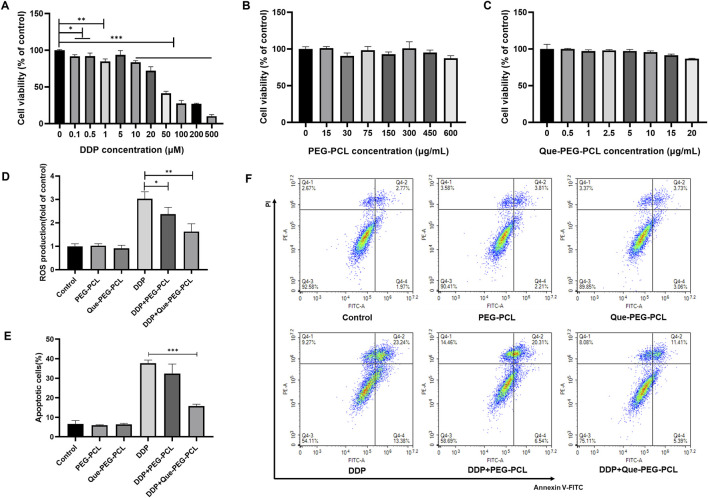
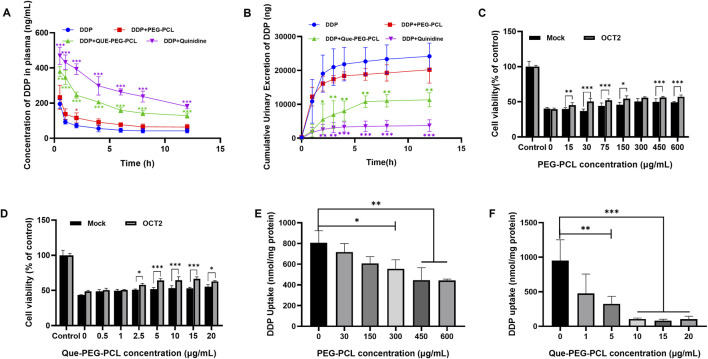
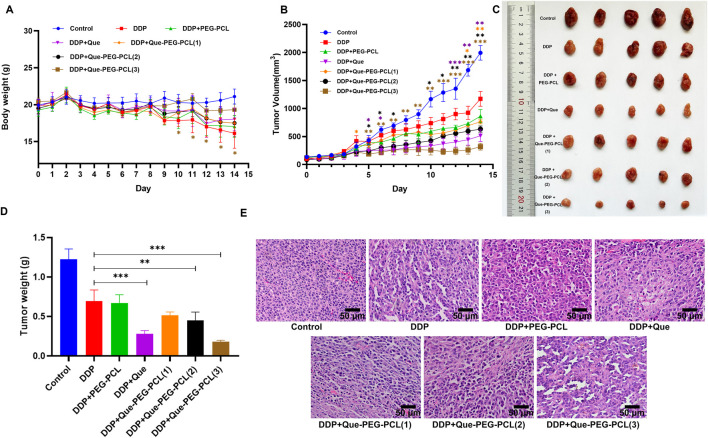
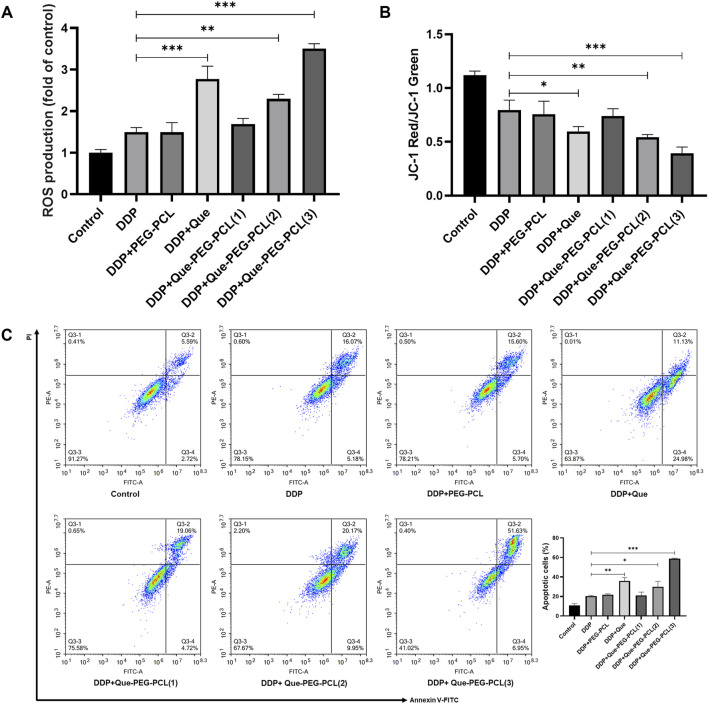
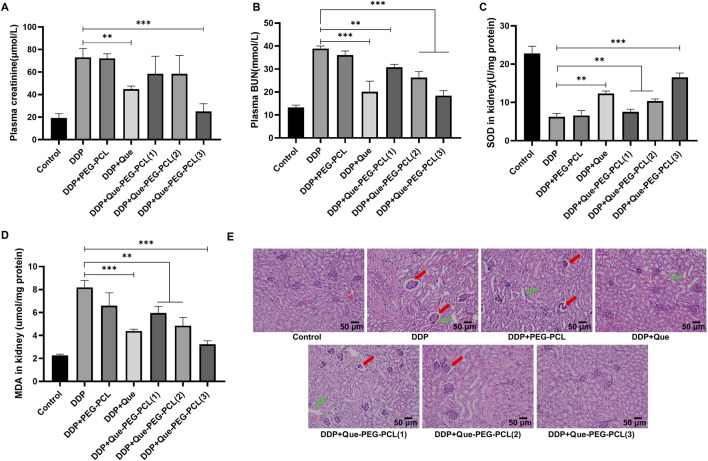
Results: Que-PEG-PCL reduced DDP-induced nephrotoxicity, lowering creatinine and BUN to 42% and 38%. It also reduced oxidative stress and improved antioxidant activity. DDP plasma exposure increased to 323%, with renal clearance reduced to 14%, due to OCT2 inhibition. In a CT26 syngeneic model, combination therapy inhibited tumor volume by 84% compared to control group.

Discussion: Que-PEG-PCL enhanced DDP's therapeutic window by limiting renal accumulation and promoting tumor cell apoptosis. This dual-action strategy provides a novel approach for improving the clinical efficacy of DDP-based cancer therapy.

Keywords: antitumor potency; cisplatin; nephrotoxicity; polymeric micelles; quercetin.


Conflict of interest statement

The authors declare that the research was conducted in the absence of any commercial or financial relationships that could be construed as a potential conflict of interest.

Figures

FIGURE 1
FIGURE 1
(A) 1HNMR spectrum of block polymer PEG-PCL. (B) The typical GPC spectrum of PEG-PCL block copolymer. (C) Size distribution and TEM morphology of PEG-PCL (×200000). (D) Size distribution and TEM morphology of Que-PEG-PCL (×200000).
FIGURE 2
FIGURE 2
Que-PEG-PCL alleviated DDP-induced nephrotoxicity, oxidative stress, and apoptosis in rats. (A) Serum creatinine (Cr), (B) blood urea nitrogen (BUN), (C) malondialdehyde (MDA, oxidative stress marker), (D) superoxide dismutase (SOD, antioxidant enzyme activity). (E) Hematoxylin and eosin (H&E) staining of renal tissues (scale bar: 50 μm). (F) Terminal deoxynucleotidyl transferase dUTP nick end labeling (TUNEL) staining for apoptosis (green: TUNEL-positive cells). Statistical significance is indicated as *p < 0.05, **p < 0.01, ***p < 0.001 compared to the DDP group. Data are presented as mean ± S.D., with n = 3.
FIGURE 3
FIGURE 3
Que-PEG-PCL mitigates DDP-induced ROS production and apoptosis in HEK293 cells. (A) Impact of DDP on the viability of HEK293 cells. (B) Influence of PEG-PCL on the viability of HEK293 cells. (C) Effect of Que-PEG-PCL on the viability of HEK293 cells. (D) Alterations in ROS levels following incubation with PEG-PCL, Que-PEG-PCL, and DDP individually or in combination. (E,F) Influence of PEG-PCL and Que-PEG-PCL on DDP-induced apoptosis in HEK293 cells. Statistical significance is denoted as *p < 0.05, **p < 0.01, ***p < 0.001 compared to the DDP group. Data are presented as mean ± S.D., with n = 3.
FIGURE 4
FIGURE 4
Effects of Que-PEG-PCL on the pharmacokinetics of DDP in rats and effects of OCT2 and DDP on the cytotoxicity and intracellular accumulation of PEG-PCL and Que-PEG-PCL in HEK293 cells and hOCT2-HEK293 cells. (A) Impact of PEG-PCL, Que-PEG-PCL, and Quinidine on the plasma concentration of DDP in rats. (B) Influence of PEG-PCL, Que-PEG-PCL, and Quinidine on the urinary excretion of DDP in rats. The cytotoxicity of PEG-PCL (15–600 μg/mL) (C) and Que-PEG-PCL (D) (0.5–20 μg/mL) in mock- and hOCT2-HEK293 cells. (E,F) Concentration-dependent inhibition curve of PEG-PCL and Que-PEG-PCL on DDP uptake in hOCT2-HEK293 cells. Statistical significance is denoted as *p < 0.05, **p < 0.01, ***p < 0.001 compared to the DDP group. #p < 0.05, #p < 0.01, #p < 0.001 vs. mock cells. Data are presented as mean ± standard deviation (S.D.), with n = 3.
FIGURE 5
FIGURE 5
Influence of Que-PEG-PCL on the antitumor activity of DDP in mice with transplanted tumors. (A) Temporal changes in body weight of CT26 tumor-bearing mice following various therapeutic interventions. (B) Dynamics of tumor volume in CT26 tumor-bearing mice after different treatments. (C) Morphological alterations in tumors in CT26 tumor-bearing mice post-treatment. (D) Variations in tumor weight in CT26 tumor-bearing mice following diverse treatments. (E) Histopathological analysis of tumors in CT26 tumor-bearing mice treated with various formulations, as assessed by hematoxylin-eosin (HE) staining (scale bar: 50 μm). Statistical significance is indicated as *p < 0.05, **p < 0.01, ***p < 0.001 compared to the DDP group. Data are expressed as mean ± standard deviation (S.D.), with n = 3.
FIGURE 6
FIGURE 6
Influence of Que-PEG-PCL on the antitumor activity of DDP in mice with transplanted tumors. (A) Reactive oxygen species (ROS) production measured by DCFH-DA fluorescence. (B) Mitochondrial membrane potential (ΔΨm) assessed by JC-1 staining (red/green fluorescence ratio). (C) Apoptosis rate quantified by flow cytometry (Annexin V/PI staining). Statistical significance is indicated as *p < 0.05, **p < 0.01, ***p < 0.001 compared to the DDP group. Data are expressed as mean ± standard deviation (S.D.), with n = 3.
FIGURE 7
FIGURE 7
Efficacy of Que-PEG-PCL in conjunction with DDP on renal functionality in tumor-bearing mice. Quantitative analysis of serum Cr (A) and BUN (B) levels in CT26 tumor-bearing mice subjected to diverse therapeutic interventions. Determination of SOD (C) and MDA (D) concentrations within renal tissues of CT26 tumor-bearing mice following various treatment regimens. (E) Illustrates the histopathological alterations in renal tissues, as assessed by hematoxylin-eosin (HE) staining, in CT26 tumor-bearing mice treated with assorted formulations. Statistical significance is denoted as **p < 0.01 and ***p < 0.001 relative to the DDP group. Data are represented as mean ± standard deviation, n = 3.

Similar articles

References

    1. Bejoy J., Qian E. S., Woodard L. E. (2022). Tissue culture models of AKI: from tubule cells to human kidney organoids. J. Am. Soc. Nephrol. 33 (3), 487–501. 10.1681/asn.2021050693 - DOI - PMC - PubMed
    1. Bi Y., Wang X., Li H., Tian Y., Han L., Gui C., et al. (2022). 3D-QSAR analysis of the interactions of flavonoids with human organic cation transporter 2. Toxicol. Lett. 368, 1–8. 10.1016/j.toxlet.2022.07.811 - DOI - PubMed
    1. Ciarimboli G. (2014). Membrane transporters as mediators of cisplatin side-effects. Anticancer Res. 34 (1), 547–550. 10.6064/2012/473829 - DOI - PubMed
    1. Conte E., Bresciani E., Rizzi L., Cappellari O., De Luca A., Torsello A., et al. (2020). Cisplatin-induced skeletal muscle dysfunction: mechanisms and counteracting therapeutic strategies. Int. J. Mol. Sci. 21 (4), 1242. 10.3390/ijms21041242 - DOI - PMC - PubMed
    1. Dabeek W. M., Marra M. V. (2019). Dietary quercetin and kaempferol: bioavailability and potential cardiovascular-related bioactivity in humans. Nutrients 11 (10), 2288. 10.3390/nu11102288 - DOI - PMC - PubMed

LinkOut - more resources