. 2025 Jun 9:16:1554987.
doi: 10.3389/fphar.2025.1554987. eCollection 2025.

Revealing the mechanisms of warfarin-induced vascular calcification through metabolomics and network toxicology

Affiliations

Revealing the mechanisms of warfarin-induced vascular calcification through metabolomics and network toxicology

Zhijiao Zhang et al. Front Pharmacol. .

Abstract

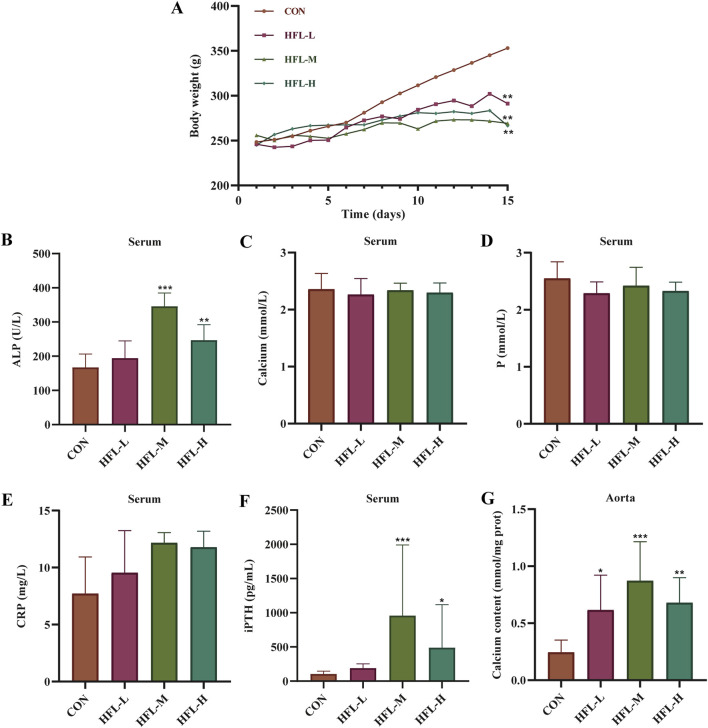
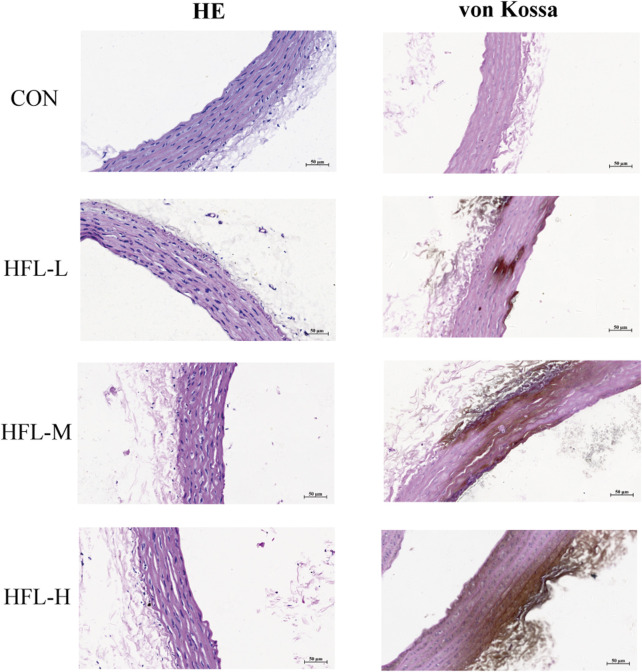
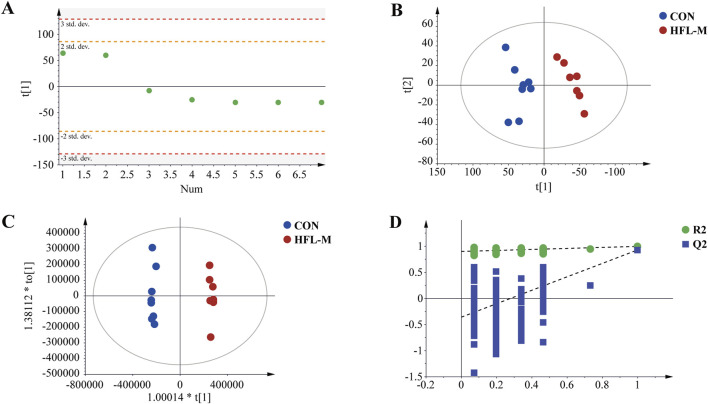
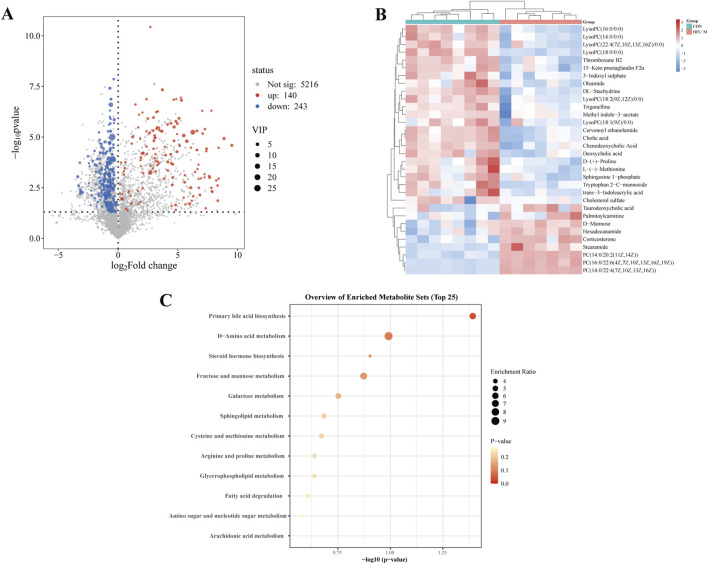
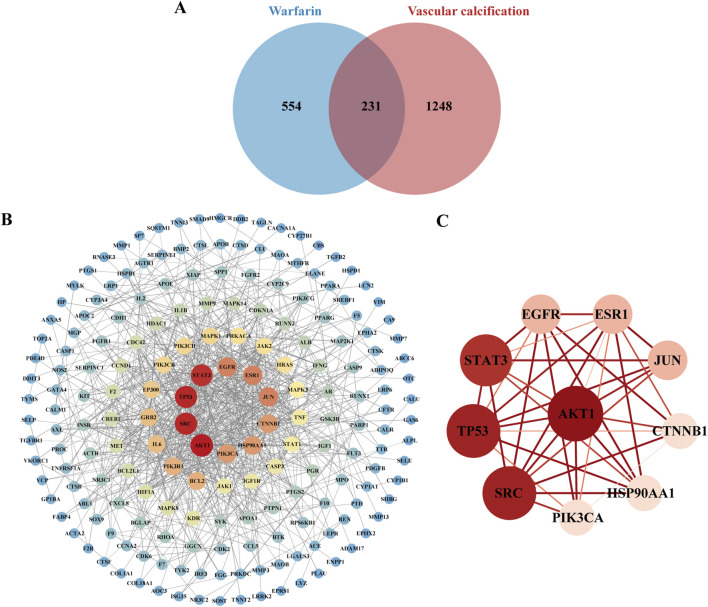
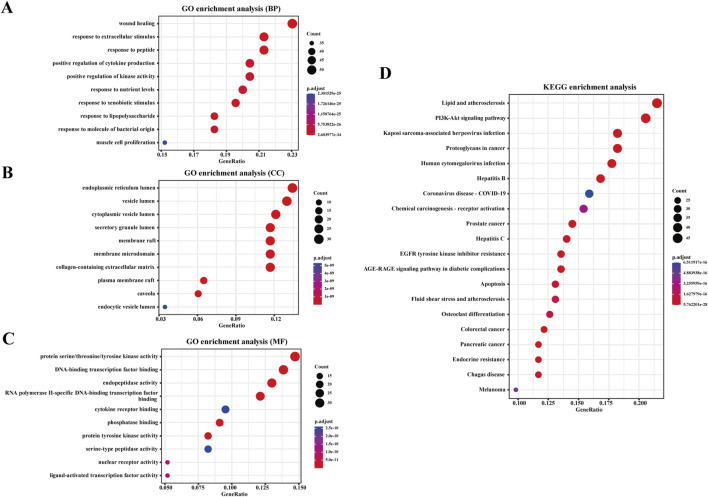
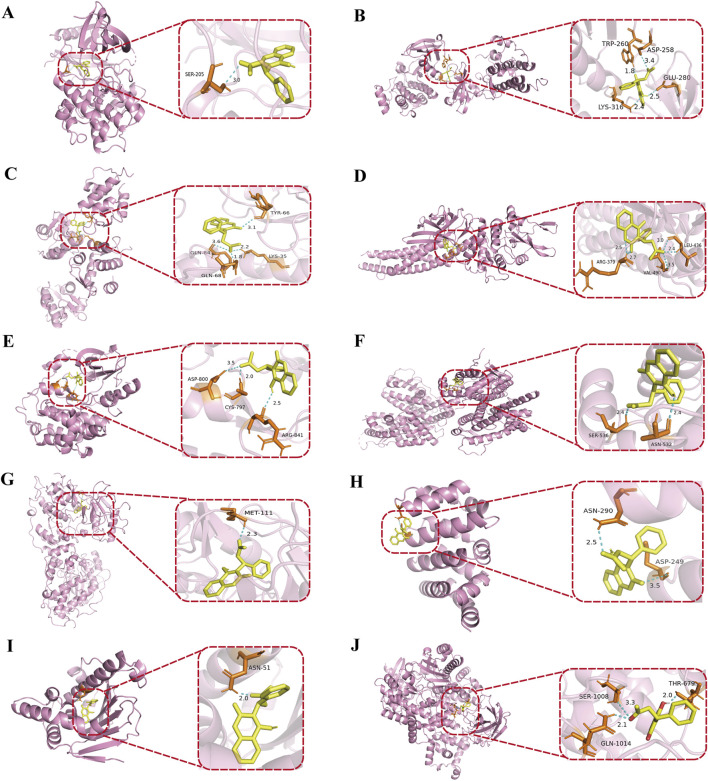
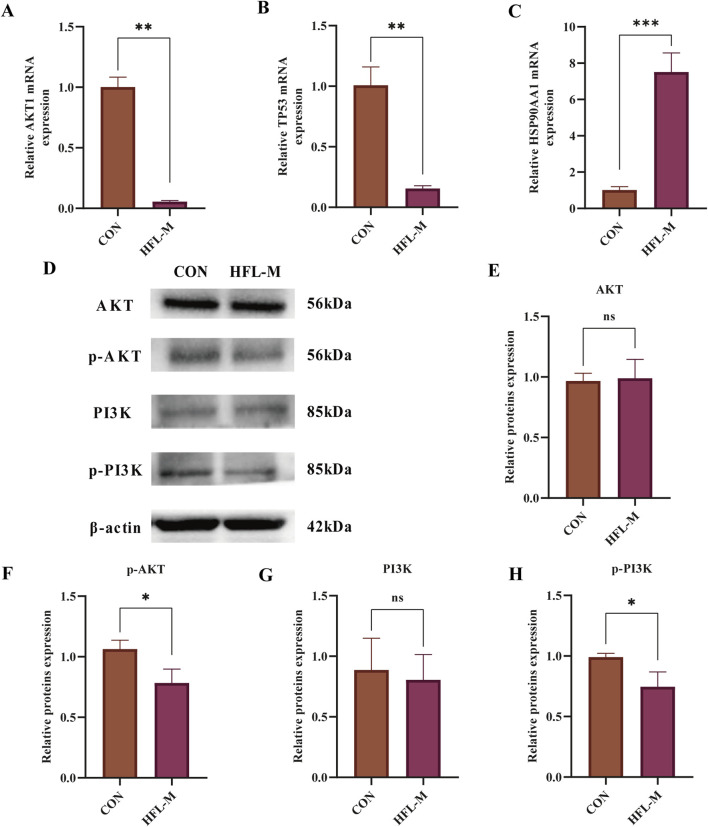
Warfarin is widely used in clinical anticoagulation therapy, but the exact mechanism by which it induces vascular calcification (VC) remains unclear. This study aimed to explore the mechanisms of warfarin-induced VC using metabolomics and network toxicology approaches. Initially, normal rats were orally administered warfarin for 2 weeks, and VC was then assessed by serum biochemistry and histopathology. Subsequently, non-targeted metabolomics was performed to analyze serum metabolite changes. Finally, network toxicology analysis was conducted to identify key targets and signaling pathways associated with warfarin-induced VC, which were further validated using molecular docking, qRT-PCR, and western blot analyses. The results indicated that warfarin induced aortic calcification in rats, and metabolomics identified 32 differential metabolites, mainly involved in pathways such as primary bile acid biosynthesis, steroid hormone biosynthesis, and amino acid metabolism. Network toxicology analysis, molecular docking, and experimental validation showed that warfarin may induce VC by modulating the targets AKT1, TP53, and HSP90AA1, thereby influencing the PI3K-AKT signaling pathway. This study reveals the potential molecular mechanisms underlying warfarin-induced VC, laying a foundation for further mechanistic investigations and providing important insights for the rational clinical application of warfarin.

Keywords: metabolomics; molecular mechanisms; network toxicology; vascular calcification; warfarin.


Conflict of interest statement

The authors declare that the research was conducted in the absence of any commercial or financial relationships that could be construed as a potential conflict of interest.

Figures

FIGURE 1
FIGURE 1
Results of rat body weight and serum biochemical indicators. (A) Body weight change. Changes in the levels of serum alkaline phosphatase (ALP) (B), calcium (Ca) (C), phosphorus (P) (D), C-reactive protein (CRP) (E), and intact parathyroid hormone (iPTH) (F) in different groups. (G) Changes in calcium content within aortic samples of different groups. (Compared with CON group, *p < 0.05, **p < 0.01, ***p < 0.001).
FIGURE 2
FIGURE 2
Effects of different doses of warfarin on aortic calcification in rats. Four groups of rats received the following administration regimens. The first row represents the control group (equal volume of 0.9% NaCl solution). The second row represents to the low-dose warfarin group (15 mg/100 g warfarin and 1.5 mg/100 g vitamin K1). The third row represents the medium-dose warfarin group (20 mg/100 g warfarin and 1.5 mg/100 g vitamin K1). The fourth row represents the high-dose warfarin group (30 mg/100 g warfarin and 1.5 mg/100 g vitamin K1). After 2 weeks of administration, longitudinal sections of each aorta were stained with HE (column 1) and von Kossa staining (column 2). HE staining reveals morphological alterations in the aortic tissue, while the brownish-black areas observed in von Kossa staining indicate calcium salt deposition. (scale bar = 50 μm).
FIGURE 3
FIGURE 3
Metabolomic multivariate statistical analysis. (A) PCA score plot of the QC samples. (B) PCA score plot of the CON and HFL-M groups. (C) OPLS-DA score plot of the CON and HFL-M groups. (D) The 200-permutation tests of OPLS-DA score plot between the CON and HFL-M groups.
FIGURE 4
FIGURE 4
Analysis of differential metabolites in non-targeted metabolomics. (A) Volcano plot of the CON and HFL-M groups. (B) Heat map of serum metabolites in the CON and HFL-M groups. (C) KEGG analysis of metabolic pathways.
FIGURE 5
FIGURE 5
Key targets of warfarin-induced VC. (A) Venn diagram showing the overlapping targets of warfarin and VC. (B) Visualization of the PPI network using Cytoscape. (C) PPI network construction of core targets.
FIGURE 6
FIGURE 6
Enrichment analysis. (A) GO enrichment analysis based on BP, (B) CC, (C) and MF. (D) KEGG enrichment analysis for the overlapping targets of warfarin and VC. The analysis is based on predicted gene targets from public databases.
FIGURE 7
FIGURE 7
Molecular docking of warfarin with core proteins. (A) warfarin with AKT1, (B) warfarin with SRC, (C) warfarin with TP53, (D) warfarin with STAT3, (E) warfarin with EGFR, (F) warfarin with ESR1, (G) warfarin with JUN, (H) warfarin with CTNNB1, (I) warfarin with HSP90AA1, (J) warfarin with PIK3CA. The protein structures were obtained from the PDB: AKT1 (PDB ID: 3QKL), SRC (PDB ID: 1FMK), TP53 (PDB ID: 4IBU), STAT3 (PDB ID: 6NJS), EGFR (PDB ID: 5CNO), ESR1 (PDB ID: 7RRY), JUN (PDB ID: 4D3Q), CTNNB1 (PDB ID: 7AFW), HSP90AA1 (PDB ID: 1UY6), and PIK3CA (PDB ID: 8EXL). In the visualizations, yellow represents warfarin, pink represents the target proteins bound to warfarin, and dashed lines indicate hydrogen bonds.
FIGURE 8
FIGURE 8
The effects of warfarin on the expression of core protein in the aorta of rats. (A–C) qRT-PCR analysis AKT1, TP53 and HSP90AA1 mRNA levels in aorta tissues of rats (n = 3). (D–H) Western blot analysis of AKT and PI3K protein expression in aorta tissues of rats (n = 3). Results are expressed as the mean ± SD. *p <, **p < 0.01, ***p < 0.001 vs. the control group.

Similar articles

References

    1. Andrews J., Psaltis P. J., Bayturan O., Shao M., Stegman B., Elshazly M., et al. (2018). Warfarin use is associated with progressive coronary arterial calcification: insights from serial intravascular ultrasound. JACC Cardiovasc Imaging 11 (9), 1315–1323. 10.1016/j.jcmg.2017.04.010 - DOI - PubMed
    1. Avula V., Mok Y., Ejiri K., Van't Hof J., Whelton S. P., Hoogeveen R. C., et al. (2025). Inflammatory markers and calcification of coronary arteries, aorta and cardiac valves: findings from the atherosclerosis risk in communities study. Am. J. Prev. Cardiol. 21, 100946. 10.1016/j.ajpc.2025.100946 - DOI - PMC - PubMed
    1. Bai Y., Cheng M., Jin J., Zhang H., He L., Zhou W., et al. (2022). SET8, a novel regulator to ameliorate vascular calcification via activating PI3K/Akt mediated anti-apoptotic effects. Biochem. Cell Biol. 100 (2), 104–114. 10.1139/bcb-2021-0322 - DOI - PubMed
    1. Beazley K. E., Deasey S., Lima F., Nurminskaya M. V. (2012). Transglutaminase 2-mediated activation of β-catenin signaling has a critical role in warfarin-induced vascular calcification. Arterioscler. Thromb. Vasc. Biol. 32 (1), 123–130. 10.1161/atvbaha.111.237834 - DOI - PMC - PubMed
    1. Beazley K. E., Eghtesad S., Nurminskaya M. V. (2013). Quercetin attenuates warfarin-induced vascular calcification in vitro independently from matrix Gla protein. J. Biol. Chem. 288 (4), 2632–2640. 10.1074/jbc.M112.368639 - DOI - PMC - PubMed

LinkOut - more resources