. 2025 Jun;14(12):e70985.
doi: 10.1002/cam4.70985.

RPL35A Downregulation Suppresses Hepatocellular Carcinoma Cell Proliferation via NCAPG2 Inactivation

Affiliations

RPL35A Downregulation Suppresses Hepatocellular Carcinoma Cell Proliferation via NCAPG2 Inactivation

Liang Chen et al. Cancer Med. 2025 Jun.

Abstract

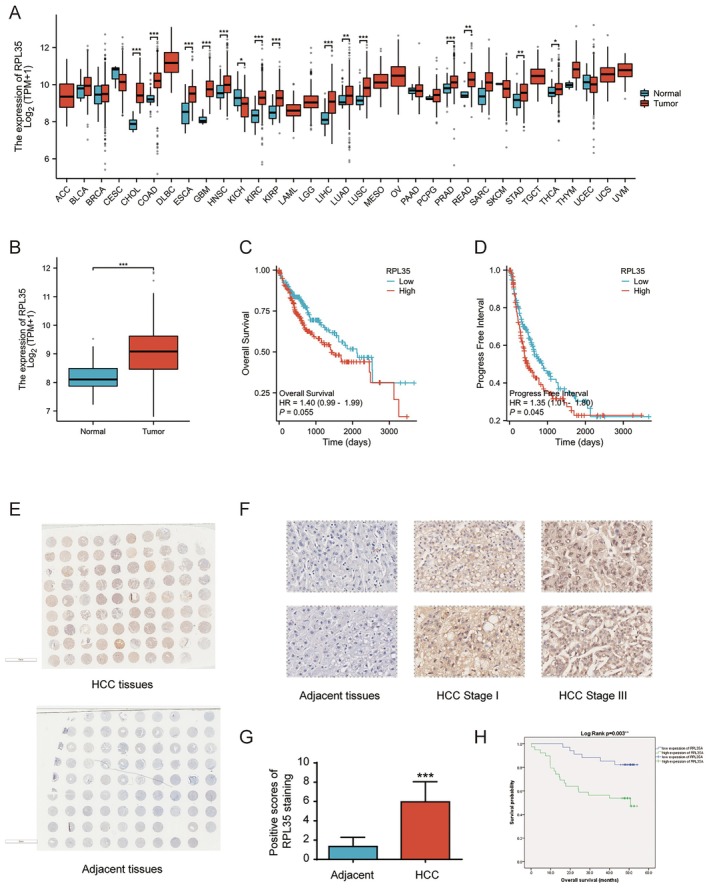
Background: Hepatocellular carcinoma (HCC) is a highly aggressive cancer with a poor prognosis. The molecular mechanisms underlying HCC progression remain poorly understood, prompting the need for novel therapeutic targets. RPL35A, a component of the 60S large ribosomal subunit, is a ribosomal protein involved in ribosome biogenesis and protein synthesis. Beyond its canonical role, increasing evidence suggests that ribosomal proteins such as RPL35A may also exert extraribosomal functions that contribute to tumorigenesis.

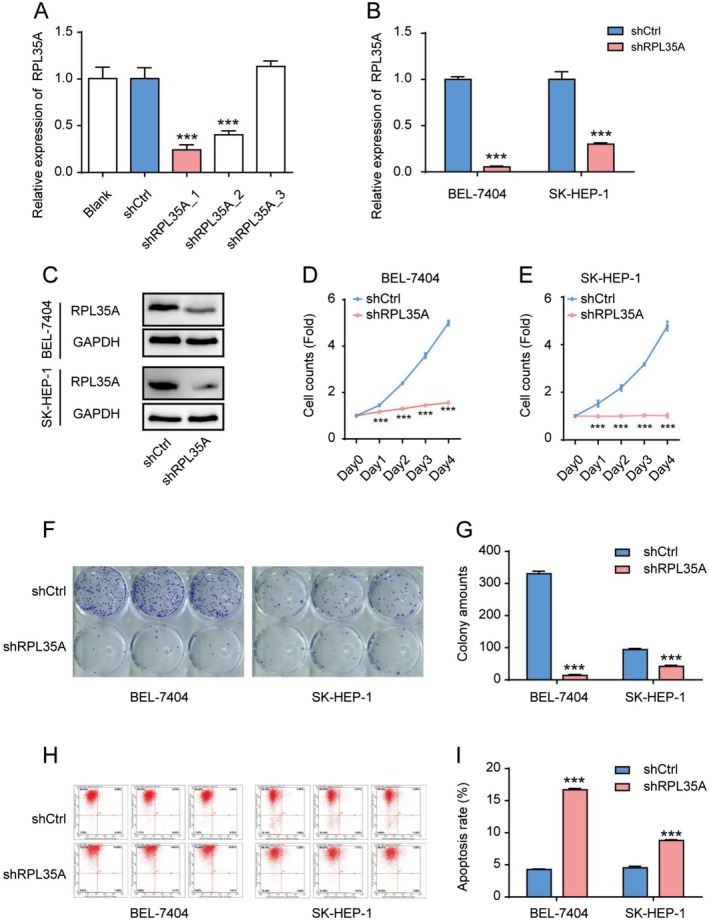
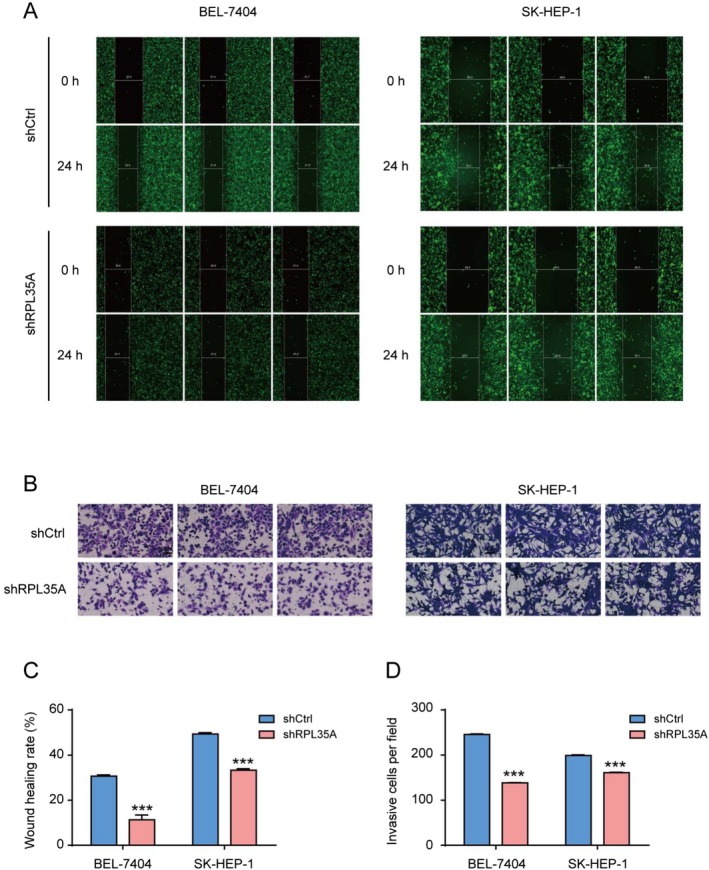
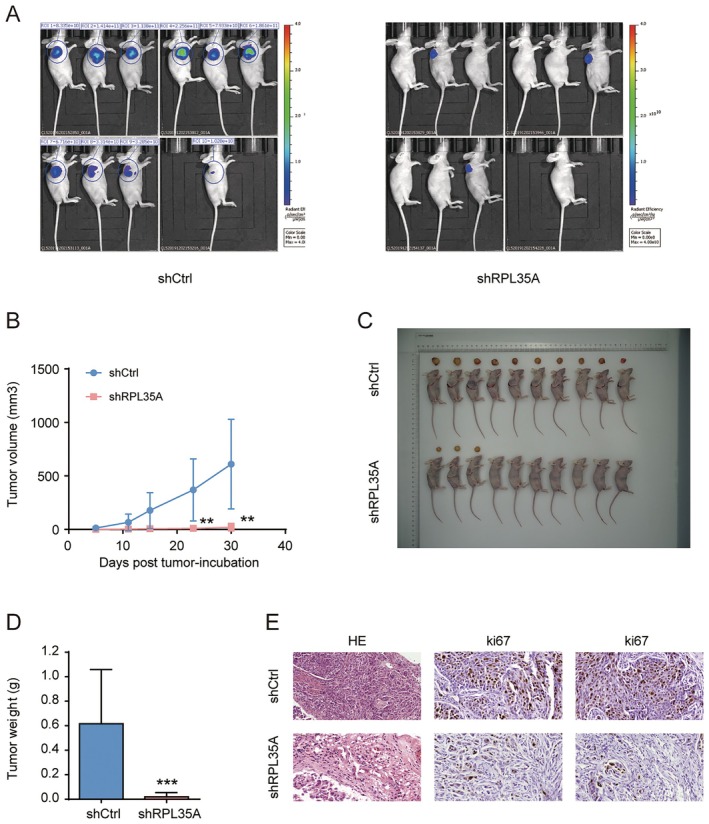
Methods: We investigated RPL35A expression in HCC using tissue samples and cell lines. RPL35A levels were correlated with clinicopathological features and prognosis in HCC patients. In vitro, we manipulated RPL35A expression in HCC cells using shRNA lentiviral vectors and assessed its effects on cell proliferation, migration and apoptosis. In vivo, we evaluated tumor growth using xenograft models. Gene expression analysis was conducted to identify downstream targets of RPL35A.

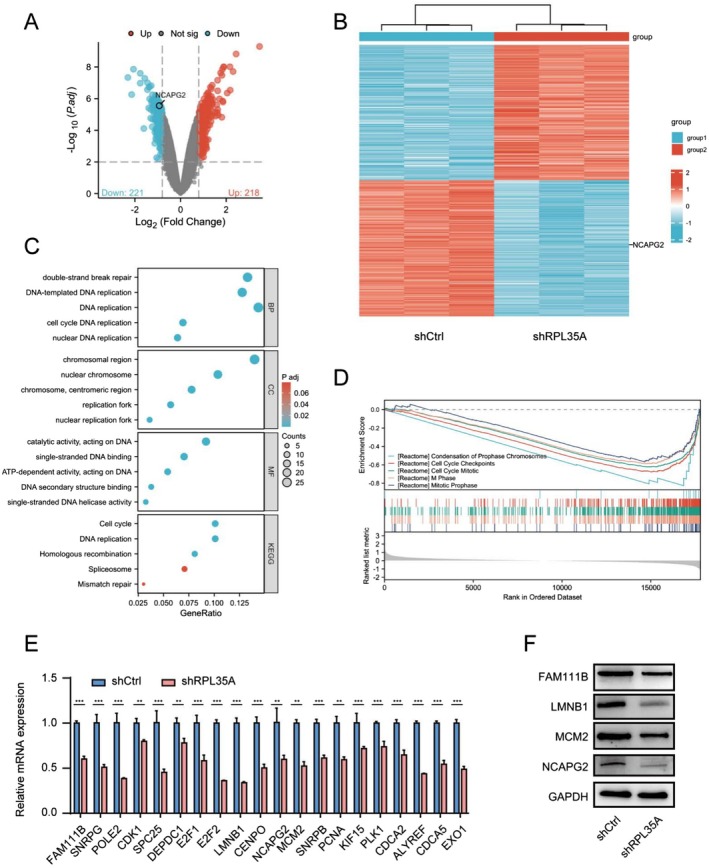
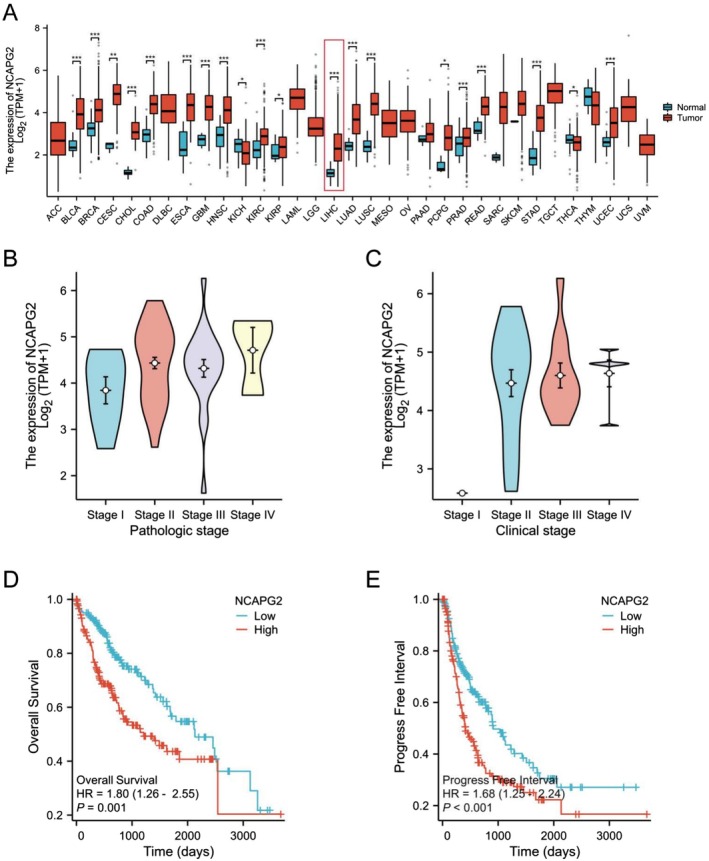
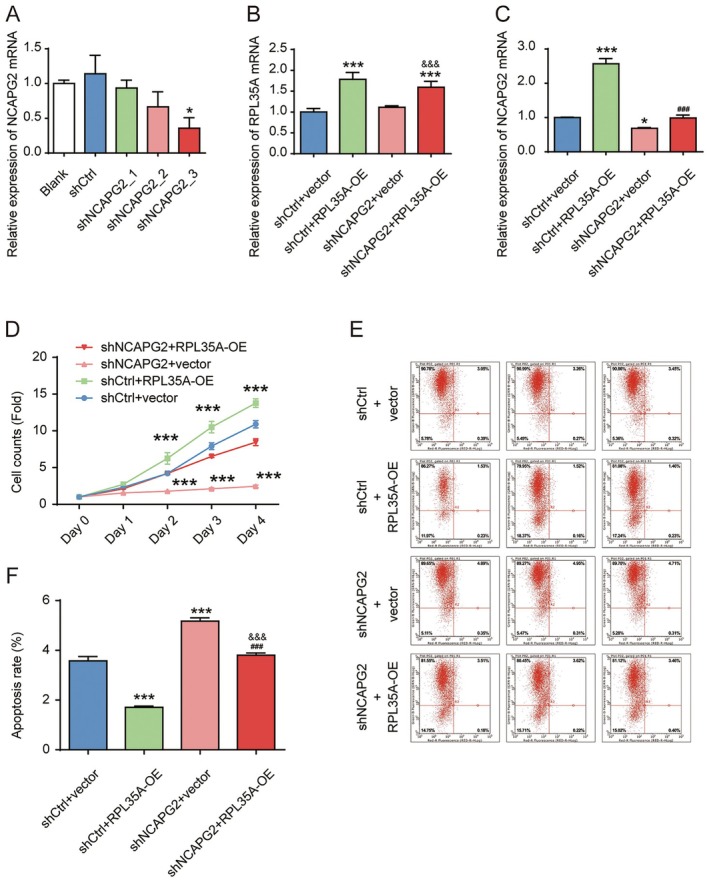
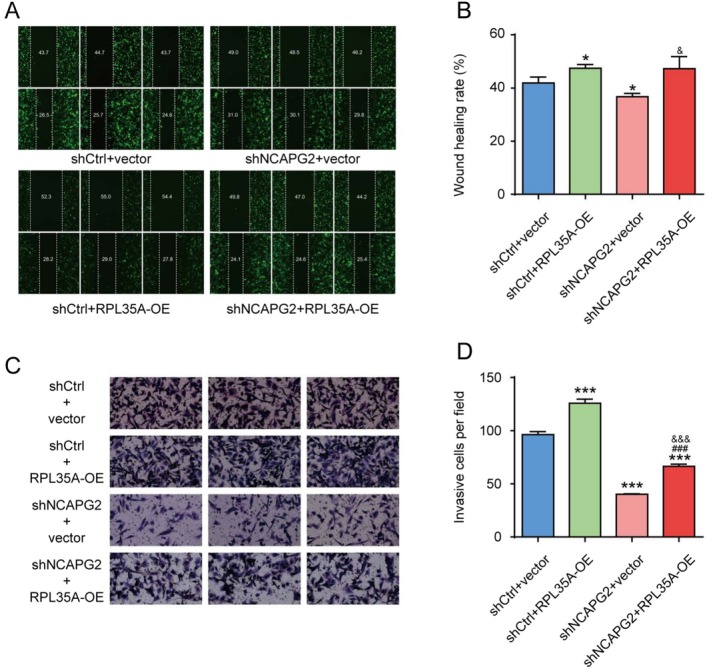
Results: RPL35A was significantly overexpressed in HCC tissues compared to normal liver, correlating with advanced disease stages and poorer prognosis. Knockdown of RPL35A in HCC cells inhibited cell proliferation, migration and invasion, while promoting apoptosis. In vivo, RPL35A silencing reduced tumor growth and size. Gene expression analysis identified NCAPG2 as a key downstream target of RPL35A. NCAPG2 expression was upregulated in HCC, and its knockdown reversed the oncogenic effects of RPL35A. Moreover, RPL35A overexpression increased NCAPG2 levels, promoting tumor progression. These findings suggest that the RPL35A/NCAPG2 axis is crucial in HCC development.

Conclusions: High expression of RPL35A is linked to poor prognosis in hepatocellular carcinoma. The regulation of NCAPG2 by RPL35A may represent a critical mechanism underlying RPL35A-driven tumor progression. Targeting the RPL35A/NCAPG2 pathway may offer a promising therapeutic strategy for HCC treatment.

Keywords: HCC; cell cycle arrest; molecular interplay; therapeutic target; tumor modulation.


Conflict of interest statement

The authors declare no conflicts of interest.

Figures

FIGURE 1
FIGURE 1
Elevated RPL35A expression associated with hepatocellular carcinoma progression and adverse prognosis. (A) RPL35A mRNA expression demonstrated upregulation in various tumor tissues when compared to normal samples, as per data from The Cancer Genome Atlas (TCGA) database. (B) HCC tumor tissues exhibited increased RPL35A expression compared to adjacent normal tissues based on TCGA database. Data are presented as mean with standard deviation. ***p < 0.001. (C) Kaplan–Meier survival analysis illustrates the correlation between RPL35A expression and overall survival in HCC patients according to TCGA database. (D) Kaplan–Meier survival analysis reveals the relationship between RPL35A expression and progression‐free interval among HCC patients according to TCGA database. (E) Photographs of the tissue microarray following immunohistochemistry for RPL35A are presented. (F) Exemplary images of immunohistochemical staining of RPL35A in HCC and adjacent tissues are presented. (G) The staining score for RPL35A in HCC tissues was significantly higher compared to adjacent tissues. Data are presented as mean with standard deviation. *p < 0.05, **p < 0.01, ***p < 0.001. (H) Kaplan–Meier survival analysis demonstrates the association between RPL35A expression and overall survival in HCC patients in our own dataset.
FIGURE 2
FIGURE 2
Knockdown of RPL35A inhibits proliferation and enhances apoptosis in HCC cells. (A) Transfection of BEL‐7404 cells with three shRNAs was conducted, and the efficiency of knockdown was assessed using RT‐qPCR. (B) Knockdown of RPL35A with shRPL35A_1 lentivirus was performed, and RPL35A expression was quantified in both BEL‐7404 and SK‐HEP‐1 cells. (C) Downregulation of RPL35A protein in HCC cells was confirmed through western blot analysis. (D, E) Cell counts assessed via the Celigo method confirmed decreased cell viability in shRPL35A‐treated HCC cells compared to the shCtrl group. (F) Colony formation assay further verified reduced cell viability in shRPL35A HCC cells relative to the shCtrl group. (G) The number of colonies corroborated the diminished cell viability in shRPL35A HCC cells compared to the shCtrl group. (H) Annexin V staining and subsequent flow cytometric analysis depicted changes in apoptosis rates following RPL35A knockdown. (I) Statistical analysis of cell apoptosis rates after shRPL35A and shCtrl virus infections, demonstrating a significant increase in apoptosis rates following RPL35A knockdown. Data are represented as the mean with standard deviation. ***p < 0.001.
FIGURE 3
FIGURE 3
RPL35A knockdown reduces migration and invasion in HCC cells. (A) Images of cells following scratch assays were captured to assess the wound healing capacity of cells with altered RPL35A expression. (B) Statistical analysis of cell wound healing rates post shRPL35A and shCtrl virus infections, revealing a significant decrease in cell migration following RPL35A knockdown. (C) Images of cells that traversed Matrigel and Transwell membranes were stained to evaluate the invasive potential of cells with modified RPL35A expression. (D) Statistical analysis of the number of cells that traversed the chamber following shRPL35A and shCtrl virus infections, demonstrating a significant reduction in cell invasion after RPL35A knockdown. Data are represented as the mean with standard deviation. ***p < 0.001.
FIGURE 4
FIGURE 4
RPL35A knockdown suppresses HCC tumorigenesis in vivo. (A) Live fluorescence images of xenografts taken 28 days post‐injection of SK‐HEP‐1 cells were presented. (B) Measurement of tumor volumes confirmed inhibited tumor growth in mice injected with shRPL35A‐transfected cells. (C) Depictions of sacrificed mice and excised tumor tissues were presented. (D) Tumor weight significantly reduced in the shRPL35A group compared to the shCtrl group. (E) IHC staining of isolated tumor tissues corroborated the downregulation of ki67 in the shRPL35A group compared to the shCtrl group. Data are represented as the mean with standard deviation. **p < 0.01, ***p < 0.001.
FIGURE 5
FIGURE 5
NCAPG2 was downregulated in SK‐HEP‐1 cells after silencing of RPL35A. (A) A mRNA microarray analysis was conducted to identify dysregulated genes after RPL35A knockdown, and the volcano plot illustrates the differentially expressed genes. (B) A heatmap displays differentially expressed genes. (C) Functional enrichment analysis through Gene Ontology (GO) and Kyoto Encyclopedia of Genes and Genomes (KEGG) pathways highlights the pathways that are suppressed after RPL35A knockdown. (D) Gene Set Enrichment Analysis (GSEA) reveals the deactivation of pathways associated with the cell cycle after RPL35A knockdown. (E) Validation of the downregulated genes, as selected by the microarray, was performed using RT‐qPCR. (F) Western blot analysis further validates the downregulation of selected genes, as identified by the microarray. Data are shown as the mean with standard deviation. **p < 0.01, ***p < 0.001.
FIGURE 6
FIGURE 6
Elevated NCAPG2 expression is associated with hepatocellular carcinoma progression and adverse prognosis. (A) Expression levels of NCAPG2 mRNA were notably elevated in various tumor tissues when compared to their respective normal samples, as indicated by data from the TCGA database. (B) In the context of pathologic staging, expression of NCAPG2 was significantly higher in stages II, III, or IV compared to stage I. (C) Concerning clinical staging, expression of NCAPG2 was substantially higher in stages II, III, or IV compared to stage I. (D) Kaplan–Meier survival analysis underscores the correlation between NCAPG2 expression and overall survival among HCC patients. (E) Kaplan–Meier survival analysis highlights the relationship between NCAPG2 expression and progression‐free interval in HCC patients. Data are shown as the mean with standard deviation. *p < 0.05, **p < 0.01, ***p < 0.001.
FIGURE 7
FIGURE 7
Knockdown of NCAPG2 rescued the proliferation‐promoting effect induced by overexpression of RPL35A in SK‐HEP‐1 cells. (A) BEL‐7404 cells were transfected with three different shRNAs, and the effectiveness of NCAPG2 knockdown was assessed through RT‐qPCR. (B) The expression of RPL35A in BEL‐7404 cells was examined following transfection with NCAPG2 shRNA or the RPL35A overexpression vector. (C) The expression of NCAPG2 in BEL‐7404 cells was measured following transfection with NCAPG2 shRNA or the RPL35A overexpression vector. (D) Cell viability was quantified using the Celigo method, demonstrating the impact of NCAPG2 and RPL35A on BEL‐7404 cells. (E) Flow cytometry was employed to determine the apoptosis rate in BEL‐7404 cells with varying levels of NCAPG2 and RPL35A expression. (F) Statistical analysis of the apoptosis rate in BEL‐7404 cells was provided. *p < 0.05, ***p < 0.001 compared to shCtrl+Vector group. ###p < 0.001 compared to shCtrl+RPL35A_OE group. &&&p < 0.001 compared to shNCAPG2 + vector group.
FIGURE 8
FIGURE 8
Knockdown of NCAPG2 rescued the metastasis‐promoting effect induced by overexpression of RPL35A in SK‐HEP‐1 cells. (A) Cell migration was assessed using the wound healing method, illustrating the influence of NCAPG2 and RPL35A on SK‐HEP‐1 cells. (B) Wound healing rates were quantified to demonstrate the effect of NCAPG2 and RPL35A on cell migration. (C) Cell invasion was evaluated using the Transwell method, revealing the influence of NCAPG2 and RPL35A on SK‐HEP‐1 cells. (D) The number of infiltrated cells was quantified to illustrate the impact of NCAPG2 and RPL35A on cell migration. *p < 0.05, ***p < 0.001 compared to shCtrl+Vector group. ###p < 0.001 compared to shCtrl+RPL35A_OE group. &p < 0.05, &&&p < 0.001 compared to shNCAPG2 + vector group.

Similar articles

References

    1. Su G. L., Altayar O., O'Shea R., et al., “AGA Clinical Practice Guideline on Systemic Therapy for Hepatocellular Carcinoma,” Gastroenterology 162, no. 3 (2022): 920–934. - PubMed
    1. Sapisochin G. and Bruix J., “Liver Transplantation for Hepatocellular Carcinoma: Outcomes and Novel Surgical Approaches,” Nature Reviews Gastroenterology & Hepatology 14, no. 4 (2017): 203–217. - PubMed
    1. Maki H. and Hasegawa K., “Advances in the Surgical Treatment of Liver Cancer,” Bioscience Trends 16, no. 3 (2022): 178–188. - PubMed
    1. Sung H., Ferlay J., Siegel R. L., et al., “Global Cancer Statistics 2020: GLOBOCAN Estimates of Incidence and Mortality Worldwide for 36 Cancers in 185 Countries,” CA: A Cancer Journal for Clinicians 71, no. 3 (2021): 209–249. - PubMed
    1. Sun H., Yang H., and Mao Y., “Personalized Treatment for Hepatocellular Carcinoma in the Era of Targeted Medicine and Bioengineering,” Frontiers in Pharmacology 14 (2023): 1150151. - PMC - PubMed

MeSH terms

Substances