. 2025 Jun 24:13:RP99290.
doi: 10.7554/eLife.99290.

Neural dynamics of visual working memory representation during sensory distraction

Affiliations

Neural dynamics of visual working memory representation during sensory distraction

Jonas Karolis Degutis et al. Elife. .

Abstract

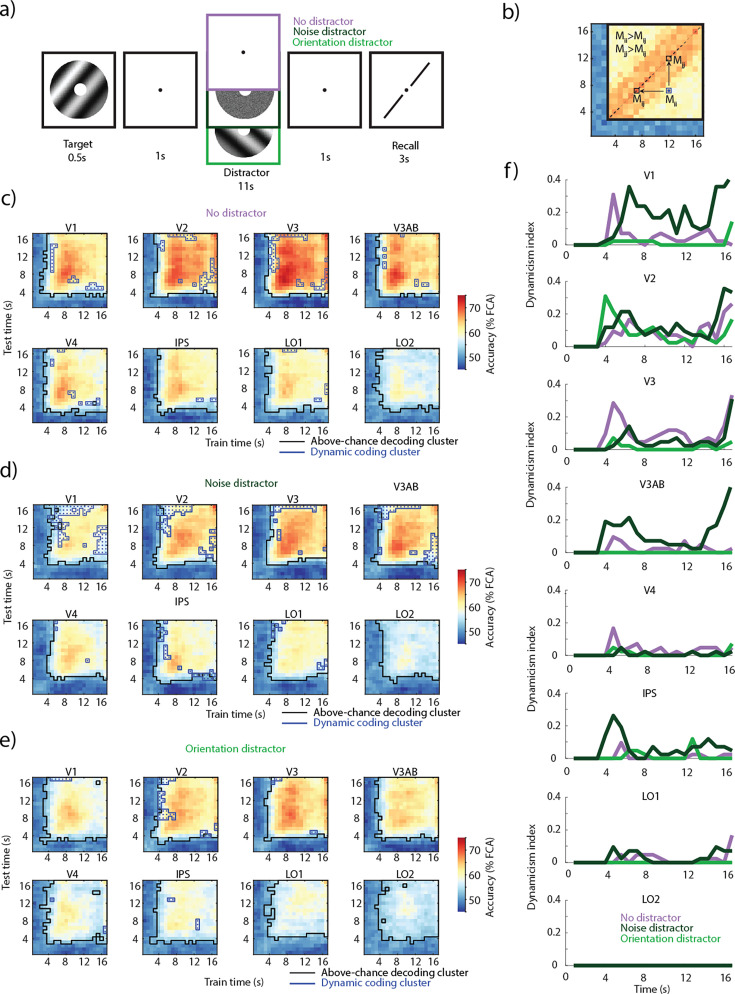
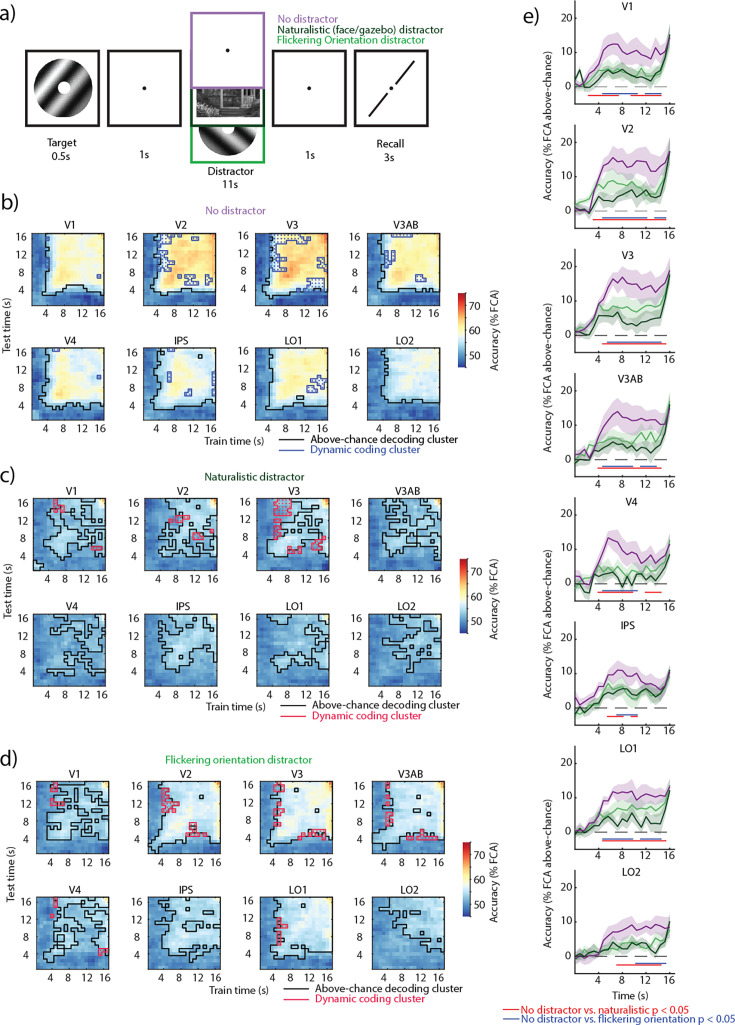
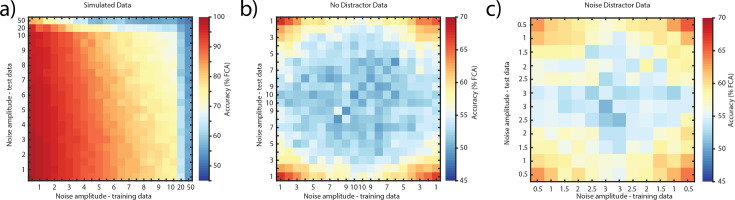
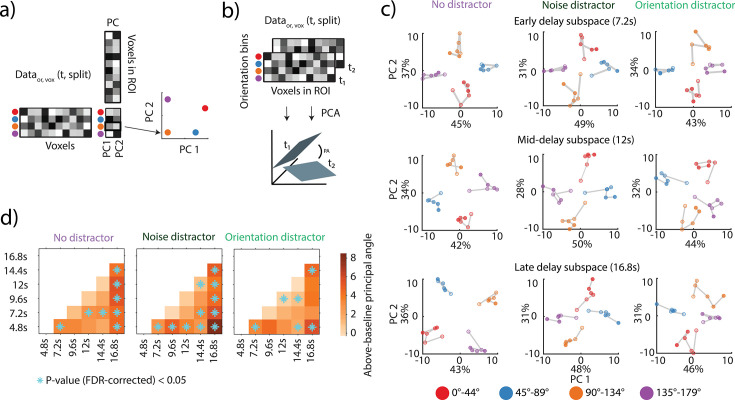
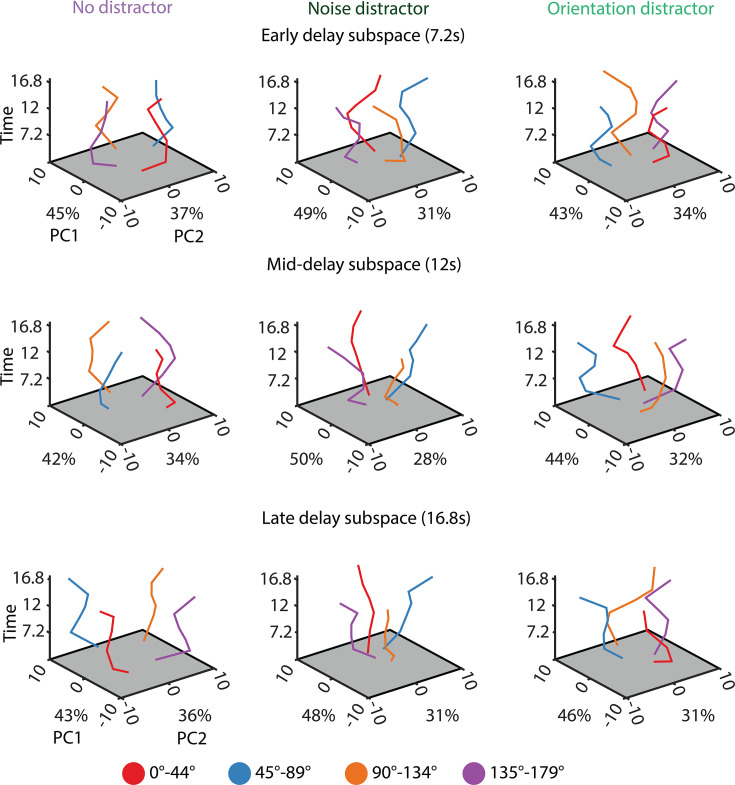
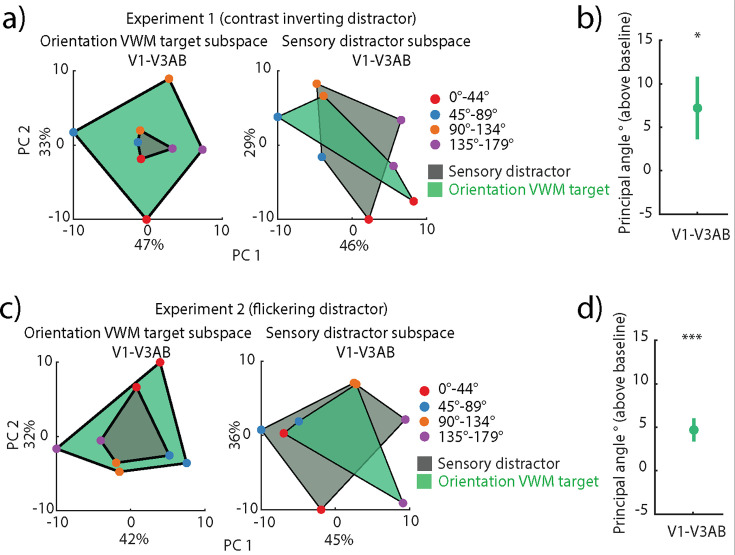
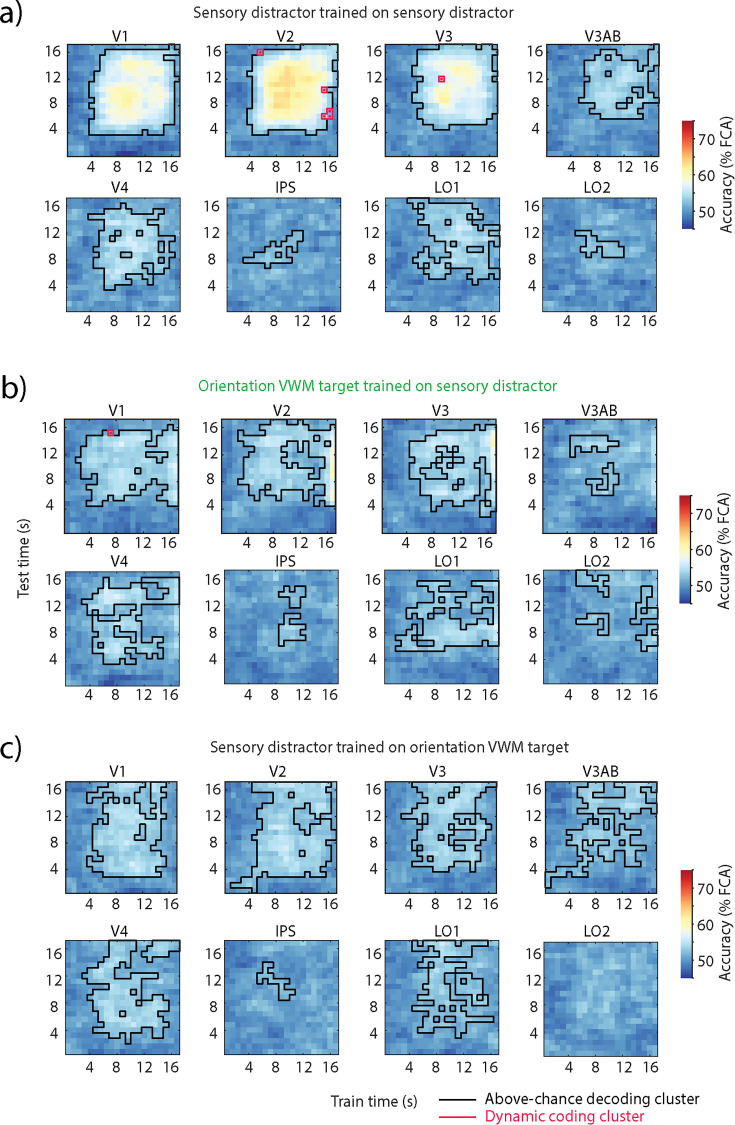
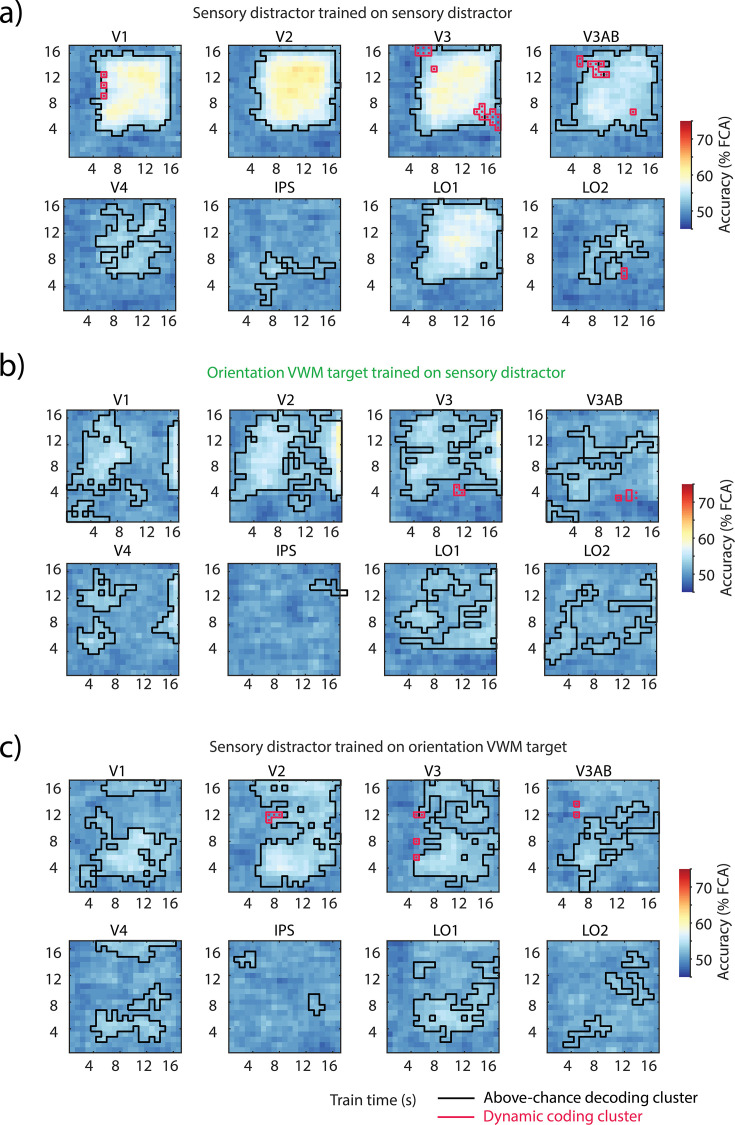
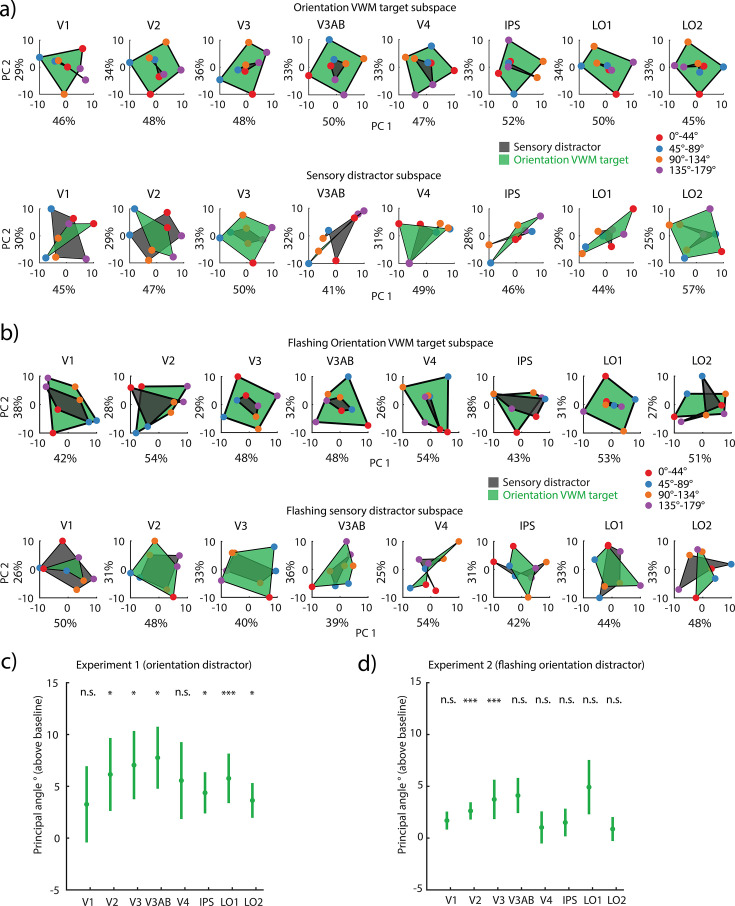
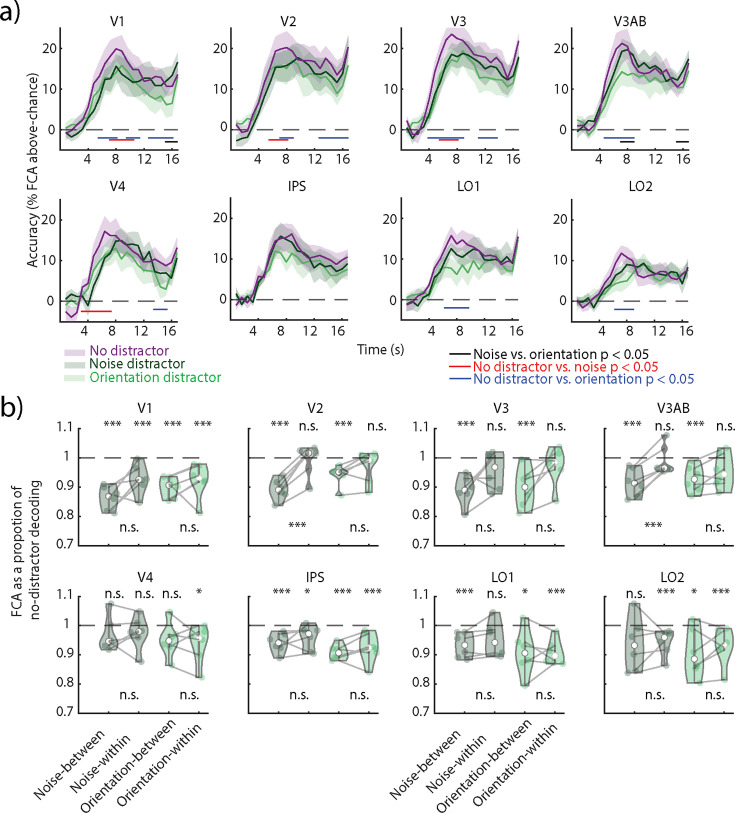
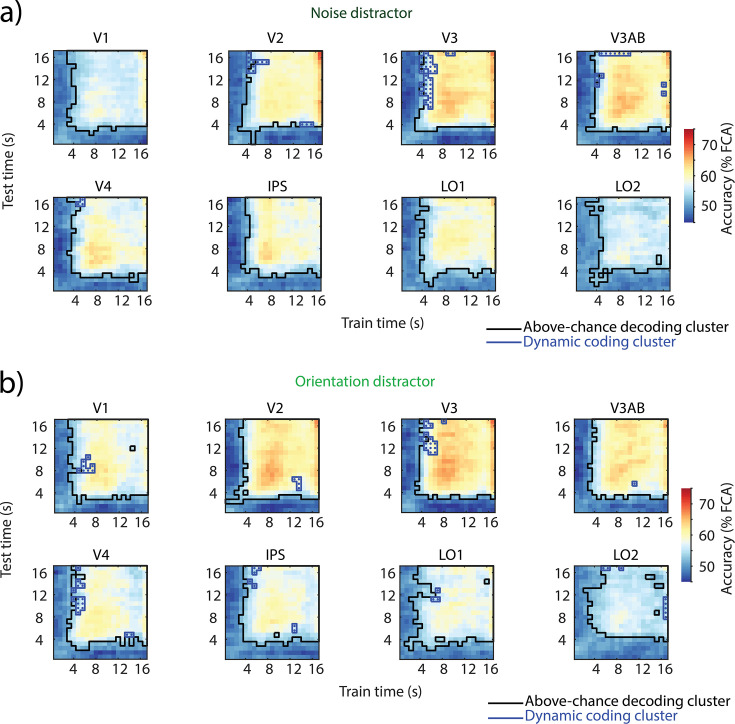
Recent studies have provided evidence for the concurrent encoding of sensory percepts and visual working memory (VWM) contents across visual areas; however, it has remained unclear how these two types of representations are concurrently present. Here, we reanalyzed an open-access fMRI dataset where participants memorized a sensory stimulus while simultaneously being presented with sensory distractors. First, we found that the VWM code in several visual regions did not fully generalize between different time points, suggesting a dynamic code. A more detailed analysis revealed that this was due to shifts in coding spaces across time. Second, we collapsed neural signals across time to assess the degree of interference between VWM contents and sensory distractors, specifically by testing the alignment of their encoding spaces. We find that VWM and feature-matching sensory distractors are encoded in coding spaces that do not fully overlap, but the separation decreases when distractors negatively impact behavioral performance in recalling the target. Together, these results indicate a role of dynamic coding and temporally stable coding spaces in helping multiplex perception and VWM within visual areas.

Keywords: dynamic coding; human; neural subspaces; neuroscience; sensory distraction; working memory.


Conflict of interest statement

JD, SW, JS, JH No competing interests declared

Figures

Figure 1.
Figure 1.. Task and temporal cross-decoding.
(a) On each trial, an oriented grating was presented for 0.5 s followed by a delay period of 13 s (Rademaker et al., 2019). In a third of the trials, a noise distractor was presented for 11 s during the middle of the delay; in another third, another orientation grating was presented; one-third of trials had no-distractor during the delay. (b) Illustration of dynamic coding elements. An off-diagonal element had to have a lower decoding accuracy compared to both corresponding diagonal elements (see Methods for details). (c) Temporal generalization of the multivariate code encoding VWM representations in three conditions across occipital and parietal regions. Across-participant mean temporal cross-decoding of no-distractor trials. Black outlines: matrix elements showing above-chance decoding (cluster-based permutation test; p<0.05). Blue outlines with dots: dynamic coding elements; parts of the cross-decoding matrix where the multivariate code fails to generalize (off-diagonal elements having lower decoding accuracy than their corresponding two diagonal elements; conjunction between two cluster-based permutation tests; p<0.05). (d) Same as c, but noise distractor trials. (e) Same as c, but orientation distractor trials. (f) Dynamicism index; the proportion of dynamic coding elements across time. High values indicate a dynamic non-generalizing code, while low values indicate a generalizing code. Time indicates the time elapsed since the onset of the delay period.
Figure 1—figure supplement 1.
Figure 1—figure supplement 1.. Task and temporal cross-decoding of Experiment 2.
(a) On each trial, an oriented grating was presented for 0.5 s followed by a delay period of 13 s. In a third of the trials, a naturalistic distractor was presented for 11 s during the middle of the delay; in another third, a flickering orientation grating was presented; one-third of trials had no-distractor during the delay. (b) Temporal generalization of the multivariate code encoding visual working memory (VWM) representations in three conditions across occipital and parietal regions. Across-participant mean temporal cross-decoding of no-distractor trials. Black outlines: matrix elements showing above-chance decoding (cluster-based permutation test; p<0.05). Blue outlines with dots: dynamic coding elements; parts of the cross-decoding matrix where the multivariate code fails to generalize (off-diagonal elements having lower decoding accuracy than their corresponding two diagonal elements; conjunction between two cluster-based permutation tests; p<0.05). (c) Same as b, but noise distractor trials. Dynamic coding elements depicted in red. (d) Same as c, but orientation distractor trials. (e) Decoding accuracy (feature continuous accuracy [FCA]) across time for train and test on no-distractor trials (purple), train and test on naturalistic distractor trials (dark green), and train and test on flickering orientation distractor trials (light green). Horizontal lines indicate clusters where there is a difference between two time courses (all clusters p<0.05; nonparametric cluster permutation test, see color code on the right).
Figure 1—figure supplement 2.
Figure 1—figure supplement 2.. Simulations.
(a) Signal-to-noise ratio (SNR)-dependent decoding accuracy, obtained from simulated voxel responses. SNR decreases from left to right (training axis) and bottom to top (testing axis). (b) SNR-dependent decoding accuracy, obtained from no-distractor data from Experiment 1. SNR first decreases and then increases in both training and test axes. (c) SNR-dependent decoding accuracy, obtained from noise distractor data from Experiment 1. SNR first decreases and then increases in both training and test axes.
Figure 1—figure supplement 3.
Figure 1—figure supplement 3.. Selected voxels.
Top: Experiment 1. Number of voxels (left) and proportion of voxels selected in a region of interest (ROI) (right). Error bars indicate SEM across participants. Bottom: same as top, but for Experiment 2.
Figure 2.
Figure 2.. Assessing the dynamics of neural subspaces in V1-V3AB.
(a) Schematic illustration of the neural subspace analysis. A given data matrix (voxels × orientation bins) was subjected to a principal components analysis (PCA), and the first two dimensions were used to define a neural subspace onto which a left-out test data matrix was projected. This resulted in a matrix of two coordinates for each orientation bin and was visualized (see right). The x and y axes indicate the first two principal components. Each color depicts an angular bin. (b) Schematic illustration of the calculation of an above-baseline principal angle (aPA). A principal angle (PA) is the angle between the 2D PCA-based neural subspaces (as in a) for two different time points t1, t2. A small angle would indicate alignment of coding spaces; an angle of above-baseline would indicate a shift in the coding space. The aPA is the angle for a comparison between two time points (t1, t2) minus the angle between cross-validated pairs of the same time points. (c) Each row shows a projection that was estimated for one of two time ranges (middle and late delay) and then applied to all time points (using independent, split-half cross-validated data). Opacity increases from early to late time points. For visualization purposes, the subspaces were estimated on a participant-aggregated region of interest (ROI) (Li and Curtis, 2023). The axes represent the first two principal components, with labels indicating the percent of total explained variance. Figure 2—figure supplement 1 depicts the same projections as neural trajectories. (d) aPA between all pairwise time point comparisons (nonparametric permutation test against null; FDR-corrected p<0.05) averaged across 1000 split-half iterations. Corresponding p-values can be found in Supplementary file 1, table S1.
Figure 2—figure supplement 1.
Figure 2—figure supplement 1.. Neural trajectories across time.
Same as Figure 2c, but the time dimension is on the z axis.
Figure 3.
Figure 3.. Generalization between target and distractor codes in orientation distractor visual working memory (VWM) trials in V1-V3AB.
(a) Left: projection of left-out target (green) and sensory distractor (gray) onto an orientation VWM target neural subspace. Right: same as left, but the projections are onto the sensory distractor subspace. The axes represent the first two principal components, with labels indicating the percent of total explained variance. (b) Principal angle between the sensory distractor and orientation VWM target subspaces (p=0.0297, one-tailed permutation test of sample mean), averaged across 1000 split-half iterations. Error bars indicate SEM across participants. (c) Same as a, but for flickering orientation distractor trials in the second experiment. (d) Same as b, but for flickering orientation distractor trials in the second experiment (p<0.001, one-tailed permutation test of sample mean). The same figure for individual regions of interest (ROIs) can be seen in Figure 3—figure supplement 3.
Figure 3—figure supplement 1.
Figure 3—figure supplement 1.. Temporal cross-decoding of distractor and memory target in orientation distractor trials in Experiment 1.
(a) Across-participant mean temporal cross-decoding of the sensory distractor. Black outlines: matrix elements showing above-chance decoding (cluster-based permutation test; p<0.05). Blue outlines with dots: dynamic coding element (conjunction between two cluster-based permutation tests; p<0.05). (b) Same as a, but the decoder was trained on the target and tested on the sensory distractor in orientation visual working memory (VWM) trials. (c) Same as a, but trained on the sensory distractor and tested on the target.
Figure 3—figure supplement 2.
Figure 3—figure supplement 2.. Temporal cross-decoding of distractor and memory target in flickering orientation distractor trials in Experiment 2.
(a) Across-participant mean temporal cross-decoding of the sensory distractor. Black outlines: matrix elements showing above-chance decoding (cluster-based permutation test; p<0.05). Red outlines with dots: dynamic coding element (conjunction between two cluster-based permutation tests; p<0.05). (b) Same as a, but the decoder was trained on the target and tested on the sensory distractor in orientation visual working memory (VWM) trials. (c) Same as a, but trained on the sensory distractor and tested on the target.
Figure 3—figure supplement 3.
Figure 3—figure supplement 3.. Stable coding spaces of memory target and distractor in each region of interest (ROI).
(a) Experiment 1. Left: projection of left-out target (green) and sensory distractor (gray) onto an orientation visual working memory (VWM) target neural subspace. Right: same as left, but the projections are onto the sensory distractor subspace. (b) Experiment 2. Same as a, but for flickering orientation distractor trials. (c) Experiment 1. Principal angle between the sensory distractor and orientation VWM target subspaces in each ROI (from V1 to LO2: p=0.019, 0.045, 0.034, 0.034, 0.109, 0.045, 0, 0.034; one-tailed permutation test of sample mean, FDR-corrected), averaged across 1000 split-half iterations. Error bars indicate SEM across participants. (d) Experiment 2. Same as c but for flickering orientation distractor trial (from V1 to LO2: p=0.078, 0, 0, 0.078, 0.263, 0.214, 0.177, 0.263; one-tailed permutation test of sample mean, FDR-corrected).
Figure 4.
Figure 4.. Cross-decoding between distractor and no-distractor conditions in Experiment 1.
(a) Decoding accuracy (feature continuous accuracy [FCA]) across time for train and test on no-distractor trials (purple), train and test on noise distractor trials (dark green), and train and test on orientation distractor trials (light green). Horizontal lines indicate clusters where there is a difference between two time courses (all clusters p<0.05; nonparametric cluster permutation test, see color code on the right). (b) Decoding accuracy as a proportion of no-distractor decoding estimated on the averaged delay period (4–16.8 s). Nonparametric permutation tests compared the decoding accuracy of each analysis to the no-distractor decoding baseline (indicated as a dashed line) and between a decoder trained and tested on distractor trials (noise- or orientation-within) and a decoder trained on no-distractor trials and tested on distractor trials (noise- or orientation-cross). FDR-corrected across regions of interest (ROIs). *p<0.05, ***p<0.001. Corresponding p-values can be found in Supplementary file 1, table S2.
Figure 4—figure supplement 1.
Figure 4—figure supplement 1.. Temporal cross-decoding generalization between distractor and no-distractor visual working memory (VWM) trials.
(a) Across-participant mean temporal cross-decoding of noise distractor trials when trained on no-distractor trials. (b) Same as a, but orientation distractor trials trained on no-distractor trials.
Figure 4—figure supplement 2.
Figure 4—figure supplement 2.. Cross-decoding between distractor and no-distractor conditions in Experiment 2.
Decoding accuracy as a proportion of no-distractor decoding estimated on the averaged delay period (4–16.8 s). Nonparametric permutation tests compared the decoding accuracy of each analysis to the no-distractor decoding baseline (indicated as a dashed line) and between a decoder trained and tested on distractor trials (noise- or orientation-within) and a decoder trained on no-distractor trials and tested on distractor trials (noise- or orientation-cross). FDR-corrected across regions of interest (ROIs). *p<0.05, **p<0.01, ***p<0.001. Corresponding p-values can be found in Supplementary file 1, table S3.

Update of

  • doi: 10.1101/2024.04.12.589170
  • doi: 10.7554/eLife.99290.1
  • doi: 10.7554/eLife.99290.2
  • doi: 10.7554/eLife.99290.3

Similar articles

Cited by

References

    1. Anders S, Heinzle J, Weiskopf N, Ethofer T, Haynes JD. Flow of affective information between communicating brains. NeuroImage. 2011;54:439–446. doi: 10.1016/j.neuroimage.2010.07.004. - DOI - PMC - PubMed
    1. Bettencourt KC, Xu Y. Decoding the content of visual short-term memory under distraction in occipital and parietal areas. Nature Neuroscience. 2016;19:150–157. doi: 10.1038/nn.4174. - DOI - PMC - PubMed
    1. Björck Ȧke, Golub GH. Numerical methods for computing angles between linear subspaces. Mathematics of Computation. 1973;27:579–594. doi: 10.1090/S0025-5718-1973-0348991-3. - DOI
    1. Brouwer GJ, Heeger DJ. Decoding and reconstructing color from responses in human visual cortex. The Journal of Neuroscience. 2009;29:13992–14003. doi: 10.1523/JNEUROSCI.3577-09.2009. - DOI - PMC - PubMed
    1. Cavanagh SE, Towers JP, Wallis JD, Hunt LT, Kennerley SW. Reconciling persistent and dynamic hypotheses of working memory coding in prefrontal cortex. Nature Communications. 2018;9:3498. doi: 10.1038/s41467-018-05873-3. - DOI - PMC - PubMed

LinkOut - more resources