. 2025 Jun 24:14:RP104894.
doi: 10.7554/eLife.104894.

TRPV4 activation by TGFβ2 enhances cellular contractility and drives ocular hypertension

Affiliations

TRPV4 activation by TGFβ2 enhances cellular contractility and drives ocular hypertension

Christopher Nass Rudzitis et al. Elife. .

Abstract

The risk for developing primary open-angle glaucoma (POAG) correlates with the magnitude of ocular hypertension (OHT) and the concentration of transforming growth factor-β2 (TGFβ2) in the aqueous humor. Effective treatment of POAG requires a detailed understanding of the interaction between pressure sensing mechanisms in the trabecular meshwork (TM) and biochemical risk factors. Here, we employed molecular, optical, electrophysiological, and tonometric strategies to establish the role of TGFβ2 in transcription and functional expression of mechanosensitive channel isoforms alongside studies of TM contractility in biomimetic hydrogels and intraocular pressure (IOP) regulation in a mouse model of TGFβ2-induced OHT. TGFβ2 upregulated expression of Trpv4 and Piezo1 transcripts and time-dependently augmented functional TRPV4 activation. TRPV4 agonists induced contractility of TM-seeded hydrogels, whereas pharmacological inhibition suppressed TGFβ2-induced hypercontractility and abrogated OHT in eyes overexpressing TGFβ2. Trpv4-deficient mice resisted TGFβ2-driven increases in IOP, but nocturnal OHT was not additive to TGFβ-evoked OHT. Our study establishes the fundamental role of TGFβ as a modulator of mechanosensing in nonexcitable cells, identifies the TRPV4 channel as the final common mechanism for TM contractility and circadian and pathological OHT, and offers insights for future treatments that can lower IOP in the sizeable cohort of hypertensive glaucoma patients that resist current treatments.

Keywords: TGFB2; TRPV4; calcium; circadian rhythm; contractility; electrophysiology; glaucoma; human (cells); intraocular pressure; knockout mice; mouse; neuroscience.


Conflict of interest statement

CR, ML, AS, SR, DK, YT, MD, WS, SH No competing interests declared, DK Co-founder of TMClear and co-inventor of patents (US 2015/0133411, US20230026696) related to the development of cornea permeant TRPV4 channel antagonists; the patents were licensed to TMClear by the University of Utah

Figures
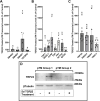
Figure 1.
Figure 1.. TGFβ2 induces a fibrotic phenotype in primary trabecular meshwork (pTM) cells and increases expression and membrane insertion of the TRPV4 channel.
(A, B) Five-day TGFβ2 treatment (1 ng/ml) significantly altered expression of TGFβ pathway effectors, cytoskeletal machinery, and canonical fibrotic markers. (C) TGFβ2 treatment significantly increased TRPV4 and PIEZO1 expression, but not TREK1 and TRPC1 expression. Mean ± SEM shown. N = 4–8 experiments, each gene tested in 3–7 different pTM strains (see Table 1). Two-tailed one-sample t-test of TGFβ2-induced gene expression levels as a percent of control samples. (D) Isolation of membrane proteins from two separate pooled pTM samples suggests TGFβ2 treatment drives increased TRPV4 membrane insertion. N = 2 independent pooled samples, 3 pTM strains were pooled per sample. *p < 0.05, **p < 0.01.
Figure 1—figure supplement 1.
Figure 1—figure supplement 1.. No significant difference was seen in (A) TRPV4 or (B) PIEZO1 expression between primary trabecular meshwork (pTM) samples treated with TGFβ2 (1 ng/ml) alone or TGFβ2 + TRPV4 antagonist HC-06 (5 µM) for 5 days.
N = 3–4 independent experiments. Within each gene, symbols indicate paired samples. Wilcoxon matched-pairs signed rank test and paired t-test used, respectively.
Figure 2.
Figure 2.. TRPV4-mediated Ca2+ influx is potentiated by 5-day TGFβ2 treatment.
(A) Five-day TGFβ2 treatment (1 ng/ml) increased TRPV4 agonist-induced (GSK101, 10 nM) Ca2+ influx in primary trabecular meshwork (pTM) cells compared to serum-free media alone treated cells tested on the same day (N = 5 pTM strains, n = 3–5 slides/condition/day, individual data points over mean ± SEM). Two-tailed one-sample t-test of TGFβ2-treated cell average GSK101 response as a percent of control samples from the same pTM strain on the same day. (B) Violin plots showing the distribution of GSK101-induced Ca2+ responses for each pTM strain tested in A. Thick dashed line indicates mean, while light dashed line indicates quartiles. (C) Representative traces showing TRPV4 agonist-induced Ca2+ influx (seen as an increase in F340/F380) in pTM (mean ± SEM of 4 representative cells/group), alongside example Fura-2-loaded pTM cells before (i), during (ii), and after (iii) GSK101 application. Scale bar = 50 µm. **p < 0.01.
Figure 3.
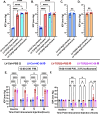
Figure 3.. TGFβ2-induced TRPV4 potentiation is not seen at a shorter period, regardless of treatment strength.
(A) TGFβ2 treatments for 24 hr at 1 ng/ml (N = 6 pTM strains, n = 3–5 slides/condition/day) or 5 ng/ml (N = 5 pTM strains, n = 3–5 slides/condition/day) did not show potentiation of GSK101-evoked TRPV4 Ca2+ influx (Figure 3—figure supplement 1) and were significantly lower than cells treated with TGFβ2 for 5 days at 1 ng/ml (5 days TGFβ2 results from Figure 2A). Individual data points over mean ± SEM. One-way ANOVA with Tukey’s multiple comparisons test, statistics for individual 1 day treatment groups compared to control groups shown in Figure 1. (B) Representative traces for GSK101 response following 24 hr TGFβ2 treatment, traces show mean ± SEM of 3–4 cells. (C) Average current density in response to GSK101 (24 hr control: n = 11 cells, 24 hr TGFβ2: n = 10 cells) shows generally increased current in TGFβ2-treated cells. Data show mean ± SEM (D, E). Violin plots of individual cell strains shown in A. Thick dashed line indicates mean, while light dashed line indicates quartiles. **p < 0.01, ***p < 0.001.
Figure 3—figure supplement 1.
Figure 3—figure supplement 1.. TGFβ2 concentrations of 1 ng/ml (A) and 5 ng/ml (B) did not significantly increase TRPV4-induced calcium influx with respect to control cells.
Individual statistical analysis of experiments shown in Figure 3A (1 ng/ml: p = 0.138, 5 ng/ml: p = 0.095), one sample t-test.
Figure 4.
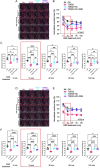
Figure 4.. Effects of TRPV4 inhibition/activation on TGFβ2-induced contraction of trabecular meshwork (TM) cells.
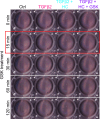
(A) Representative longitudinal 24-well plate scans of collagen type I hydrogels seeded with primary TM (pTM) subjected to the different treatments (dashed lines outline size of contracted constructs). (B) Longitudinal quantification of hydrogel construct size compared to the control group at the 0 min time point. (C) Detailed comparisons between groups at each experimental time point. n = 6 hydrogels/group. One-way ANOVA with Tukey’s multiple comparisons test, data in (B, C) show individual data points over mean ± SD. One pTM strain shown: TGFβ2-induced contractility induction, HC-06-mediated rescue of hypercontractility, and GSK101-induced transient (15 min) contraction were consistent across (3/3) pTM strains tested (Figure 4—figure supplement 1). **p < 0.01, ***p < 0.001, ****p < 0.0001.
Figure 4—figure supplement 1.
Figure 4—figure supplement 1.. TRPV4 activation is obligatory for TGFβ2-induced trabecular meshwork (TM) cell contractions.
(A, D) Representative longitudinal 24-well plate scans of collagen type I hydrogels seeded with two distinct primary TM (pTM) strains (pTM 1: A–C, pTM 2: D–F) subjected to the different treatments as in Figure 4. (B, E) Longitudinal quantification of hydrogel construct size. (C, F) Detailed comparisons between groups at each experimental time point (N = 6 experimental replicates/pTM strain). One-way ANOVA with Tukey multiple comparisons test, data in (B, D) show individual data points over mean ± SEM. *p < 0.05, **p < 0.01, ***p < 0.001, ****p < 0.0001.
Figure 4—figure supplement 2.
Figure 4—figure supplement 2.. Detailed view of primary trabecular meshwork (pTM) seeded collagen constructs used in Figure 4 and Figure 4—figure supplement 1.
High-resolution representative image of collagen gels used for contractility experiments without a circle around the periphery of the gel.
Figure 5.
Figure 5.. TRPV4 activation is necessary to maintain LV-TGFβ2-induced ocular hypertension (OHT).
(A) Intravitreal injection of LV-TGFβ2 (Week 1), but not LV-Control, elevates intraocular pressure (IOP) in WT mice (N = 5 eyes/group) as early as 1-week post-injection. Injection of TRPV4 antagonist HC-06, but not PBS, produced multiday IOP reduction in LV-TGFβ2-treated eyes. HC-06 and PBS injections did not affect IOP in LV-Control injected eyes. Two-way ANOVA with Bonferroni post hoc analysis (B) Direct comparison of the results of PBS and HC-06 injections in the eyes shown in A. Two-way ANOVA with Bonferroni post hoc analysis. (C) Intravitreal injection of LV-TGFβ2 in Trpv4−/− mice (N = 6 eyes/group) resulted in only mild OHT; plotted against WT eyes at matching timepoints (3 WT cohorts including the 5 WT eyes shown in A, B, N = 8–15 eyes/group). (D) Statistical comparison of the IOP values shown in C. The IOP in LV-TGFβ2 WT eyes was significantly elevated compared to the LV-TGFβ2 Trpv4−/− eyes from 2 weeks post-injection. LV-Control injected eyes in WT or Trpv4−/− eyes remain close to the baseline value and are not significantly different. Two-way ANOVA with Bonferroni post hoc analysis. (A, C) shows mean ± SEM. Data in (B, D) show individual data points over mean ± SEM, *p < 0.05, **p < 0.01, ***p < 0.001, ****p < 0.0001.
Figure 5—figure supplement 1.
Figure 5—figure supplement 1.. Expansion of Figure 5D.
Intraocular pressure (IOP) in LV-TGFβ2-injected eyes was significantly elevated compared to both LV-Ctrl injected WT and Trpv4−/− eyes, as well as LV-TGFβ2-injected Trpv4−/− eyes (N = 6 eyes/condition).
Figure 6.
Figure 6.. TRPV4 inhibition inhibits nocturnal intraocular pressure (IOP) elevation in control and TGFβ2 overexpressing eyes.
(A, B) Post-LV injection daytime (12–2:00 P.M) and nocturnal (9–10:00 P.M.) IOP compared in WT mice (N = 4–6 eyes/group) before drug treatment. LV-TGFβ2 eyes were elevated at daytime, but nocturnal ocular hypertension (OHT) was not significantly different between LV-Ctrl and LV-TGFβ2 eyes in two separate cohorts of mice measured under isoflurane anesthesia (A) or while awake (B). (C, D) Anesthesia had no significant effect on measured nocturnal IOP. One-way ANOVA with Tukey’s multiple comparisons test. (E, F) PBS-injected eyes did not exhibit changes in daytime or nighttime intraocular pressure; however, HC-06 injection reduced TGFβ2-induced IOP elevations during the day and LV-Ctrl and LV-TGFβ2 nocturnal IOPs (N = 4 eyes/group); two-way ANOVA with Bonferroni post hoc analysis. Figures show data points over mean ± SEM, *p < 0.05, **p < 0.01, ****p < 0.0001.
Figure 6—figure supplement 1.
Figure 6—figure supplement 1.. Nocturnal intraocular pressure (IOP) is not significantly affected by LV-TGFβ2 overexpression.
Expanded time series of IOP measured weekly from a second cohort of mouse eyes (Figure 6B) injected with LV-Ctrl (n = 6 eyes) or LV-TGFβ2 (n = 4 eyes). LV-TGFβ2 resulted in elevated diurnal IOP, which gradually approached the IOP seen in nocturnal measurements but did not further elevate IOP above nocturnal values. In this cohort, both diurnal and nocturnal measurements were made in awake animals.
Figure 7.
Figure 7.. TGFβ2–TRPV4 interactions in trabecular meshwork (TM) remodeling and ocular hypertension (OHT).
Chronic exposure to TGFβ2 induces upregulation of functional TRPV4 channels alongside the autoinhibitory canonical modulator SMAD7. TRPV4-mediated Ca2+ influx, canonical, and non-canonical TGFβ2 signaling stimulate the Rho/ROCK pathway to augment cytoskeletal contractility and stimulate extracellular matrix (ECM) release. Actomyosin contractility promotes outflow resistance and drives OHT and underpins a vicious feedforward TRPV4-dependent loop that maintains OHT. This figure was created using BioRender.com.
Author response image 1.
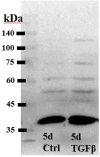
Author response image 1.. Western blot, total protection extract from control and TGFb2-treated TM cells [Alomone antibody].

Update of

Similar articles

Cited by

References

    1. Abad E, Lorente G, Gavara N, Morales M, Gual A, Gasull X. Activation of store-operated Ca 2+ channels in trabecular meshwork cells. Investigative Opthalmology & Visual Science. 2008;49:677. doi: 10.1167/iovs.07-1080. - DOI - PubMed
    1. Acott TS, Vranka JA, Keller KE, Raghunathan VK, Kelley MJ. Normal and glaucomatous outflow regulation. Progress in Retinal and Eye Research. 2021;82:100897. doi: 10.1016/j.preteyeres.2020.100897. - DOI - PMC - PubMed
    1. Adapala RK, Thoppil RJ, Luther DJ, Paruchuri S, Meszaros JG, Chilian WM, Thodeti CK. TRPV4 channels mediate cardiac fibroblast differentiation by integrating mechanical and soluble signals. Journal of Molecular and Cellular Cardiology. 2013;54:45–52. doi: 10.1016/j.yjmcc.2012.10.016. - DOI - PMC - PubMed
    1. Agarwal P, Daher AM, Agarwal R. Aqueous humor TGF-β2 levels in patients with open-angle glaucoma: a meta-analysis. Molecular Vision. 2015;21:612–620. - PMC - PubMed
    1. Alessandri-Haber N, Dina OA, Joseph EK, Reichling D, Levine JD. A transient receptor potential vanilloid 4-dependent mechanism of hyperalgesia is engaged by concerted action of inflammatory mediators. The Journal of Neuroscience. 2006;26:3864–3874. doi: 10.1523/JNEUROSCI.5385-05.2006. - DOI - PMC - PubMed

LinkOut - more resources