. 2025 Jul 23;91(7):e0096425.
doi: 10.1128/aem.00964-25. Epub 2025 Jun 24.

Phenotypic analysis of various Clostridioides difficile ribotypes reveals consistency among core processes

Affiliations

Phenotypic analysis of various Clostridioides difficile ribotypes reveals consistency among core processes

Merilyn A Beebe et al. Appl Environ Microbiol. .

Abstract

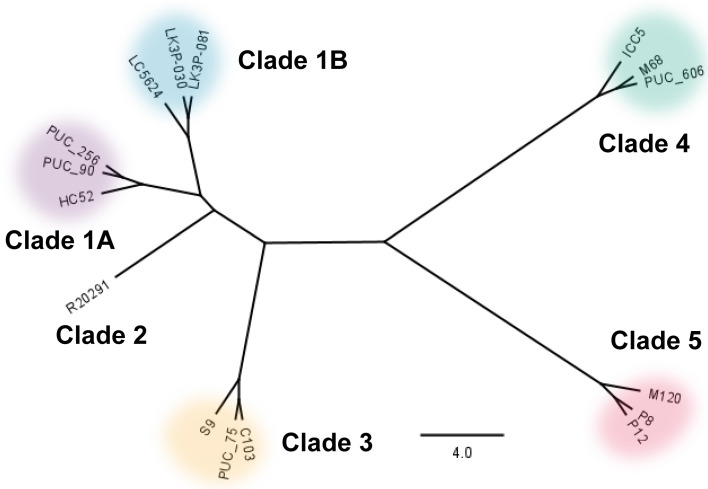
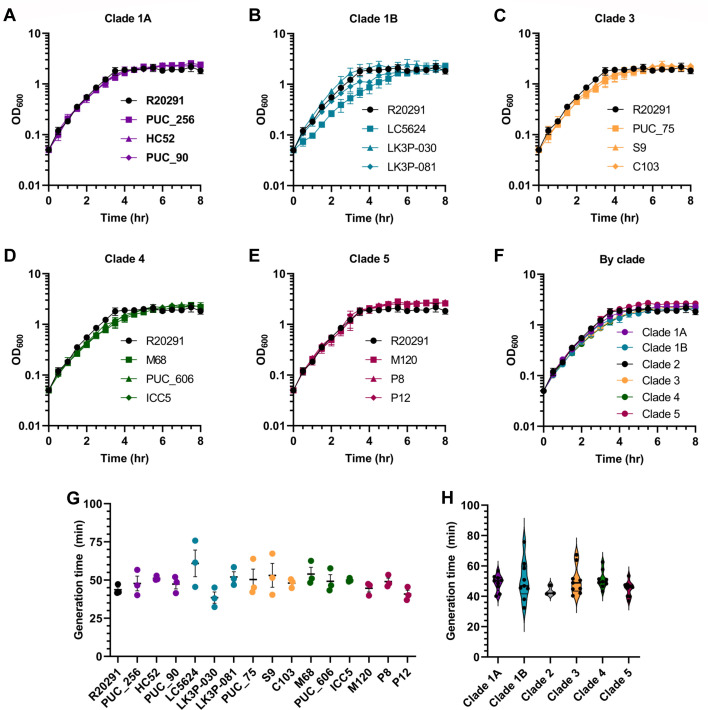
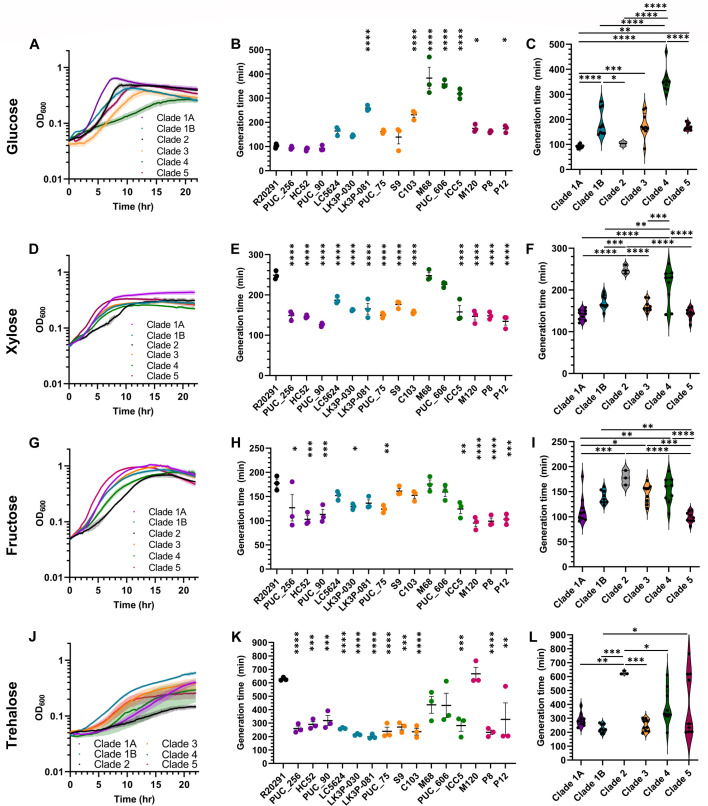
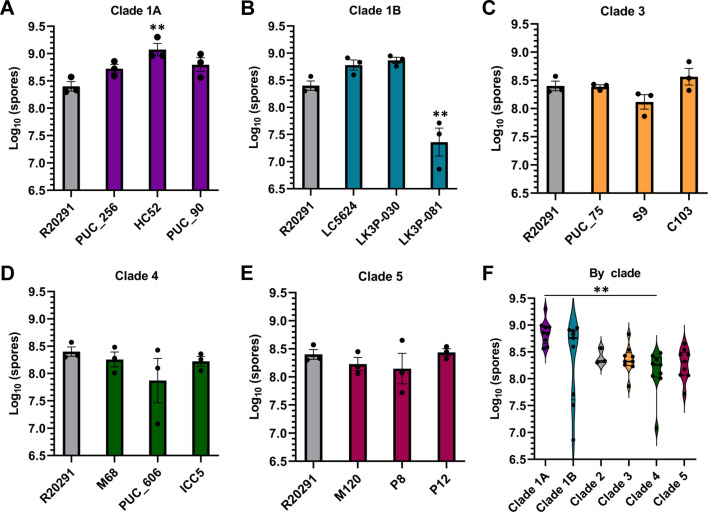
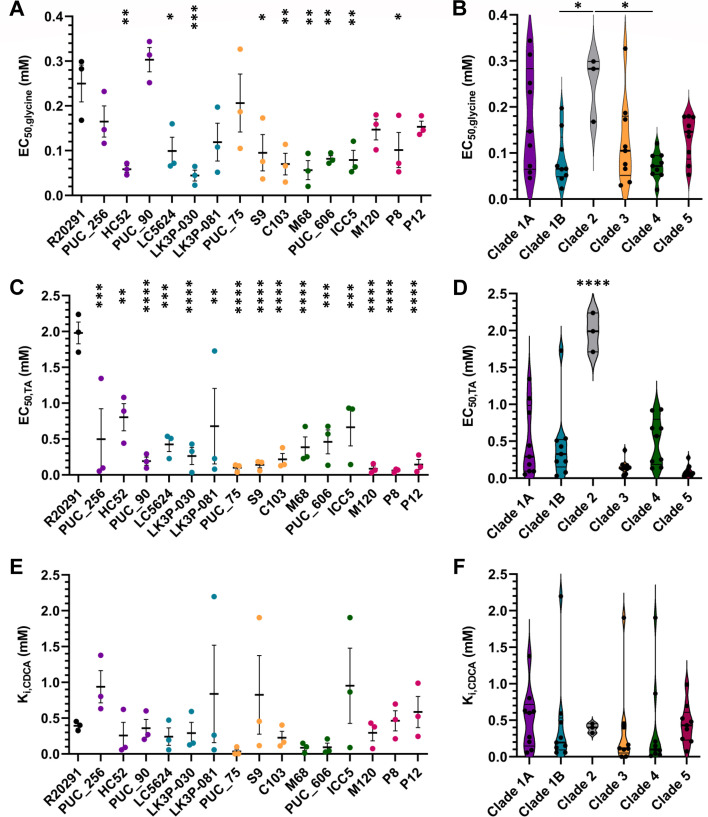
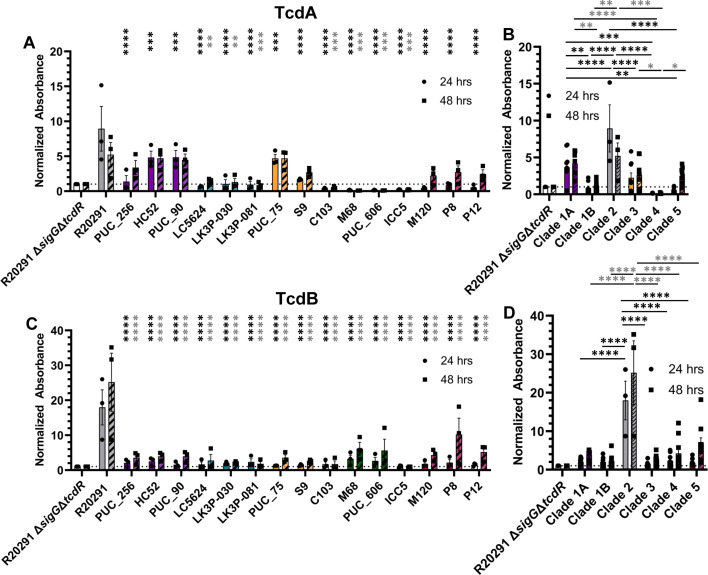
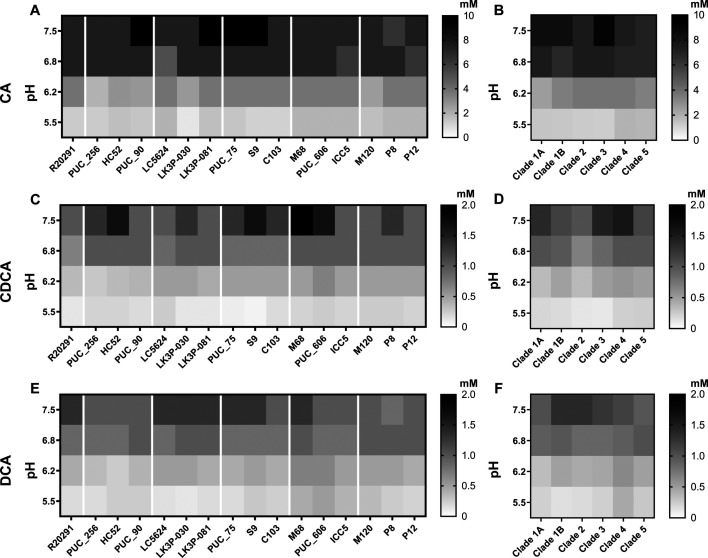
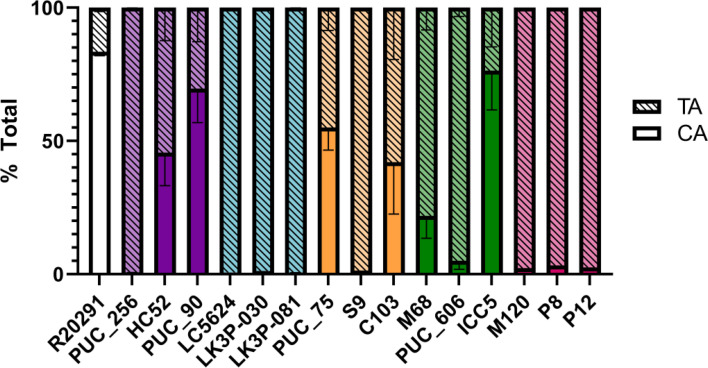
Clostridioides difficile infections (CDI) cause almost 300,000 hospitalizations per year, of which ~15%-30% are the result of recurring infections. The prevalence and persistence of CDI in hospital settings have resulted in an extensive collection of C. difficile clinical isolates and their classification, typically by ribotype. While much of the current literature focuses on one or two prominent epidemic ribotypes (e.g., RT027), recent years have seen several other ribotypes dominate the clinical landscape (e.g., RT106 and RT078). Some ribotypes are associated with severe disease and/or increased recurrence rates, but why certain ribotypes are more prominent or harmful than others remains unknown. Because C. difficile has a large, open pan-genome, this observed relationship between ribotype and clinical outcome could be a result of the genetic diversity of C. difficile. Thus, we hypothesize that the core biological processes of C. difficile are conserved across ribotypes/clades. We tested this hypothesis by observing the growth kinetics, sporulation, germination, production of toxin A and toxin B, bile acid sensitivity, bile salt hydrolase activity, and surface motility of 15 strains belonging to various ribotypes spanning each known C. difficile clade. In viewing these phenotypes across each strain, we see that core phenotypes (growth, germination, sporulation, and resistance to bile salt toxicity) are remarkably consistent across clades/ribotypes. This suggests that variations observed in the clinical setting may be due to unidentified factors in the accessory genome or due to unknown host factors.IMPORTANCEClostridioides difficile infections impact thousands of individuals every year, many of whom experience recurring infections. Clinical studies have reported an unexplained correlation between some clades/ribotypes of C. difficile and disease severity/recurrence. Here, we demonstrate that C. difficile strains across major clades/ribotypes are consistent in their core phenotypes. This suggests that such phenotypes are not responsible for variations in disease severity/recurrence and are ideal targets for the development of therapeutics meant to treat C. difficile-related infections.

Keywords: Clostridium difficile; clade; phenotypes; physiology; ribotype.


Conflict of interest statement

The authors declare no conflict of interest.

Figures

Fig 1
Fig 1
Phylogeny of strains used in this study. The neighbor-joining phylogeny generated for the strains in this study derived from LCB 60, a 764,748 bp segment of the MAUVE alignment representing approximately 25% of any given genome in the study. The phylogeny was created using the Geneious Tree Builder application in the Geneious Prime software using the Tamura-Nei genetic distance model. Strains are grouped by their respective ribotypes/clades, with the scale bar representing the number of substitutions per 1,000 bp.
Fig 2
Fig 2
Growth of strains in rich medium. OD600 measurements for clade 1A (A), clade 1B (B), clade 3 (C), clade 4 (D), and clade 5 (E) strains were taken every 30 minutes over the course of 8 hours. These same data are shown in panel F grouped by ribotype/clade. Data from the most linear portion of the growth curve were used to calculate the doubling time presented by strain (G) and by ribotype/clade (H). Data points represent the average from independent biological triplicates with error bars representing the SEM. For panel G, Šidák’s multiple comparisons test (comparing all strains to C. difficile R20291) was used, while Tukey’s multiple comparisons test (comparing all clades to each other) was used for panel H. No statistically significant differences between strains were found.
Fig 3
Fig 3
Growth of strains in minimal medium. Strains were grown in CDMM supplemented with either glucose (A), xylose (D), fructose (G), or trehalose (J). OD600 measurements for each strain were taken every 3 minutes for 22 hours. Data from the most linear portion of the growth curve were used to calculate generation times for growth in CDMM supplemented with glucose (B and C), xylose (E and F), fructose (H and I), or trehalose (K and L). Data points represent the average from independent biological triplicates with error bars representing the SEM. For panels B, E, H, and K, Šidák’s multiple comparisons test (comparing all strains to C. difficile R20291) was used, while Tukey’s multiple comparisons test (comparing all clades to each other) was used for panels C, F, I, and L. Asterisks indicate P-values of * ≤0.05, ** ≤0.02, *** ≤0.01, and **** ≤0.0001.
Fig 4
Fig 4
Spore production by strains over 48 hours. The number of spores produced on BHIS over 48 hours for clade 1A (A), clade 1B (B), clade 3 (C), clade 4 (D), and clade 5 (E) was reported on a log10 scale. These same data are grouped by clade in F. Data points represent the average from independent biological triplicates with error bars representing the SEM. For A–E, Šidák’s multiple comparisons test (comparing all strains to C. difficile R20291) was used, while Tukey’s multiple comparisons test (comparing all clades to each other) was used for F. Asterisks indicate a P-value of ** ≤0.02.
Fig 5
Fig 5
Strain sensitivity to germinants. Germination assays for each strain were performed in the presence of various concentrations of glycine (A and B), TA (C and D), or TA + CDCA (E and F). Germinant sensitivity was calculated using the maximum slope for each condition plotted against (co)-germinant concentration. The data fitted to a linear relationship by taking the inverse of the slope vs concentration plot, and from this, Ki/EC50 was calculated with EC50 equaling the concentration of germinant that produces the half maximum germination rate. The efficiency of the competitive inhibitor was calculated using the following equation Ki = (inhibitor)/([KCDCA/KTA] − 1) (61, 62). Data points represent the average from independent biological triplicates with error bars representing the SEM. For A, C, and E, Šidák’s multiple comparisons test (comparing all strains to C. difficile R20291) was used, while Tukey’s multiple comparisons test (comparing all clades to each other) was used for panels B, D, and F. Asterisks indicate P-values of * ≤0.05, ** ≤0.02, *** ≤0.01, and **** ≤0.0001.
Fig 6
Fig 6
Toxin A/B levels of strains. Exponential-phase cultures of each strain were inoculated into BHIS and grown for 48 hours. At 24 and 48 hours post-inoculation, samples were collected and frozen. Thawed samples were tested for the presence of toxins A (A and B) and B (B and D) using a commercial ELISA kit from Epitope Diagnostics. Data points represent the average from independent biological triplicates with error bars representing the SEM. The limit of detection as determined by the absorbance of the C. difficile R20291 ΔsigGΔtcdR strain is indicated by a dotted line. A repeated measure (RM) two-way ANOVA was used to compare each strain to C. difficile R20291 (A and C) or to compare all clades to each other (B and D). Asterisks indicate P-values of * ≤0.05, ** ≤0.02, *** ≤0.01, and **** ≤0.0001 with black asterisks designating comparisons between the 24-hour samples and gray asterisks designating comparisons between 48-hour samples.
Fig 7
Fig 7
Bile salt sensitivity of strains. Exponential-phase cultures of each strain were inoculated into BHIS of the indicated pH and concentration of CA (A and B), CDCA (C and D), and DCA (E and F). MICs were assessed by the presence/absence of growth after ~18 hours. Black represents the highest tested concentration of bile salt value, while white represents no inhibition. Data represent the average from independent biological triplicates.
Fig 8
Fig 8
BSHA. Each strain was grown in the presence of 1 mM TA and incubated for 24 hours. The bile salts present in each culture following incubation were identified/quantified by reverse-phase HPLC. Percent deconjugation was calculated using the following formula: percent deconjugation = CA/(TA + CA). Data points represent the average from independent biological triplicates with error bars representing the SEM.

Update of

Similar articles

Cited by

References

    1. Setlow P, Wang S, Li YQ. 2017. Germination of spores of the orders Bacillales and Clostridiales. Annu Rev Microbiol 71:459–477. doi: 10.1146/annurev-micro-090816-093558 - DOI - PubMed
    1. Deakin LJ, Clare S, Fagan RP, Dawson LF, Pickard DJ, West MR, Wren BW, Fairweather NF, Dougan G, Lawley TD. 2012. The Clostridium difficile spo0A gene is a persistence and transmission factor. Infect Immun 80:2704–2711. doi: 10.1128/IAI.00147-12 - DOI - PMC - PubMed
    1. Nerber HN, Sorg JA. 2021. The small acid-soluble proteins of Clostridioides difficile are important for UV resistance and serve as a check point for sporulation. PLoS Pathog 17:e1009516. doi: 10.1371/journal.ppat.1009516 - DOI - PMC - PubMed
    1. Rodriguez-Palacios A, Lejeune JT. 2011. Moist-heat resistance, spore aging, and superdormancy in Clostridium difficile. Appl Environ Microbiol 77:3085–3091. doi: 10.1128/AEM.01589-10 - DOI - PMC - PubMed
    1. Kochan TJ, Shoshiev MS, Hastie JL, Somers MJ, Plotnick YM, Gutierrez-Munoz DF, Foss ED, Schubert AM, Smith AD, Zimmerman SK, Carlson PE Jr, Hanna PC. 2018. Germinant synergy facilitates Clostridium difficile spore germination under physiological conditions. mSphere 3:e00335-18. doi: 10.1128/mSphere.00335-18 - DOI - PMC - PubMed

LinkOut - more resources