. 2025 Oct 6;15(10):2139-2165.
doi: 10.1158/2159-8290.CD-24-0684.

AAnet Resolves a Continuum of Spatially Localized Cell States to Unveil Intratumoral Heterogeneity

Affiliations

AAnet Resolves a Continuum of Spatially Localized Cell States to Unveil Intratumoral Heterogeneity

Aarthi Venkat et al. Cancer Discov. .

Abstract

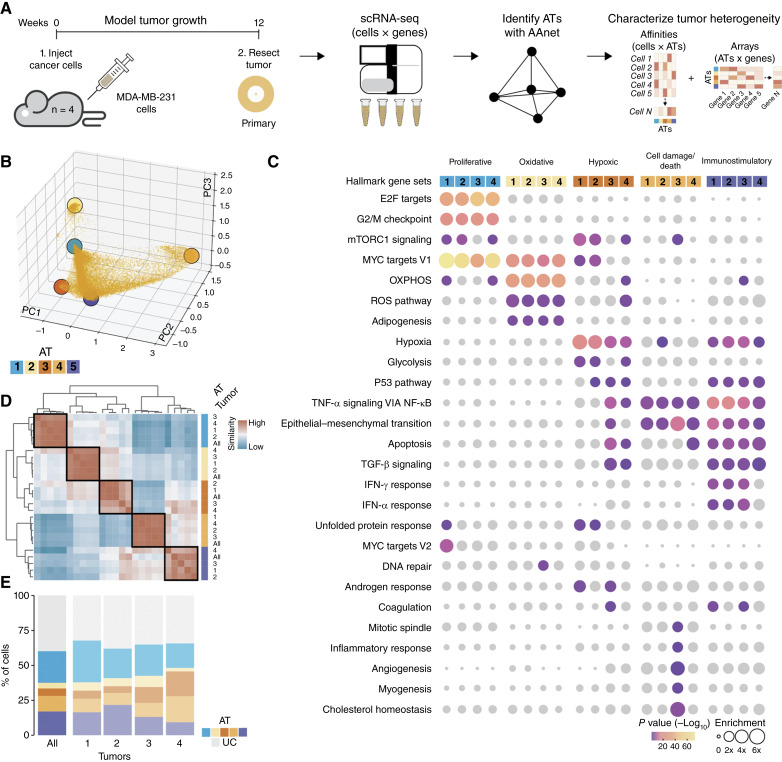
Identifying functionally important cell states and structure within heterogeneous tumors remains a significant biological and computational challenge. Current clustering- or trajectory-based models are ill-equipped to address the notion that cancer cells reside along a phenotypic continuum. We present Archetypal Analysis network (AAnet), a neural network that learns archetypal states within a phenotypic continuum in single-cell data. Unlike traditional archetypal analysis, AAnet learns archetypes (AT) in a simplex-shaped neural network latent space. Using preclinical and clinical models of breast cancer, AAnet resolves distinct cell states and processes, including cell proliferation, hypoxia, metabolism, and immune interactions. Primary tumor ATs are recapitulated in matched liver, lung, and lymph node metastases. Spatial transcriptomics reveals archetypal organization within the tumor and intra-archetypal mirroring between cancer and adjacent stromal cells. AAnet identifies GLUT3 within the hypoxic AT that proves critical for tumor growth and metastasis. AAnet is a powerful tool, capturing complex, functional cell states from multimodal data.

Significance: Defining critical cell states among cells that reside along a phenotypic continuum is a current biological and computational challenge. In this study, we present AAnet, a neural network that learns archetypal cell states of cancer cells. AAnet defines discrete spatially localized ATs that resolve intratumoral heterogeneity.


Conflict of interest statement

S.E. Youlten reports personal fees from Compbiosphere outside the submitted work, as well as being the founder and director of Compbiosphere, a computational biology analytics and consulting company. D.B. Burkhardt reports other support from Cellarity, Inc. and NVIDIA and grants from Chan Zuckerberg Initiative outside the submitted work. A. Benz reports other support from Cellarity, Inc., outside the submitted work. J. Lundeberg reports grants from The Swedish Cancer Society during the conduct of the study, as well as personal fees from 10× Genomics, Inc. outside the submitted work. S. Krishnaswamy reports personal fees from Meta and Latent Alpha outside the submitted work. No disclosures were reported by the other authors.

Figures

Figure 1.
Figure 1.
Overview of experimental design, AAnet, and downstream analyses. In an MDA-MB-231 mouse model, scRNA-seq and spatial RNA-seq data were collected for primary tumors, and scRNA-seq was collected for LN, liver, and lung metastases. AAnet infers ATs by transforming the data into a simplicial latent space for AA. AAnet learns cellular ATs within each tumor and enables downstream analysis of gene set enrichment within and across tissue sites, spatial organizations, and ME associations. AAnet also identifies related ATs in human breast cancer tumors and archetypal similarity across cancer subtypes.
Figure 2.
Figure 2.
Overview of AAnet architecture. A, Primary tissue visualization is a continuum of cells. Clustering the data using standard Leiden clustering 100 times (with no parameters changed) results in shifting boundaries between adjacent clusters. B, (i) AAnet learns transformation of data into a latent space shaped as a simplex. (ii) Archetypal loss enforces that data lie in a latent space shaped like a k-dimensional simplex. (iii) Diffusion extrema loss infers the extrema from data geometry. The diffusion extrema also inform the number of ATs for downstream analysis. C, AAnet is initialized with diffusion extrema and learns affinity to each AT and decodes the data-space ATs. D, Manifold distance preservation score (DEMaP; ref. 24) of cluster representation vs. AAnet representation. E, AAnet latent space can be used to characterize continuous gene trends not easily characterizable with clustering.
Figure 3.
Figure 3.
A, Experimental approach used to identify tumor ATs in TNBC with AAnet. MDA-MB-231 breast cancer cells were injected into the mammary fat pad of NSG mice and left to grow. At 12 weeks, primary tumors were resected, and human cancer cells were sequenced. AAnet identified ATs for downstream analysis. B, Embedding of TNBC tumor cells (all tumors combined) with five ATs indicated using colored circles. C, Enriched Hallmark gene sets associated with each AT in each tumor (colors indicate AT and numbers indicate tumor). P value is FDR-corrected; gene sets where P > 0.05 are shown in gray. Enrichment represents log2 fold change. D, Heatmap of cosine similarity between archetypal expression vectors determined in each individual tumor (numbered) and all tumors combined (all). Orthologous ATs between samples are indicated using colors. E, Percentage of cells in each sample committed to each AT (colored) or uncommitted (UC) to an AT (gray).
Figure 4.
Figure 4.
A, Approach to define tumor ATs in TNBC metastases from the LNs, liver, and lungs. MDA-MB-231 breast cancer cells were injected into the mammary fat pad of NSG mice and left to grow. At 12 weeks, primary tumors were resected, and human cancer cells were sequenced. At 16 weeks, the LN, liver, and lung metastases were resected and human cancer cells were sequenced. AAnet identified ATs for downstream analysis. B, Embedding of tumor cells from each tissue with similar ATs indicated using colored circles. C, Representative histologic sections of tumors and metastases taken for single-cell sequencing. D, Enriched Hallmark gene sets associated with ATs from each tissue (indicated using colors). P value is FDR-corrected; gene sets in which P > 0.1 are shown in gray. Enrichment represents log2 fold change. LI, liver; LU, lungs; P, primary. E, Stacked bar plot showing the percentage of tumor cells in each tissue committed to each AT (colored) or uncommitted to an AT (gray). F, Stacked bar plot showing the cell-cycle phase of cells committed to each AT.
Figure 5.
Figure 5.
A, Histologic sections of TNBC xenografts used for spatial transcriptome sequencing (n = 2). B, Spatial transcriptomics data from primary tumor (consisting of human tumor and mouse microenvironment) are aligned to scRNA-seq primary tumor data using scMMGAN. Aligned spatial RNA-seq voxels are input into trained AAnet primary tumor model to determine archetypal affinity of each spot. C, Spatial voxels with a strong affinity (>0.3) for each AT (colored) as determined by scMMGAN and AAnet. ATs show spatial organization within primary tumor. D, Spatial plots colored by marker gene set score for AT. Gene set scores show spatial organization within primary tumor. E, DREMI score between archetypal affinity and marker gene set scores shows high correspondence, meaning that biology defining each AT is maintained in spatial map.
Figure 6.
Figure 6.
A, Approach to analyze tumor microenvironment from spatial transcriptomics data from primary tumor (consisting of human tumor and mouse microenvironment), wherein key ATs are identified using AAnet, characterized via cell-type enrichment, biological processes, archetypal associations, and signaling interactions. B, AAnet identifies six ATs in the tumor microenvironment. ME-AT affinity scores visualized for each spatial voxel. C, PanglaoDB enrichment of cell types associated with each ME-AT. P value is FDR-corrected. Enrichment represents log2 fold change. D, Enrichment of top two biological processes from the Gene Ontology (GO) associated with each ME-AT. Processes are ranked by FDR (−log10). E, ME-ATs (y-axis) significantly associated with each tumor AT (x-axis). Color reflects tumor AT; enrichment represents log2 fold change. F, Top ranked ligand–receptor pairs expressed in spatial voxels with a strong affinity for each AT and their colocalized microenvironments. Capitalized gene symbols indicate genes with expression in tumor cells (human). Title case symbols indicate genes with expression in ME cells (mouse). Pairs are ranked by FDR (−log10). G, Ligand–receptor interaction score across spatial voxels for top pairs associated with each AT.
Figure 7.
Figure 7.
A, Heatmap showing expression of metabolic genes (glycolysis and OXPHOS) across cancer ATs and associated ME cells. Bar graph shows correlation between ATs and ME-ATs and the hypoxic gene signature enriched in orange AT and its associated ME-AT. B, Schematic of glycolysis and TCA cycle pathways with the hypoxia gene component of the glycolysis AT highlighted in orange. C, Proton efflux rate derived from basal glycolysis (GlycoPER) for MDA-MB-231, HCC38-CD44Hi, and HCC1806 cells treated with either control siRNA (siCTRL) or siRNA targeting SLC2A3 (siSLC2A3-1 and siSLC2A3-2) over 48 hours after knockdown (n = 3 independent experiments, triplicate wells analyzed per condition). Statistical significance defined by two-way ANOVA with Dunnett multiple-comparison post hoc analysis (**** adj. p-value ≤ 0.001, *** adj. p-value ≤ 0.003). D, Quantitation of tumorsphere-forming capacity in MDA-MB-231, HCC38-CD44Hi, and HCC1806 cells treated with control (siCTRL) or SLC2A3 knockdown (siSLC2A3-1 or siSLC2A3-2; n = 3 independent experiments, 12 wells analyzed per condition). Statistical significance defined by ordinary one-way ANOVA with Dunnett multiple-comparison post hoc analysis. E, Metastatic seeding capacity of control (siCTRL) and SLC2A3 knockdown (siSLC2A3-1 or siSLC2A3-2) MDA-MB-231-luc cells injected retro-orbitally in NSG mice, measured using bioluminescence imaging of the lungs over days 0 to 10 (n = 5/cohort, statistical significance measured using two-way ANOVA, Dunnett multiple-comparison test, ** adj. p-value ≤ 0.003). F, Representative images showing anti-GLUT3 (Alexa Fluor 488), anti-HIF1a (Cy3), anti-CD31 (Alexa Fluor 647), and DAPI staining in MDA-MB-231-luc xenograft, HCI-010, and HCI-001 PDX tissues (n = 4 sections). Scale bar, 50 μm (top); scale bar, 20 μm (inset, bottom). G, Conditional-DREMI scores correlating immunofluorescence intensity values of HIF1a and GLUT3 with conditional Density Rescaled Visualization heatmaps across TNBC models in F. H, Diagrammatic representation of single-cell analysis of 34 human breast cancer samples from four cohorts. Datasets are prefiltered to high-quality cancer epithelial cells, and ATs are identified for each sample using AAnet. I, Heatmap showing expression of metabolic genes from (A) across 26 human cancer ATs, 18 (left) associated with the hypoxic AT and 8 (right) associated with the proliferative AT. ATs are from breast cancer samples across three different breast cancer subtypes.

References

    1. Esposito M, Ganesan S, Kang Y. Emerging strategies for treating metastasis. Nat Cancer 2021;2:258–70. - PMC - PubMed
    1. McGranahan N, Swanton C. Clonal heterogeneity and tumor evolution: past, present, and the future. Cell 2017;168:613–28. - PubMed
    1. Burkhardt DB, San Juan BP, Lock JG, Krishnaswamy S, Chaffer CL. Mapping phenotypic plasticity upon the cancer cell state landscape using manifold learning. Cancer Discov 2022;12:1847–59. - PMC - PubMed
    1. Lähnemann D, Köster J, Szczurek E, McCarthy DJ, Hicks SC, Robinson MD, et al. Eleven grand challenges in single-cell data science. Genome Biol 2020;21:31. - PMC - PubMed
    1. Wolf FA, Hamey FK, Plass M, Solana J, Dahlin JS, Göttgens B, et al. PAGA: graph abstraction reconciles clustering with trajectory inference through a topology preserving map of single cells. Genome Biol 2019;20:59. - PMC - PubMed