. 2025 Aug 4;224(8):e202409103.
doi: 10.1083/jcb.202409103. Epub 2025 Jun 24.

Acidosis attenuates the hypoxic stabilization of HIF-1α by activating lysosomal degradation

Affiliations

Acidosis attenuates the hypoxic stabilization of HIF-1α by activating lysosomal degradation

Bobby White et al. J Cell Biol. .

Abstract

Hypoxia-inducible factors (HIFs) mediate cellular responses to low oxygen, notably enhanced fermentation that acidifies poorly perfused tissues and may eventually become more damaging than adaptive. How pH feeds back on hypoxic signaling is unclear but critical to investigate because acidosis and hypoxia are mechanistically coupled in diffusion-limited settings, such as tumors. Here, we examined the pH sensitivity of hypoxic signaling in colorectal cancer cells that can survive acidosis. HIF-1α stabilization under acidotic hypoxia was transient, declining over 48 h. Proteomic analyses identified responses that followed HIF-1α, including canonical HIF targets (e.g., CA9, PDK1), but these did not reflect a proteome-wide downregulation. Enrichment analyses suggested a role for lysosomal degradation. Indeed, HIF-1α destabilization was blocked by inactivating lysosomes, but not proteasome inhibitors. Acidotic hypoxia stimulated lysosomal activity and autophagy via mammalian target of rapamycin complex I (mTORC1), resulting in HIF-1α degradation. This response protects cells from excessive acidification by unchecked fermentation. Thus, alkaline conditions are permissive for at least some aspects of HIF-1α signaling.


Conflict of interest statement

Disclosures: The authors declare no competing interests exist.

Figures

Figure 1.
Figure 1.
Phenotyping CRC cell lines for survival and metabolic responses to pHe changes. (A) Eight CRC cell lines were selected from a panel of 68 lines to span a range from acid-sensitive (left) to acid-resistant (right). Cells were cultured for 6 days in media set to a starting pH ranging from 6.2 to 7.7. At end-point, cellular biomass was measured by SRB assay and normalized to the maximal growth measured for each repeat for at least three independent repeats. Data fitted to a biphasic Hill-type survival curve (black), contextualized against previously measured survival curves for 68 CRC cell lines (grey). (B) CRC cell lines were pre-treated in alkaline (pH 7.4) media for 48 h, prior to fluorimetric measurements of medium acidification and oxygenation, from a starting condition of normoxia and pHe 7.4. (C) Measurements repeated on cells pre-treated in acidic (pH 6.4) media for 48 h. Following acidic pre-treatment, conditions were returned to pHe 7.4 and normoxia immediately prior to commencing fluorimetric measurements. (D) Paired [lactate] and [H+] measurements. C99 (C), SW1222 (S), HDC111 (HD), or HT29 (HT) cells were pre-treated for 48 h in alkaline (pH 7.4) or acidic (pH 6.4) media containing either DMOG (1 mM) or its vehicle (DMSO). After treatment, metabolic profiling was performed in DMOG-free medium from a starting condition of normoxia and pHe 7.4. After either 8 h (empty symbol) or 17 h (filled symbol), media samples were collected for [lactate] assays. (E) Metabolic profiling of C99 cells for acid production and oxygen consumption. Cells were pre-treated for 48 h in alkaline (pH 7.4) or acidic (pH 6.4) media containing either DMOG (1 mM) or its vehicle (DMSO). After pre-treatment, metabolic profiling was performed under DMOG-free conditions, but pHe remained unchanged. Cumulative acid production and oxygen consumption were recorded simultaneously as readouts of fermentation and respiration, respectively. Experiments performed for at least three independent repeats. Data shown as mean ± SEM. Statistical testing by three-way ANOVA (see Table S1 for full results).
Figure S1.
Figure S1.
Live cell density during metabolic profiling of CRC cell lines, inferred from CTO fluorescence retention (after loading and excess dye washout). (A) Measurements in eight CRC cell lines that had been pre-treated for 48 h with either alkaline (pH 7.4) or acidic (pH 6.4) media. (Band C) Measurements in C99 cells following 48 h pre-treatment in alkaline or acidic media in the presence of 1 mM DMOG (hatched bars). Data presented as mean ± SEM.
Figure 2.
Figure 2.
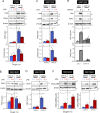
pHe dependence of hypoxic HIF-α induction in acid-resistant CRC cell lines. C99, SW1222, HDC111, or HT29 cells were incubated under normoxia (21% O2) or hypoxia (1% O2) in media of pH ranging from 6.2 to 7.4 for 48 h. (A–E) After treatment, lysates were analyzed for (A, C, D, and E) HIF-1α or (B) HIF-2α immunoreactivity. (F) HIF-1α stabilization under hypoxia is not dependent on [HCO3] at constant pHe. C99 cells were grown for 48 h in media at pH 7.4 containing either 22 mM HCO3 in an atmosphere of 5% CO2 or 3 mM HCO3 in an atmosphere of 0.5% CO2. During the incubations, cells were exposed to normoxia or hypoxia and lysates were analyzed for HIF-1α immunoreactivity. (G) Acidosis impairs hypoxic HIF-1α induction independently of [lactate]. C99 cells were incubated under normoxia or hypoxia in media of pH 7.4 or 6.4 with or without 20 mM lactate for 48 h and analyzed for HIF-1α immunoreactivity. HIF-α signals were normalized to loading control (β-actin) for three independent repeats. Datapoints indicate individual repeats, and bars indicate mean + SEM. Statistical testing by two- or three-way ANOVA (see Table S1 for full results). Source data are available for this figure: SourceData F2.
Figure 3.
Figure 3.
Proteomic analyses identify protein abundance responses to hypoxia and acidosis. Label-free mass spectrometry of SW1222 cell lysates after 48 h of culture in media of pH 6.4 or 7.4 under normoxia (21% O2) or hypoxia (1% O2). Lysates from three independent replicates. (A) Principal component analysis showing the four conditions tested. (B) Euler diagram summarizing the results of two-way ANOVA (FDR < 0.05). (C) Heatmap of log2-transformed standardized label-free quantification (LFQ) protein abundance, ranked by significant (FDR < 0.05) Pearson’s correlation against HIF-1α (from top row). (D) Signal intensities for selected proteins that follow the HIF-1α pattern (CA9, PDK1) and those with distinct responses, notably synergy between acidosis and hypoxia (CEACAM5) and hypoxia-insensitive acid induction (AKR1C2); bars indicate mean, and black datapoints indicate individual replicates. Conditions are labeled as “Nor” (normoxia), “Hyp” (hypoxia), “Ac” (pHe 6.4), and “Alk” (pHe 7.4). (E) Heatmap of log2-transformed standardized LFQ for protein abundance sensitive to alkaline hypoxia (q < 0.05), alongside response in acidic hypoxia. Clustering identifies a downregulated group of proteins “D” (6 proteins: AEN, AFG2B, BET1, ERAL1, HMGCR, and NSA2), an upregulated group “A” that is strongly inhibited under acidosis (4 proteins: HIF1A, KDM4A, SCD, and DR54), an upregulated group “B” that is partially inhibited under acidosis (22 proteins: AK4, ANKZF1, APOD, CA9, CKB, DLL3, EGLN1, GBE1, HMGCS2, IREB2, KDM4B, KDM5B, KIT, LDHA, MXI1, NARF, P4HA1, PDCD4, PDK1, PFKFB4, PHYH, and SORL1), and an upregulated group “C” that synergizes with acidosis (30 proteins: BNIP3L, COL17A1, CORO2A, DPYS, ENO2, GDPD3, GPRC5A, HID1, ITGA5, ITGB6, ITIH3, KDM3A, KDM5C, LRP1, MYO1D, NDRG1, P4HA2, PFKP, PIK3AP1, PLIN2, PLOD2, PPP1R3G, QSOX1, SEMA4B, SLC16A3, SLC2A3, TCAF2, TGFA, UPK2, and ZNF841). (F) Scatter plot shows hypoxic response under alkalosis versus acidosis for the four clusters (groups A–D). Black outlines denote canonical HIF targets (from Buffa and Lombardi).
Figure 4.
Figure 4.
HIF-target induction under acidotic or alkalotic hypoxia. (A–D) C99 or SW1222 cells were cultured in media of pH 6.4 or 7.4 and incubated for 48 h in either (A and B) normoxia (21% O2) or hypoxia (1%), or (C and D) either in the presence of vehicle control (DMSO) or 1 mM DMOG. After treatment, lysates were analyzed for immunoreactivity of canonical HIF targets (CA9, LDHA, PDK1) and the putative HIF target CDX1. (E) SW1222 cells were transfected with either non-targeting control siRNA (siScr) or siRNA-targeting HIF1A (siHIF1A). 24 h after transfection, cells were cultured for 48 h in media of pH 7.4 containing either DMSO or 1 mM DMOG. Reduced CA9 immunoreactivity in DMOG-treated siHIF1A cells confirmed efficient knockdown. (F) Hypoxia synergized with acidosis to strengthen CEACAM6 expression. SW1222 cells were grown in media of pH 6.4 or 7.4 for 48 h. Incubations were performed under either normoxia or hypoxia, or in the presence of either DMSO (vehicle control) or 1 mM DMOG. After treatment, lysates were analyzed for immunoreactivity to CEACAM6. HIF target and CEACAM6 signals were normalized to loading control (β-actin) for three to four independent repeats. Datapoints indicate individual repeats, and bars indicate mean ± SEM. Statistical testing by two-way ANOVA (see Table S1 for full results). Source data are available for this figure: SourceData F4.
Figure S2.
Figure S2.
pHe dependence of HIF-target induction. (A, B, and E) SW1222 or C99 cells were grown in media at either pH 6.4 or 7.4 for 48 h. Concurrently, cells were exposed to either (A and E) normoxia (21% O2) or hypoxia (1% O2) or exposed to (B) DMSO or 1 mM DMOG. After treatment, lysates were collected and analyzed for immunoreactivity to (A and B) CA9, LDHA, or (E) CDX1. (A and E) Signals normalized to loading control (β-actin) for three independent repeats. Statistical testing by two-way ANOVA. (C) C99 cells were grown in media at pH 7.4 with either no additional treatment, DMSO treatment, 1% O2, or 1 mM DMOG treatment for 48 h. Lysates were analyzed for CA9 and LDHA immunoreactivity. (D and F) SW1222 cells were grown at pH 7.4 or 6.4 under normoxia or hypoxia for 48 h, after which mRNA was extracted and RT-qPCR was performed for CA9 or CDX1 mRNA. Fold-change between hypoxia and normoxia calculated for each pHe treatment by ΔΔCT method using ACTB as the housekeeping gene (three or four independent repeats). Statistical testing by paired t test. * indicates P < 0.05. Datapoints indicate individual repeats, and bars indicate mean ± SEM. See Table S1 for full results of statistical testing. Source data are available for this figure: SourceData FS2.
Figure 5.
Figure 5.
Effect of the acidosis/hypoxia interaction on metabolic capacity and cell growth. (A) C99 cells were pre-treated for 48 h with or without 1 mM DMOG in media at pH 6.4 or 7.4. After pre-treatment, metabolic profiling commenced under DMOG-free conditions from a starting pH of 7.4 to assess capacity for fermentation (from acid production) and respiration (from oxygen consumption). (B) Complex I downregulation maintains respiratory suppression when hypoxia is imposed concurrently with acidosis. SW1222 cells were cultured in media at either pH 6.4 or 7.4 for 48 h under normoxia (21% O2) or hypoxia (1% O2). After treatment, lysates were analyzed for immunoreactivity to NDUFS1. All immunoblot signals were normalized to loading control (β-actin) for four independent repeats. Note, same loading control used as for Fig 4 B because NDUFS1 and PDK1 were blotted on the same membrane. (A and B) Datapoints indicate individual repeats, and bars indicate mean ± SEM. Statistical testing by two- or three-way ANOVA (see Table S1 for full results). (C) Cell growth measured in terms of protein biomass (SRB assay) after 6 days of culture, with an intermediary medium change on day 2. Treatment options included DMOG (1 mM) and incubation at pHe 6.4, 6.9, or 7.4. Data are grouped into five experimental blocks of four protocols each. Three SRB measurements (black datapoints) were collected from independent cell passages, the mean of which is denoted by bar height. Green arrows indicates growth that was lower than expected, based solely on the number of DMOG treatment days. Significance (*P < 0.05, **P < 0.01) was determined by one-sided t test for log2-transformed growth. This evaluated whether growth after the second protocol was below the value expected from an interpolation of the remaining three protocols to the number of days in DMOG, without considering treatment order. Source data are available for this figure: SourceData F5.
Figure 6.
Figure 6.
Acidotic hypoxia evokes a time-dependent decay of HIF-1α protein. (A–C) SW1222 cells were incubated for 24 h under normoxia (21% O2) followed by a period of up to 48 h under hypoxia (1% O2). Media were set to either (A) alkaline (pH 7.4) throughout the protocol, (B) alkaline during normoxia but acidic (pH 6.4) during hypoxia, or (C) acidic throughout the protocol. (D) SW1222 cells were exposed to 16 h normoxia or hypoxia in media at pH 6.4 or 7.4. (A–D) After treatments, lysates were analyzed for HIF-1α immunoreactivity. HIF-1α signals were normalized to loading control (β-actin) for three independent repeats. (E) RT-qPCR for HIF1A mRNA in C99 or SW1222 cells exposed to 48 h normoxia or hypoxia at either pHe 6.4 or 7.4. Fold-change relative to alkalotic normoxia calculated using the ΔΔCT method with ACTB as the housekeeping gene (four independent repeats). Datapoints indicate individual repeats, and bars indicate mean ± SEM. Statistical testing by (A–C) one-way ANOVA with Tukey’s test for multiple comparisons or (D and E) two-way ANOVA (see Table S1 for full results). Source data are available for this figure: SourceData F6.
Figure 7.
Figure 7.
Lysosomal pathway proteins are enriched under acidotic hypoxia. (A–C) Proteomic analyses of SW1222 cell lysates collected after 48 h treatment at pH 6.4 or 7.4 under normoxia (21% O2) or hypoxia (1% O2) for three independent replicates. (A) Heatmap of log2-transformed standardized LFQ abundance for proteins with significant interaction between acidosis and hypoxia (q < 0.05). Clustering identified a group of proteins (“E”) that increase in abundance selectively under acidic hypoxia. (B) Enrichment analysis (EnrichR) for cell compartment ontologies identifies autolysosome. Bar length indicates combined score of P value and odds ratio. Heatmap of differentially abundant proteins with a lysosomal GO annotation (q < 0.05 for effect of acidosis, hypoxia, or interaction). (C) Signal intensity of exemplar proteins associated with (auto)lysosomal processes; bars indicate mean, and black datapoints indicate individual replicates. Conditions labeled as Nor (normoxia), Hyp (hypoxia), Ac (pH 6.4), and Alk (pH 7.4). LFQ, label-free quantification.
Figure 8.
Figure 8.
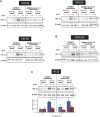
HIF-1α degradation under acidotic hypoxia is lysosomal dependent. (A and B) C99 and SW1222 cells were treated with normoxia (21% O2) or hypoxia (1% O2) in media at pHe 6.4 or 7.4 in the presence of DMSO or 20 nM bafilomycin A1. (C) VHL-null renal cell carcinoma cell line RCC4 was incubated in media at pH 6.4 or 7.4 under normoxic conditions. (D) SW1222 cells were treated with combinations of normoxia or hypoxia and pHe 6.4 or 7.4. (E) C99 cells were treated with vehicle control (DMSO) or 50 nM MG-132 in media at pH 6.4 or 7.4. (F and G) C99 cells were treated with combinations of normoxia or hypoxia and pHe 6.4 or 7.4, in the presence of DMSO, 50 nM MG-132, or 16 nM epoxomicin. After 48 h, lysates were analyzed for (A–C, E, and G) HIF-1α, (D) pVHL, or (F) ubiquitin immunoreactivity. Where quantified, HIF-1α or pVHL signals were normalized to loading control (β-actin). (H) Proteasomal activity in C99, SW1222, HT29, and HDC111 cells was measured by luminescent assay following 16 h treatment at pHe 6.4, 6.9, or 7.4 with DMSO or 1 mM DMOG. Luminescence was normalized to the signal of cell-free control wells. Where quantified, experiments were performed for three independent replicates. Datapoints indicate individual repeats, and bars indicate mean + SEM. Statistical testing by (C) paired t test or (D, E, and H) two-way ANOVA (see Table S1 for full results). Source data are available for this figure: SourceData F8.
Figure S3.
Figure S3.
Effects of proteasomal/pVHL and lysosomal inhibitors under acidotic hypoxia. (A–C) SW1222, HT29, or C99 cells were incubated under normoxia (21% O2) or hypoxia (1% O2) in media at pHe 6.4 or 7.4, either in the presence of DMSO (vehicle control), (A and B) 20 nM bafilomycin-A1, or (C) 100 µM VH-298. After 48 h treatment, lysates were collected and analyzed for HIF-1α, ubiquitin, or β-actin immunoreactivity. (A) Three independent repeats displayed, in addition to the repeat shown in Fig. 8 A. (C) HIF-1α signals were normalized to loading controls (β-actin) for three independent repeats. Datapoints indicate individual repeats, and bars indicate mean ± SEM. Statistical testing by three-way ANOVA (see Table S1 for full results). Source data are available for this figure: SourceData FS3.
Figure 9.
Figure 9.
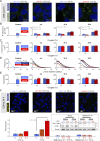
Acidotic hypoxia increases lysosomal abundance. CRC cells were incubated under normoxia (21% O2) or hypoxia (1% O2) in media at pH 6.4 or 7.4. (A and B) Treatment of C99 cells lasted up to 24 h and were followed by live-cell fluorescence imaging for Hoechst (nuclei) and LysoBrite Green (lysosomes) under normoxia and pHe 7.4. (A) Exemplar images at 24 h. (B and C) Quantification of LysoBrite–positive particles in terms of the number of lysosomes per cell (based on cell segmentation) and (C) lysosome size quantified as area. (D) Histogram of the distance from lysosome to its nearest nucleus, measured by applying a Euclidean distance transform to the binary image created from the segmented nuclear mask. Green dot indicates position at half-maximal abundance. (E) Quantification of the number of nuclei per field-of-view. (B, C, and E) Grey datapoints denote results from individual fields-of-view (three independent repeats). Black datapoints indicate mean of each independent repeat. (F) C99 cells were treated with normoxia or hypoxia in media at pH 6.4 or 7.4 for 24 h. Magic Red-(RR)2 was added at the start of incubations (1:260 dilution); Hoechst was added at the treatment end point, 30 min prior to imaging. Imaging sought evidence for fluorescence from the degradation product of Magic Red-(RR)2. Quantification from three independent repeats, each representing the average of 10–20 images per condition. Inset: pro-CTSB cleavage after the 24 h treatment. 20 nM bafilomycin-A1 was added to inhibit lysosome activity. Bars indicate mean + SEM. Statistical testing by (B) hierarchical two- or (F) three-way ANOVA with multiple comparisons (see Table S1 for full results). Source data are available for this figure: SourceData F9.
Figure S4.
Figure S4.
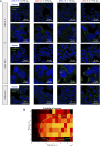
Imaging lysosomes. (A) Time course of lysosomal staining in response to combinations of acidosis and alkalosis with either hypoxia (1% O2) or normoxia (21% O2). Exemplar images of C99 cells, stained with Hoechst and LysoBrite Green prior to imaging. After treatment, live-cell fluorescence imaging was performed for nuclei (Hoechst) and lysosomes (LysoBrite Green) in imaging-compatible media at pHe 7.4 and normal atmosphere. Exemplar images are shown for low or high magnifications. Note, the high-magnification images at 24 h are shown in Fig. 8 A. (B) Criteria for classifying LysoBrite Green particles as lysosomes. Training used images selected at random and zoomed-in (>10 per image) for visual inspection. The software shortlisted particles that meet criteria of radius (range 2–10 pixels) and circularity of 1.0. Particles were presented to the inspector, who determined if the particle represents a lysosome or not. After repeating this process at least 6,000 times, data were summarized as a probability density map of radius and intensity to demarcate the 50% probability threshold (green line) defining criteria within which a particle is deemed to classify as a bona fide lysosome.
Figure 10.
Figure 10.
Acidotic hypoxia promotes autophagy. (A) SW1222 cells were incubated under (21% O2) or hypoxia (1% O2) at pHe 6.4 or 7.4. After 48 h of treatment, lysates were analyzed for markers of autophagy. LC3-II was normalized to loading control (β-actin). (B) Treatments were repeated in the absence or presence of 20 nM bafilomycin-A1 to suppress autophagosome-lysosome fusion. Quantification was performed for bafilomycin A1-exposed cells. (C) SW1222 cells were transfected with either non-targeting control siRNA (siScr) or siRNA-targeting TFEB (siTFEB). 24 h after transfection, cells were cultured for 48 h in media at pH 7.4 under either normoxia or hypoxia. Lysates were analyzed for TFEB and HIF-1α immunoreactivity, and signals were normalized to loading control (β-actin). (D and E) SW1222 or C99 cells were incubated under normoxia or hypoxia at pHe 6.4 or 7.4. After 48 h of treatment, lysates were analyzed for markers of mTORC1 signaling. pS6 signal was normalized to loading control (β-actin), and pS6K signal was normalized to S6K. Experiments were performed in three independent repeats. Datapoints indicate individual repeats, and bars indicate mean + SEM. Statistical testing by two- or three-way ANOVA (see Table S1 for full results). Source data are available for this figure: SourceData F10.
Figure S5.
Figure S5.
Regulation of the HIF-1α pHe/pO 2 interplay by mTORC1 and autophagy. SW1222 cells were incubated under normoxia (21% O2) or hypoxia (1% O2) at pHe 6.4 or 7.4 for 48 h. (A–C) Incubations in the presence of either DMSO, 100 nM rapamycin, or 5 nM 3-MA. After treatment, lysates were analyzed for markers of (B) HIF signaling or (A and C) mTORC1 signaling and autophagy. β-actin was used as a loading control. Source data are available for this figure: SourceData FS5.

Similar articles

References

    1. Balukoff, N.C., Ho J.J.D., Theodoridis P.R., Wang M., Bokros M., Llanio L.M., Krieger J.R., Schatz J.H., and Lee S.. 2020. A translational program that suppresses metabolism to shield the genome. Nat. Commun. 11:5755. 10.1038/s41467-020-19602-2 - DOI - PMC - PubMed
    1. Blaszczak, W., White B., and Swietach P.. 2024. Protocol for separating cancer cell subpopulations by metabolic activity using flow cytometry. STAR Protoc. 5:103105. 10.1016/j.xpro.2024.103105 - DOI - PMC - PubMed
    1. Blaszczak, W., Williams H., and Swietach P.. 2022. Autoregulation of H+/lactate efflux prevents monocarboxylate transport (MCT) inhibitors from reducing glycolytic lactic acid production. Br. J. Cancer. 127:1365–1377. 10.1038/s41416-022-01910-7 - DOI - PMC - PubMed
    1. Bock, P.E., and Frieden C.. 1976. Phosphofructokinase. I. Mechanism of the pH-dependent inactivation and reactivation of the rabbit muscle enzyme. J. Biol. Chem. 251:5630–5636. 10.1016/S0021-9258(17)33104-6 - DOI - PubMed
    1. Buffa, F.M., Harris A.L., West C.M., and Miller C.J.. 2010. Large meta-analysis of multiple cancers reveals a common, compact and highly prognostic hypoxia metagene. Br. J. Cancer. 102:428–435. 10.1038/sj.bjc.6605450 - DOI - PMC - PubMed

MeSH terms

Substances

LinkOut - more resources