. 2025 Jun 24;135(16):e180378.
doi: 10.1172/JCI180378. eCollection 2025 Aug 15.

BET inhibitors reduce tumor growth in preclinical models of gastrointestinal gene signature-positive castration-resistant prostate cancer

Affiliations

BET inhibitors reduce tumor growth in preclinical models of gastrointestinal gene signature-positive castration-resistant prostate cancer

Shipra Shukla et al. J Clin Invest. .

Abstract

A subgroup (~20%-30%) of castration-resistant prostate cancer (CRPC) aberrantly expresses a gastrointestinal (GI) transcriptome governed by 2 GI-lineage-restricted transcription factors, HNF1A and HNF4G. In this study, we found that expression of GI transcriptome in CRPC correlated with adverse clinical outcomes to androgen receptor (AR) signaling inhibitor treatment and shorter overall survival. Bromo- and extraterminal domain inhibitors (BETi) downregulated HNF1A, HNF4G, and the GI transcriptome in multiple CRPC models, including cell lines, patient-derived organoids, and patient-derived xenografts, whereas AR and the androgen-dependent transcriptome were largely spared. Accordingly, BETi selectively inhibited growth of GI transcriptome-positive preclinical models of prostate cancer. Mechanistically, BETi inhibited BRD4 binding at enhancers globally, including both AR and HNF4G bound enhancers, while gene expression was selectively perturbed. Restoration of HNF4G expression in the presence of BETi rescued target gene expression without rescuing BRD4 binding. This suggests that inhibition of master transcription factors expression underlies the selective transcriptional effects of BETi.

Keywords: Cell biology; Drug therapy; Epigenetics; Genetics; Oncology.


Conflict of interest statement

Conflict of interest: E Corey was a consultant for DotQuant and received institutional sponsored research funding from Sanofi, Gilead, AbbVie, Genentech, Janssen Research, AstraZeneca, GSK, Bayer Pharmaceuticals, Forma Pharmaceuticals, Foghorn, Kronos, and MarcoGenics. PC has received personal honoraria and advisory board and consulting fees from Deciphera, and Ningbo NewBay Medical Technology and institutional research funding from Pfizer/Array, Deciphera, Ningbo NewBay Medical Technology. YC has obtained research funding from Foghorn Therapeutics, royalties and stock ownership from Oric Pharmaceuticals, and consultation fees from FogPharma and Belharra Therapeutics.

Figures

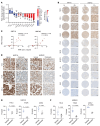
Figure 1
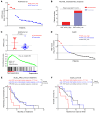
Figure 1. A high HNF score in CRPC correlates with adverse clinical outcomes.
(A) Patient stratification based on HNF scores in the Alumkal et al. data set (10). Each dot represents 1 patient. The HNF score was calculated as the log2 sum z score of mRNA expression of 11 genes. A sum z score ≥ 12 was annotated as a high HNF score and < 12 as a low HNF score. (B) Enzalutamide response of patient tumors with high and low HNF scores. Statistical significance was determined using Fisher’s exact test. (C) Comparison of HNF scores between enzalutamide nonresponders and responders (top) and GSEA plot of PCa_GI gene signature (bottom) in enzalutamide nonresponders compared with responders. P values determined by unpaired, 2-tailed t test. NES, normalized enrichment score. (D) Patient stratification based on HNF score expression in the SU2C data set. Each dot represents 1 patient. Tumors with a sum z score of ≥ 12 were annotated as expressing a high HNF score; a sum z score of ≤ 0 was a low HNF score; and a value between 0 and 12 was intermediate HNF_score. (E) Kaplan-Meier curve comparing ARSI outcome measures among the 3 groups stratified by HNF scores. P values were determined by log-rank (Mantel-Cox) test. (F) Kaplan-Meier curve comparing overall survival outcomes among the 3 groups stratified by HNF scores. P values were determined by log-rank (Mantel-Cox) test.
Figure 2
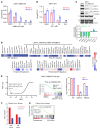
Figure 2. BETis downregulate the expression of HNF4G and HNF1A and their transcriptional signature.
(A) qRT-PCR showing expression of HNF1A after 4 hours of treatment with ABBV-075 and JQ1 at indicated doses. (B) qRT-PCR showing expression of HNF4G after 4 hours of treatment with ABBV-075 and JQ1 at indicated doses. (C) A representative immunoblot of 22Rv1 cells treated with JQ (0.5 μM), ABBV-075 (50 nM), and DMSO control for 24 hours against the indicated proteins (top). Bar graph (bottom) showing fold change in β-actin normalized band intensities of JQ1- and ABBV-075–treated samples over DMSO controls (n = 2). (D) Heat map of RNA-Seq expression of HNF signature genes in 22Rv1 cells after treatment with 25 nM ABBV-075 for 24 hours (top). (Bottom) The 2 heat maps show the modulation of AR target genes with ABBV-075 treatment using 2 different AR gene signatures. Data are plotted as the log2 difference in gene expression between ABBV-075– and DMSO-treated cells. Unadjusted P values are shown: *P < 0.05, **P < 0.01, ***P < 0.001, and ****P < 0.0001. (E) Global representation of GSEA analysis of RNA-Seq gene expression data set of 22RV1 cells treated with 25 nM ABBV-075 for 24 hours. The x-axis shows the normalized enrichment score, and y-axis is the FDR q-value (q-val). The PCa_GI and the HNF1A- and HNF4G-regulated gene sets are indicated in red. A GSEA plot of PCa_GI gene signature is shown (middle). (Right) A bar diagram shows the expression of AR, HNF1A, and HNF4G. NES, normalized enrichment score. (F) Modulation of HNF and AR scores by BETi ZEN-3694 in paired tumor biopsy specimens of patient 101047. (G) GSEA plots of PCa_GI gene signature in ZEN-3694–treated tumors compared with pretreated tumor. NES, normalized enrichment score.
Figure 3
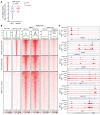
Figure 3. Inhibition of HNF4G transcription accounts for BETi-mediated inhibition of GI transcriptome.
(A) Violin plot of log2 fold changes in expression of HNF score genes by ABBV-075 treatment in 22Rv1 cells exogenously expressing GFP or HNF4G compared with DMSO control. The median is represented by a solid line, and the first and third quartiles are indicated by dashed lines with all dots plotted. Statistical analysis was performed using a 2-tailed paired t test. “Diff” represents the difference in log2-normalized gene expression counts of HNF score genes between ABBV-075–treated and DMSO-treated samples in GFP- and HNF4G-overexpressing cells. (B) Histograms (top) show the average normalized tag counts of AR and HNF4G in parental 22Rv1 cells and that of BRD4 in GFP- or HNF4G-expressing 22Rv1 cells treated with ABBV-075 or DMSO at top 1,000 HNF4G, 1,000 AR binding sites, and BRD4-only enhancer binding sites. Heat map shows the tag densities of HNF4G, AR, and that of BRD4 at HNF4G (top) or AR (middle) binding sites. Bottom panel show the tag densities of BRD4 at 10,961 BRD4-only sites in GFP- or HNF4G-expressing 22Rv1 cells treated with ABBV-075 or DMSO. (C) ChIP-Seq profiles of HNF4G in parental 22Rv1 cells and BRD4 (DMSO treatment), and BRD4 (ABBV-075 treatment) in GFP- or HNF4G-expressing 22Rv1 cells at selected HNF4G target genes loci: HNF1A, CCN2, CLRN3, F5, MUC13, and VIL1 in top to bottom order.
Figure 4
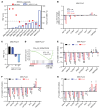
Figure 4. Patient-derived organoids with high HNF scores show increased sensitivity to BETi-mediated growth inhibition.
(A) IC50 of ABBV-075 in a panel of patient-derived tumor biopsy specimens grown as organoids. The left-side y-axis plots the HNF scores of each organoid and the right-side y-axis shows the IC50 values. (B) RNA-Seq gene expression changes of selected genes at different doses of ABBV-075 treatment of MSK-PCa17 cells compared with DMSO control. Data are presented as the log2-fold difference in expression (ABBV-075 vs DMSO). (C) A bar graph showing changes in HNF score expression in MSK-PCa17 cells at different dosesh of ABBV-075 treatment compared with DMSO control. (D) GSEA analysis indicating the negative enrichment of PCa_GI gene signature gene set in MSK-PCa17 cells treated with ABBV-075 (10 nM) compared with DMSO control. NES, normalized enrichment score. (E) qRT-PCR showing expression of selected genes after 4 hours of treatment with ABBV-075 at indicated doses in MSK-PCa17 cells (n = 3). (F) qRT-PCR showing expression of selected genes after 4 hours of treatment with ABBV-075 at indicated doses in MSK-PCa13 cells (n = 3). (G) qRT-PCR showing expression of selected genes after 4 hours of treatment with ABBV-075 at indicated doses in MSK-PCa10 cells (n = 3). P values were obtained from an unpaired, 2-tailed t test. *P < 0.05, **P < 0.01, ***P < 0.001, and ****P < 0.0001.
Figure 5
Figure 5. CRPC PDXs expressing high HNF score are sensitive to BET inhibition.
(A) Treatment response of LuCaP PDXs when treated with pelabresib (30 mg/kg) or vehicle (1% carboxymethyl cellulose) twice a day. Treatment was started when tumors reached a volume of approximately 100 mm3. Data are plotted as the fold change in tumor volume between pelabresib and vehicle-treated tumors after 4 weeks of treatment. n = 2–5 for different PDX; data are mean ± SEM. P values were obtained from a 2-tailed unpaired t test. *P < 0.05, **P < 0.01, and ***P < 0.001. The HNF score of PDXs is shown on top of the graph. (B) Representative images of HNF4G and HNF1A IHC in LuCaP PDX tissue microarrays at a lower (×6) and higher magnification (×40; scale bar: 50 μm) (n = 3). (C) Correlation between 11-gene HNF sum z score and HNF4G and HNF1A IHC stain-based H scores of each PDX shown in B. Pearson’s correlation coefficient and P values are indicated on each plot. (D) Representative images of HNF4G and HNF1A IHC in selected LuCaP PDXs when treated with pelabresib or vehicle control. Scale bar: 20 μm. (E) Scatter plots of HNF1A IHC H-scores in vehicle- and pelabresib-treated PDX tumors. Data are mean ± SEM. P values were obtained from a 2-tailed unpaired t test. (F) Scatter plots of HNF1A IHC H scores in vehicle- and pelabresib-treated PDX tumors. Data are mean ± SEM. P values were obtained from a 2-tailed unpaired t test.
Figure 6
Figure 6. Pelabresib treatment inhibits proliferation and induces senescence in LuCaP 70CR.
(A) UMAPs of single cells isolated from vehicle- or pelabresib-treated LuCaP 70CR tumors. (B) UMAPs depicting proliferation scores of single cells isolated from vehicle- or pelabresib-treated tumors. (C) UMAPs depicting senescence scores of single cells isolated from vehicle- or pelabresib-treated tumors. (D) Representative IHC staining and quantification of Ki67 and p21 in pelabresib- or vehicle-treated tumors and quantification. Scale bar: 50 μm. n = 2. P values were obtained from a 2-tailed unpaired t test. (E) Violin plot of HNF1A expression in single cells obtained from pelabresib- or vehicle-treated tumors. The median is shown by a solid line and the first and third quartiles are shown by dashed lines. The P value was obtained from an unpaired t test. (F) Violin plot of HNF4G expression in single cells obtained from vehicle- or pelabresib-treated tumors. The median is shown by a solid line; the first and third quartiles are shown by dashed lines. The P value was obtained from an unpaired t test. (G) Representative IHC staining and quantification of HNF1A and HNF4G in pelabresib- or vehicle-treated tumors and quantification (n = 2). Scale bar: 20 μm. n = 2. P values were obtained from a 2-tailed unpaired t test. (H) Violin plot depicting the HNF score in single cells obtained from vehicle- or pelabresib-treated tumors. The median is shown by a solid line; the first and third quartiles are shown by dashed lines. The P value was obtained from an unpaired t test. (I) Violin plot depicting AR expression in single cells obtained from vehicle- or pelabresib-treated tumors. The median is shown by a solid line and the first and third quartiles are shown by dashed lines. The P value was obtained from unpaired t test. (J) Violin plot depicting the AR score in single cells obtained from vehicle- or pelabresib-treated tumors. The median is shown by a solid line and the first and third quartiles are shown by dashed lines. The P value was obtained from an unpaired t test.
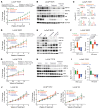
Figure 7
Figure 7. Combination efficacy of enzalutamide and pelabresib in AR-positive CRPC PDX models.
(A) Treatment response of LuCaP 70CR PDX in SCID mice when treated with vehicle (0.5% methylcellulose/0.2% Tween-80 in sterile water), enzalutamide (50 mg/kg), pelabresib (30 mg/kg), or enzalutamide and pelabresib. Enzalutamide and pelabresib were oral gavaged once and twice a day, respectively (n = 5 for all treatments). Treatment was started when tumors reached a volume of approximately 100 mm3. Fold change in growth rate over day 0 (start of treatment) is shown. Data are mean ± SEM. P values were determined from a 2-tailed unpaired t test. (B) Immunoblots of 3 representative tumor explants obtained at the end of the experiment shown in A. (C) qRT-PCR analysis of HNF1A, MUC13, TMPRSS2, and KLK3 mRNA levels in tumors harvested at the end of the study. n = 3 for each treatment condition. (D) Treatment response of LuCaP 35CR PDX in SCID mice when treated with vehicle, enzalutamide, pelabresib, or enzalutamide and pelabresib. Treatment conditions were the same as described in A (n = 3 for all treatments). Fold change in growth rate over day 0 (start of treatment) is shown. Data are mean ± SEM. P values were determined from a 2-tailed unpaired t test. (E) Immunoblots of 2 representative tumors obtained at the end of the study shown in D. (F) Left panel shows HNF score modulation in LuCaP 35CR tumors treated with different drugs, as shown in D. The HNF score was calculated using RNA-Seq gene expression generated from explanted tumors at the end of the study. The right panel shows modulation of AR signaling using the AR score. P values were determined from a 2-tailed unpaired t test, n = 3. (G) Treatment response of LuCaP 77CR PDX in SCID mice when treated with vehicle, enzalutamide, pelabresib, or enzalutamide and pelabresib. Treatment conditions were same as described in A (n = 3 for all treatments). Fold change in growth rate over day 0 (start of treatment) is shown. Data are mean ± SEM. P values were determined from a 2-tailed unpaired t test. (H) Immunoblots of 3 representative tumors obtained at the end of the study shown in G. (I) HNF score (left) and AR score (right) modulation in LuCaP 77CR tumors treated with different drugs as shown in G. (J) Treatment response of LuCaP 49, LuCaP 145.2, and LuCaP 93 PDXs in SCID mice when treated with vehicle, enzalutamide, pelabresib or enzalutamide and pelabresib. Treatment conditions were same as described in A. n = 3 for each treatment condition in each PDX line. P values were determined from a 2-tailed unpaired t test (n = 2).

Update of

References

    1. Sequist LV, et al. Genotypic and histological evolution of lung cancers acquiring resistance to EGFR inhibitors. Sci Transl Med. 2011;3(75):75ra26. doi: 10.1126/scitranslmed.3002003. - DOI - PMC - PubMed
    1. Beltran H, et al. Divergent clonal evolution of castration-resistant neuroendocrine prostate cancer. Nat Med. 2016;22(3):298–305. doi: 10.1038/nm.4045. - DOI - PMC - PubMed
    1. Quintanal-Villalonga Á, et al. Lineage plasticity in cancer: a shared pathway of therapeutic resistance. Nat Rev Clin Oncol. 2020;17(6):360–371. doi: 10.1038/s41571-020-0340-z. - DOI - PMC - PubMed
    1. Watson PA, et al. Emerging mechanisms of resistance to androgen receptor inhibitors in prostate cancer. Nat Rev Cancer. 2015;15(12):701–711. doi: 10.1038/nrc4016. - DOI - PMC - PubMed
    1. Labrecque MP, et al. Molecular profiling stratifies diverse phenotypes of treatment-refractory metastatic castration-resistant prostate cancer. J Clin Invest. 2019;129(10):4492–4505. doi: 10.1172/JCI128212. - DOI - PMC - PubMed

MeSH terms