. 2025 Jun 24;10(14):e190924.
doi: 10.1172/jci.insight.190924. eCollection 2025 Jul 22.

MUC1-C dependence in treatment-resistant prostate cancer uncovers a target for antibody-drug conjugate therapy

Affiliations

MUC1-C dependence in treatment-resistant prostate cancer uncovers a target for antibody-drug conjugate therapy

Keisuke Shigeta et al. JCI Insight. .

Abstract

Androgen receptor-positive prostate cancer (PC), castration-resistant prostate cancer (CRPC), and neuroendocrine prostate cancer (NEPC) invariably become resistant to treatment with targeted and cytotoxic agents. Multiple pathways have been identified as being responsible for these pleiotropic mechanisms of resistance. The mucin 1 (MUC1) gene is aberrantly expressed in CRPC/NEPC in association with poor clinical outcomes; however, it is not known if the oncogenic MUC1-C/M1C protein drives treatment resistance. We demonstrated that MUC1-C is necessary for resistance of (i) PC cells to enzalutamide (ENZ) and (ii) CRPC and NEPC cells to docetaxel (DTX). Our results showed that MUC1-C-mediated resistance is conferred by upregulation of aerobic glycolysis and suppression of reactive oxygen species necessary for self-renewal. Dependence of these resistant phenotypes on MUC1-C for the cancer stem cell (CSC) state identified a potential target for treatment. In this regard, we further demonstrated that targeting MUC1-C with an M1C antibody-drug conjugate (ADC) is highly effective in suppressing (i) self-renewal of drug-resistant CRPC/NEPC CSCs and (ii) growth of treatment-emergent NEPC tumor xenografts derived from drug-resistant cells and a patient with refractory disease. These findings uncovered a common MUC1-C-dependent pathway in treatment-resistant CRPC/NEPC progression and identified MUC1-C as a target for their therapy with an M1C ADC.

Keywords: Cancer; Drug therapy; Oncology; Therapeutics; Urology.


Conflict of interest statement

Conflict of interest: DK has equity in Genus Oncology and is a consultant to CanBas.

Figures

Figure 1
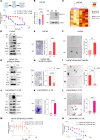
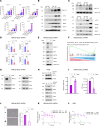
Figure 1. LNCaP-ER cells are dependent on MUC1-C for ENZ resistance and self-renewal.
(A) Parental LNCaP and LNCaP-ER cells treated with ENZ for 3 days were analyzed for cell viability by Alamar blue staining. (B) LNCaP and LNCaP-ER cells were analyzed for MUC1-C transcripts by quantitative reverse-transcription PCR (qRT-PCR) (left). Immunoblot analysis of lysates from LNCaP and LNCaP-ER cells (right). (C) Heatmap of NE and CSC marker gene expression from qRT-PCR analysis of biological triplicates of LNCaP-WT and LNCaP-ER cells. (D) Immunoblot analysis of lysates from LNCaP and LNCaP-ER cells run contemporaneously in parallel. (E) LNCaP and LNCaP-ER cells treated with 10 μM ENZ for 3 days were analyzed for colony formation. Representative photomicrographs of stained colonies (left). Results (mean ± SD of 3 determinations) expressed as relative colony number compared with untreated cells (assigned a value of 1) (t test; n = 3) (right). (F) LNCaP and LNCaP-ER cells were analyzed for tumorsphere formation. Representative photomicrographs of tumorspheres (left). Results (mean ± SD of 3 determinations) expressed as tumorsphere number (t test; n = 3) (right). (G) Immunoblot analysis of lysates from LNCaP-ER/tet-MUC1shRNA cells treated with vehicle or doxycycline (DOX) for 7 days run at different times. (H) LNCaP-ER/tet-MUC1shRNA cells treated with vehicle or DOX for 7 days were analyzed for colony formation (t test; n = 3). (I) LNCaP-ER/tet-MUC1shRNA cells treated with vehicle or DOX for 7 days were analyzed for tumorsphere formation (t test; n = 3). (J) Immunoblot analysis of lysates from LNCaP and LNCaP/MUC1-C OE cells run contemporaneously in parallel. (K) LNCaP and LNCaP/MUC1-C OE cells were analyzed for colony formation (t test; n = 3). (L) LNCaP and LNCaP/MUC1-C OE cells were analyzed for tumorsphere formation (t test; n = 3). (M) LNCaP-ER/tet-MUC1shRNA cells treated with vehicle or DOX for 7 days and then with ENZ for 3 days were analyzed for cell viability. (N) LNCaP and LNCaP/MUC1-C OE cells were treated with ENZ for 3 days and analyzed for cell viability. **P < 0.01, ***P < 0.001, and ****P < 0.0001.
Figure 2
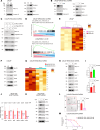
Figure 2. MUC1-C/MYC pathway regulates aerobic glycolysis, ENZ resistance, and the CSC state in LNCaP-ER cells.
(A and B) Immunoblot analysis of chromatin from LNCaP and LNCaP-ER cells (A) and LNCaP-ER/tet-MUC1shRNA (B) cells treated with DOX for 7 days each run contemporaneously in parallel. (C) Immunoblot analysis of lysates from LNCaP-ER cells expressing the indicated vectors treated with DOX for 7 days run contemporaneously in parallel. (D) GSEA of RNA-Seq data from LNCaP-ER cells with MUC1-C silencing and LNCaP/MUC1-C OE cells using the HALLMARK MYC TARGETS V1 signature. NES, normalized enrichment score. (E) Heatmap of glycolysis gene expression in LNCaP and LNCaP-ER cells. (F) Immunoblot analysis of lysates from LNCaP and LNCaP-ER cells run contemporaneously in parallel. (G) Heatmap of glycolysis gene expression of LNCaP-ER/tet-MUC1shRNA cells treated with DOX for 7 days. (H) Immunoblot analysis of lysates from LNCaP-ER/tet-MUC1shRNA cells treated with DOX for 7 days run contemporaneously in parallel. (I) LNCaP-ER cells treated with 3 μM GO-203 (upper) and LNCaP-ER/tet-MUC1shRNA cells treated with DOX for 7 days (lower) were assayed for OCR and ECAR. The OCR/ECAR results (mean ± SD of 4 determinations) are expressed as the relative ratio compared with untreated cells (t test; n = 3). (J) LNCaP-ER/tet-MYCshRNA cells treated with DOX for 7 days were analyzed for the indicated transcripts by qRT-PCR. The results (mean ± SD of 4 determinations) are expressed as relative levels compared with untreated cells (assigned a value of 1) (t test; n = 3). (K) Immunoblot analysis of lysates from LNCaP-ER/tet-MYCshRNA cells treated with DOX for 7 days run contemporaneously in parallel. (L) LNCaP-ER/tet-MYCshRNA cells treated with vehicle or DOX for 7 days were analyzed for tumorsphere formation. Representative photomicrographs of tumorspheres (left). Results (mean ± SD of 3 determinations) expressed as tumorsphere number (t test; n = 3). (M) LNCaP-ER/tet-MYCshRNA cells treated with DOX for 7 days and then ENZ for 3 days were analyzed for cell viability. **P < 0.01, and ***P < 0.001.
Figure 3
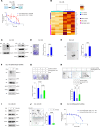
Figure 3. DU-145-DR cells are dependent on MUC1-C for DTX resistance and self-renewal capacity.
(A) Parental DU-145 and DU-145-DR cells treated with DTX for 3 days were analyzed for cell viability. (B) Heatmap of NE, CSC, and glycolytic gene expression from qRT-PCR analysis of biological triplicates of DU-145 and DU-145-DR cells. (C) Immunoblot analysis of DU-145 and DU-145-DR cell lysates run at different times. (D) DU-145 and DU-145-DR cells were analyzed for colony formation. Representative photomicrographs of stained colonies (left). Results (mean ± SD of 3 determinations) expressed as relative colony number compared with DU-145 cells (assigned a value of 1) (t test; n = 3) (right). (E) DU-145 and DU-145-DR cells were analyzed for tumorsphere formation (t test; n = 3). (F) Immunoblot analysis of lysates from DU-145-DR/tet-MUC1shRNA cells treated with DOX for 7 days run contemporaneously in parallel. (G) DU-145-DR cells expressing tet-MUC1shRNA and/or tet-MUC1-CD vectors treated with vehicle or DOX for 7 days were analyzed for colony formation (t test; n = 3). (H) DU-145-DR cells expressing tet-MUC1shRNA and/or tet-MUC1-CD vectors were treated with vehicle or DOX for 7 days and analyzed for tumorsphere formation (t test; n = 3). (I) Lysates from DU-145-DR cells treated with vehicle or 3 μM GO-203 for 3 days were immunoblotted with antibodies against the indicated proteins run contemporaneously in parallel. (J) DU-145-DR cells treated with vehicle or 3 μM GO-203 for 3 days were analyzed for tumorsphere formation (t test; n = 3). (K) DU-145-DR/tet-MUC1shRNA cells treated with DOX for 7 days and then with DTX for 3 days were analyzed for cell viability. *P < 0.05, **P < 0.01, ***P < 0.001, and ****P < 0.0001.
Figure 4
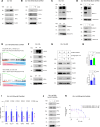
Figure 4. DU-145-DR cells are dependent on the MUC1-C/MYC axis for regulation of glycolytic enzyme expression and DTX resistance.
(A) Immunoblot analysis of DU-145 and DU-145-DR cell lysates run contemporaneously in parallel. (B) Immunoblot analysis of lysates from DU-145-DR/tet-MUC1shRNA cells treated with DOX for 7 days run contemporaneously in parallel. (C) Immunoblot analysis of chromatin from DU-145 and DU-145-DR cells run at different times. (D) Immunoblot analysis of chromatin from DU-145-DR/tet-MUC1shRNA cells treated with DOX for 7 days run at different times. (E) GSEA of RNA-Seq from DU-145-DR cells with MUC1-C silencing using the HALLMARK MYC TARGETS and REACTOME GLYCOLYSIS gene signatures. (F) Immunoblot analysis of DU-145 and DU-145-DR cell lysates run at different times. (G) Immunoblot analysis of lysates from DU-145-DR cells expressing the indicated vectors and treated with DOX for 7 days run at different times. (H) DU-145-DR cells treated with vehicle or 3 μM GO-203 (upper) and DU-145-DR/tet-MUC1shRNA cells treated with vehicle or DOX for 7 days (lower) were assayed for OCR and ECAR. The OCR/ECAR results (mean ± SD of 4 determinations) are expressed as the relative ratio compared with untreated cells (t test; n = 3). (I) DU-145-DR/tet-MYCshRNA cells treated with DOX for 7 days were analyzed for the indicated transcripts by qRT-PCR (t test; n = 3). (J) Immunoblot analysis of lysates from DU-145-DR/tet-MYCshRNA cells treated with DOX for 7 days run contemporaneously in parallel. (K) DU-145-DR/tet-MYCshRNA cells treated with DOX for 7 days and then DTX for 3 days were analyzed for cell viability. *P < 0.05, and **P < 0.01.
Figure 5
Figure 5. MUC1-C integrates redox balance and the drug-resistant phenotype.
(A and B) LNCaP-ER/tet-MUC1shRNA (A) and DU-145-DR/tet-MUC1shRNA cells treated with DOX for 7 days (B) were analyzed for ROS and ATP levels. The results (mean ± SD of 3 determinations) are expressed as (i) relative ROS levels compared with vehicle-treated cells (assigned a value of 1) and (ii) absolute ATP levels as determined by luminescence (t test; n = 3). (C and D) LNCaP-ER (C) and DU-145-DR (D) cells treated with 3 μM GO-203 for 3 days were analyzed for ROS and ATP levels (t test; n = 3). (E and F) Immunoblot analysis of chromatin from LNCaP-ER (E) and DU-145-DR (F) cells treated with 3 μM GO-203 for 3 days run contemporaneously in parallel. (G and H) LNCaP-ER (G) and DU-145-DR (H) cells treated with 3 μM GO-203 and ENZ or DTX were analyzed for cell viability. (I) LNCaP-ER cells treated with 10 μM ENZ, 3 μM GO-203, and the combination of GO-203 and ENZ for 3 days were analyzed for ROS levels. (J) LNCaP-ER cells were treated with GO-203 and ENZ for 3 days. Indicated are the combination indices determined using ΔBliss scores. (K) DU-145-DR cells treated with 10 μM DTX, 3 μM GO-203, and the combination of GO-203 and DTX for 3 days were analyzed for ROS levels. (L) DU-145-DR cells treated with GO-203 and DTX for 3 days. Indicated are the combination indices determined using ΔBliss scores. (M) Treatment schedule for castrated nude mice with 100 mm3 DU-145-DR tumors. (N) Tumor volumes (mean ± SD) at the end of the study were (i) PBS, 1,720.9 ± 607.3 mm3; (ii) DTX, 1,090.5 ± 493.5 mm3; (iii) GO-203, 648.7 ± 371.5 mm3; and (iv) DTX+GO-203, 126.9 ± 116.9 mm3. (O) Representative IHC images of DU-145-DR tumors treated with DTX, GO-203, and GO-203+DTX and stained with H&E and for MUC1-C and LDHA. Scale bars, 50 μm. *P < 0.05, **P < 0.01, and ***P < 0.001.
Figure 6
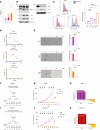
Figure 6. MUC1-C regulates redox balance, the NE phenotype, and drug resistance in H660 t-NEPC cells.
(A) Cells were analyzed for the indicated transcripts by qRT-PCR. The results (mean ± SD of 4 determinations) are expressed as relative levels compared with that obtained for LNCaP cells (assigned a value of 1) (t test; n = 3). (B) Immunoblot analysis of cell lysates run contemporaneously in parallel. (C) Immunoblot analysis of chromatin run at different times. (D) H660/tet-MUC1shRNA cells treated with DOX for 7 days were analyzed for the indicated transcripts by qRT-PCR (t test; n = 3). (E) Immunoblot analysis of chromatin from H660/tet-MUC1shRNA cells treated with DOX for 7 days run contemporaneously in parallel. (F) RNA-Seq was performed in triplicate on H660/tet-MUC1shRNA cells treated with DOX for 7 days. GSEA was performed using the DESCARTES FETAL LUNG NEUROENDOCRINE CELLS gene signature. (G) Immunoblot analysis of lysates from H660/tet-MUC1shRNA cells treated with DOX for 7 days were immunoblotted run at different times. (H) Immunoblot analysis of lysates from H660 cells treated with 3 μM GO-203 run at different times. (I) H660/tet-MUC1shRNA cells treated with DOX for 7 days were analyzed for ROS and ATP levels (t test; n = 3). (J) H660/tet-MUC1shRNA cells treated with DOX for 7 days were analyzed for tumorsphere formation (t test; n = 3). (K) H660/tet-MUC1shRNA cells treated with DOX for 7 days and then DTX for 3 days were analyzed for cell viability. (L) H660 cells treated with 3 μM GO-203 for 3 days and then DTX for 3 days were analyzed for cell viability. *P < 0.05, **P < 0.01, ***P < 0.001, and ****P < 0.0001.
Figure 7
Figure 7. Targeting MUC1-C with an ADC is effective against t-NEPC cells growing in vitro and as tumor xenografts.
(A) Cells were analyzed for the indicated transcripts by qRT-PCR. The results (mean ± SD of 4 determinations) are expressed as relative levels compared with that obtained for H660 cells (assigned a value of 1) (t test; n = 3). (B) Immunoblot analysis of chromatin from H660, WCM154, and WCM155 cells run at different times. (C) Cells were analyzed by flow cytometry with a control IgG and MAb-3D1. Shown are histograms and percentage of positive for MUC1-C expression (left). The bar plot depicts MFI fold-change (MAb-3D1/IgG). The results (mean ± SD of 3 determinations) are expressed as relative levels compared with that obtained for 3D1-negative control cells (assigned a value of 1) (right). (D) Cells treated with PBS or M1C ADC for 7 days were analyzed for cell viability. (E) Cells treated with 50 nM M1C ADC for 7 days were analyzed for tumorsphere formation (t test; n = 3). (F) Treatment schedule for NSG mice with 100 mm3 H660 tumors. (G) Tumor volumes (mean ± SD) on day 42 were 1,810.9 ± 467.0 mm3 in the PBS group and 47.5 ± 41.3 mm3 in the M1C ADC group (P value = 0.001). (H) Percentage change in volume from baseline shown as a waterfall plot. (I) Treatment schedule for NOD/SCID-γ mice with 100 mm3 WCM154 patient-derived xenograft (PDX) tumors. (J) Tumor volumes (mean ± SD) for 6 mice on day 44 were 1,152.6 ± 384.9 mm3 in the PBS control group and 28.4 ± 32.2 mm3 in the M1C ADC group (P value = 0.018). (K) Percentage change in volume for each WCM154 tumor from baseline shown as a waterfall plot. Scale bar, 100 μm. *P < 0.05, **P < 0.01, ***P < 0.001, and ****P < 0.0001.
Figure 8
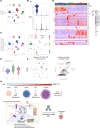
Figure 8. Analysis of scRNA-Seq data derived from treatment-resistant CRPCs and NEPCs identifies MUC1 associations with glycolysis, stemness, and NE differentiation.
(A) Uniform manifold approximation and projection (UMAP) of scRNA-Seq data from patient treatment-resistant CRPC/AR+, CRPC/AR, and NEPC cells. (B) AR and MUC1 expression by CRPC/AR+, CRPC/AR, and NEPC subtypes. Median expression per cluster is shown as a horizontal line. (C) UMAP of scRNA-Seq data from the indicated patient tumor samples (left). Overlap of MUC1, AR, and KLK3 normalized gene expression (right). (D) Heatmaps depicting CRPC/AR+, CRPC/AR, and NEPC cell expression of candidate genes associated with AR signaling, glycolysis, NEPC and CSC gene signatures. (E) Gene set enrichment was performed for CRPC/AR+, CRPC/AR, and NEPC cells using the HALLMARK GLYCOLYSIS gene signature. Each point represents the average score per tumor. Median gene signature scores per cluster are shown as horizontal lines. (F) UMAP showing the scores per cell using the HALLMARK_GLYCOLYSIS gene signature (left). Pearson’s correlation plots for CRPC/AR+, CRPC/AR, and NEPC cells using imputed gene expression of MUC1 and HALLMARK GLYCOLYSIS enrichment scores (right). (G) Depiction of MUC1-C dependence in treatment-resistant CRPC/NEPC. Selection of AR-positive LNCaP cells for ENZ resistance and AR-negative DU-145 cells for DTX resistance induces MUC1-C expression and dependence on MUC1-C for the drug-resistant phenotype. Consistent with MUC1-C suppression of AR (12), progression of ENZ- and DTX-resistant PC to t-NEPC is associated with increasing MUC1-C and decreasing AR levels. Progression of drug-resistant PC to t-NEPC is dependent on activation of the MUC1-C/MYC axis and thereby effectors of the glycolytic pathway that regulate ROS and ATP levels necessary for maintaining the CSC state and treatment resistance. In support of MUC1-C addiction, we demonstrate that an M1C ADC is highly effective against t-NEPC cell self-renewal and tumorigenicity.

Similar articles

References

    1. Seton-Rogers S. Prostate cancer: connecting androgen receptor and immunity. Nat Rev Cancer. 2016;16(5):273. - PubMed
    1. Watson PA, et al. Emerging mechanisms of resistance to androgen receptor inhibitors in prostate cancer. Nat Rev Cancer. 2015;15(12):701–711. doi: 10.1038/nrc4016. - DOI - PMC - PubMed
    1. Beltran H, et al. The role of lineage plasticity in prostate cancer therapy resistance. Clin Cancer Res. 2019;25(23):6916–6924. doi: 10.1158/1078-0432.CCR-19-1423. - DOI - PMC - PubMed
    1. Tilki D, et al. EAU-EANM-ESTRO-ESUR-ISUP-SIOG guidelines on prostate cancer. Part II-2024 update: treatment of relapsing and metastatic prostate cancer. Eur Urol. 2024;86(2):164–182. doi: 10.1016/j.eururo.2024.04.010. - DOI - PubMed
    1. Puca L, et al. Patient derived organoids to model rare prostate cancer phenotypes. Nat Commun. 2018;9(1):2404. doi: 10.1038/s41467-018-04495-z. - DOI - PMC - PubMed

MeSH terms