. 2025 Aug 15:317:121300.
doi: 10.1016/j.neuroimage.2025.121300. Epub 2025 Jun 17.

Aphasia severity prediction using a multi-modal machine learning approach

Affiliations

Aphasia severity prediction using a multi-modal machine learning approach

Xinyi Hu et al. Neuroimage. .

Abstract

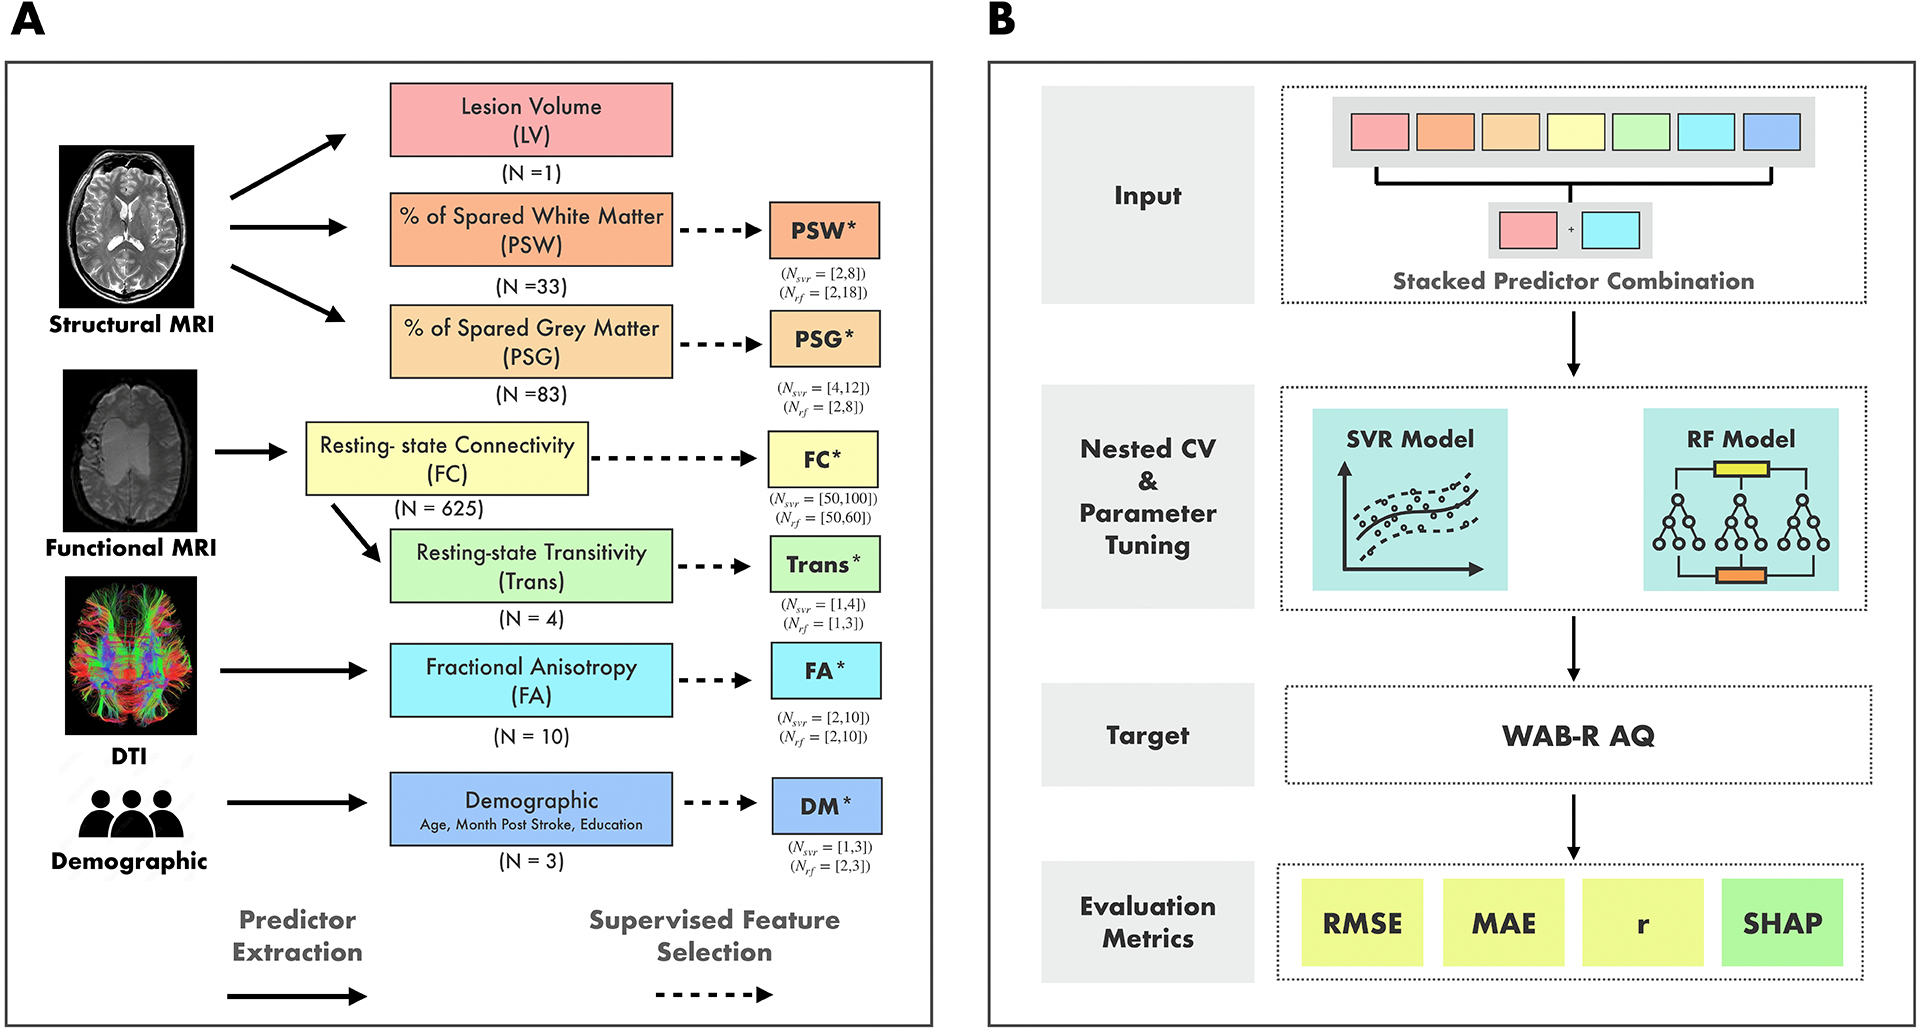
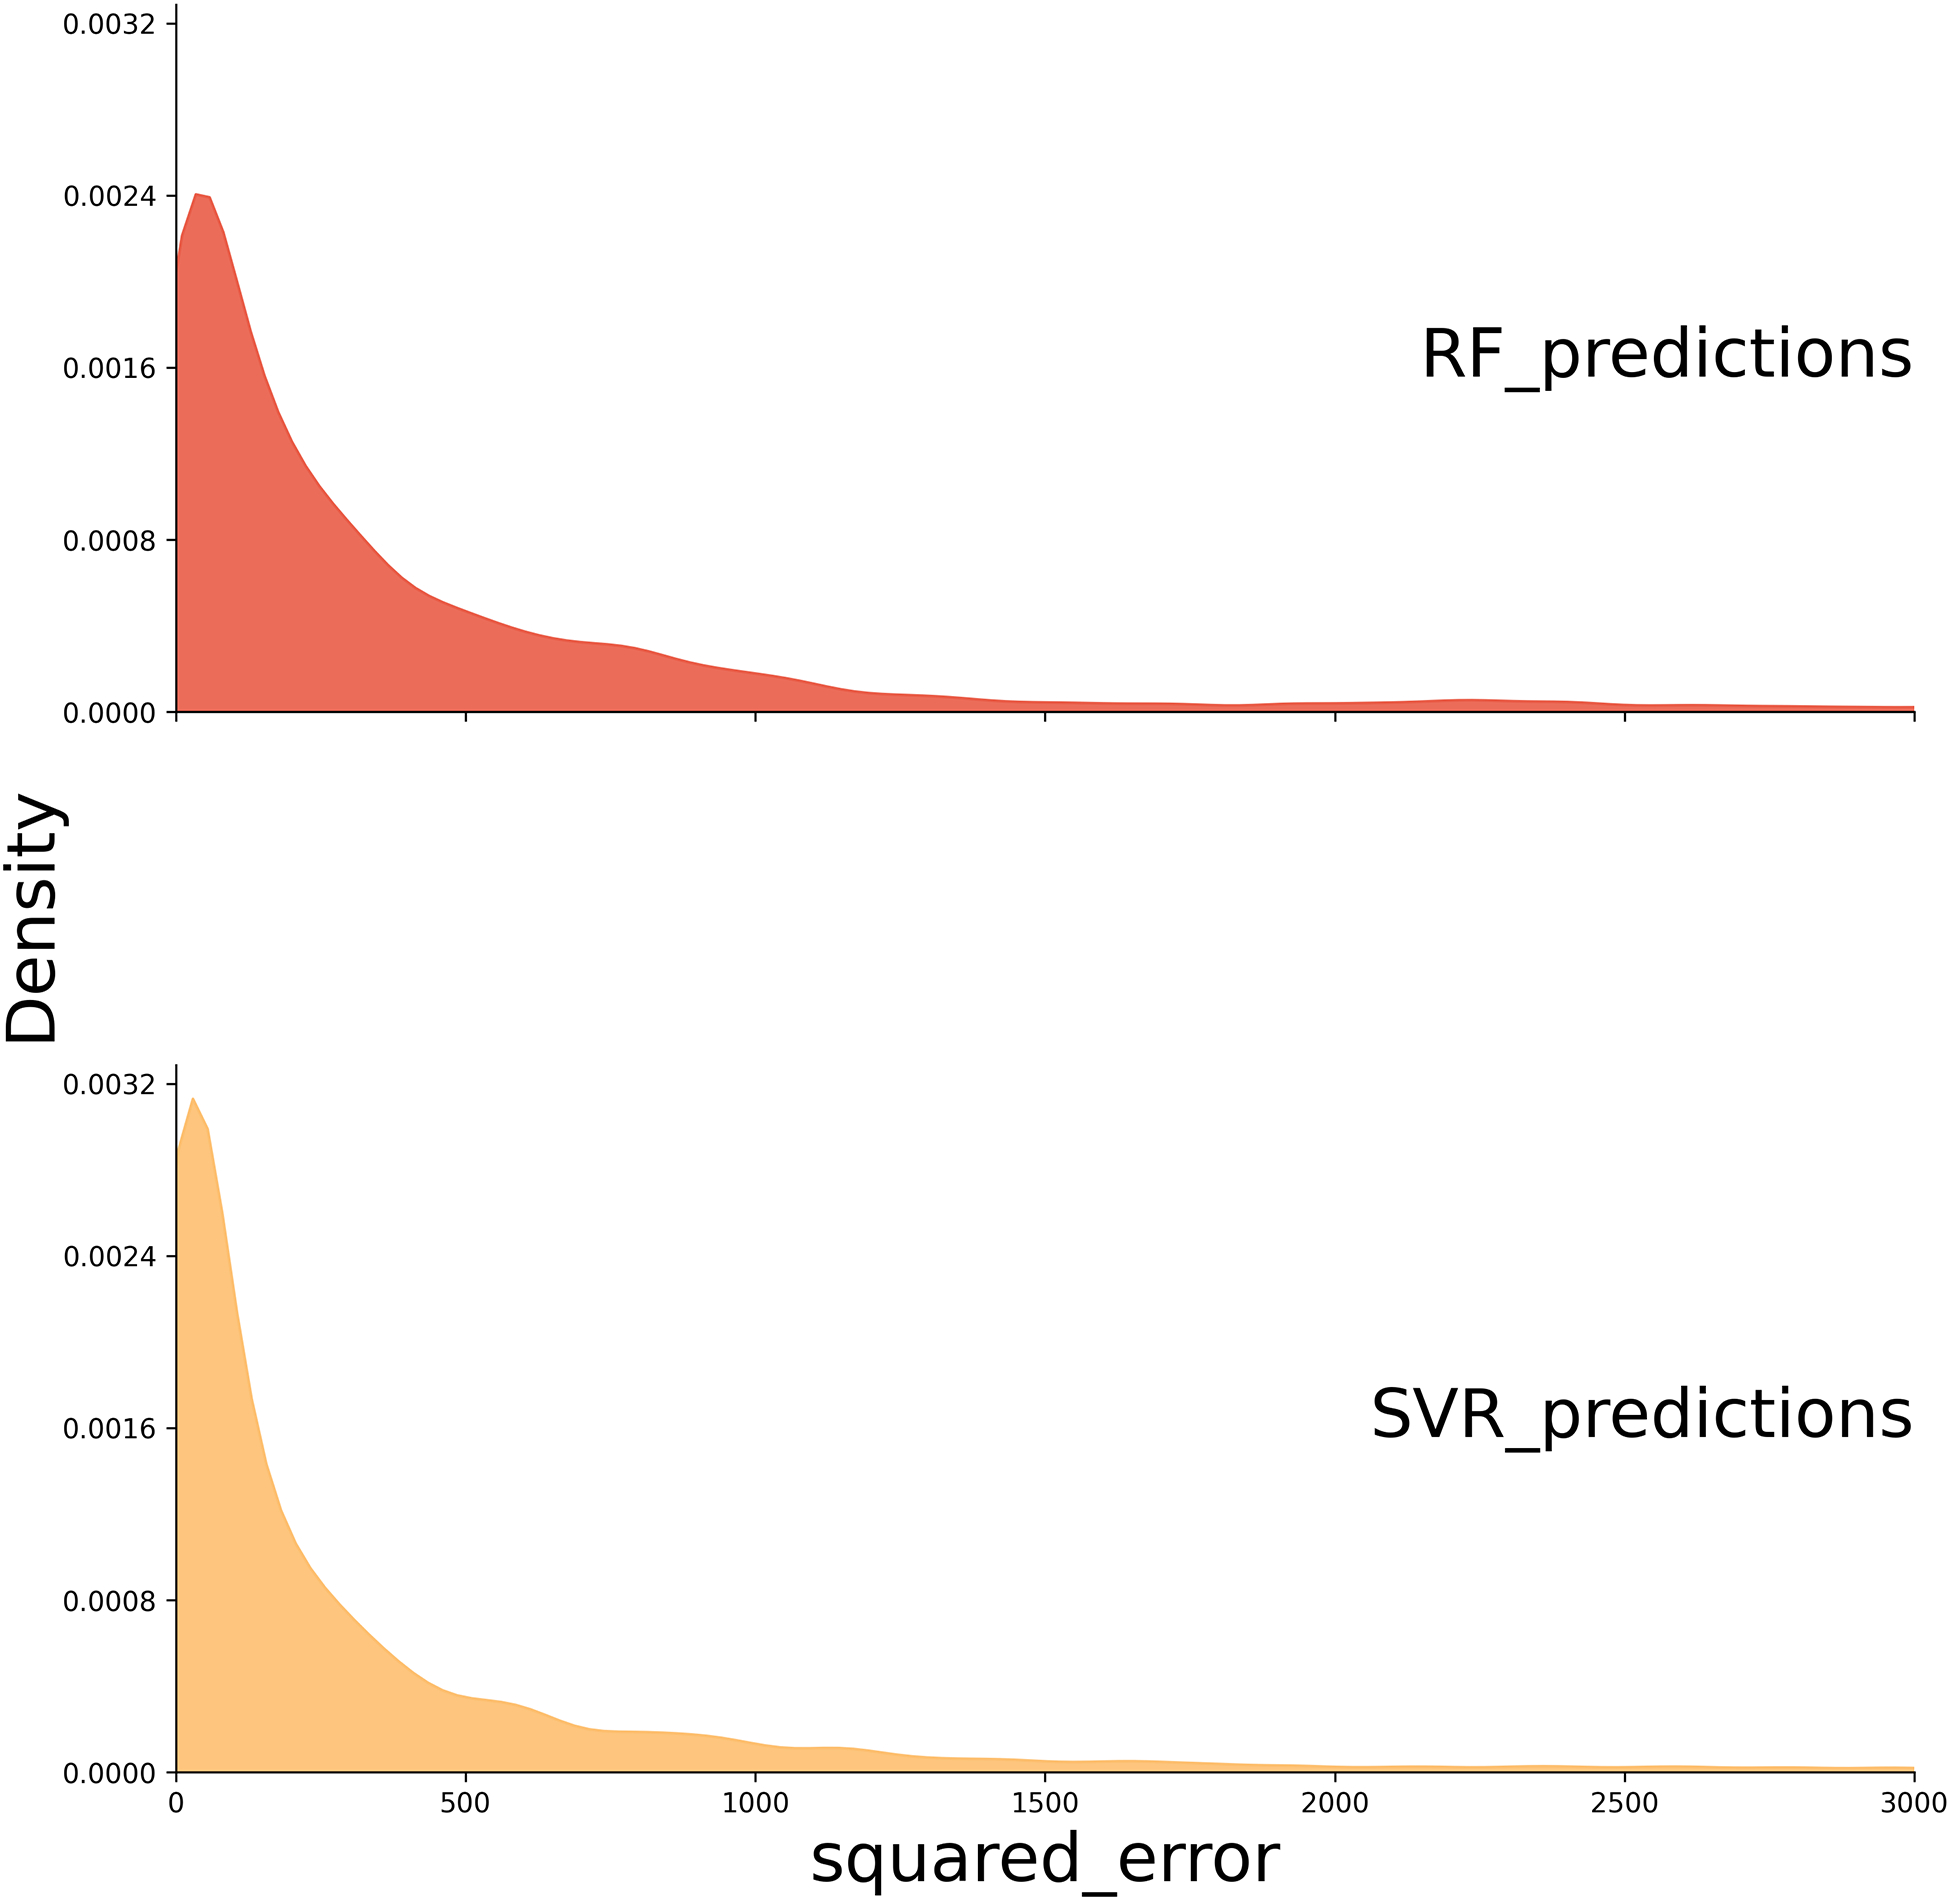
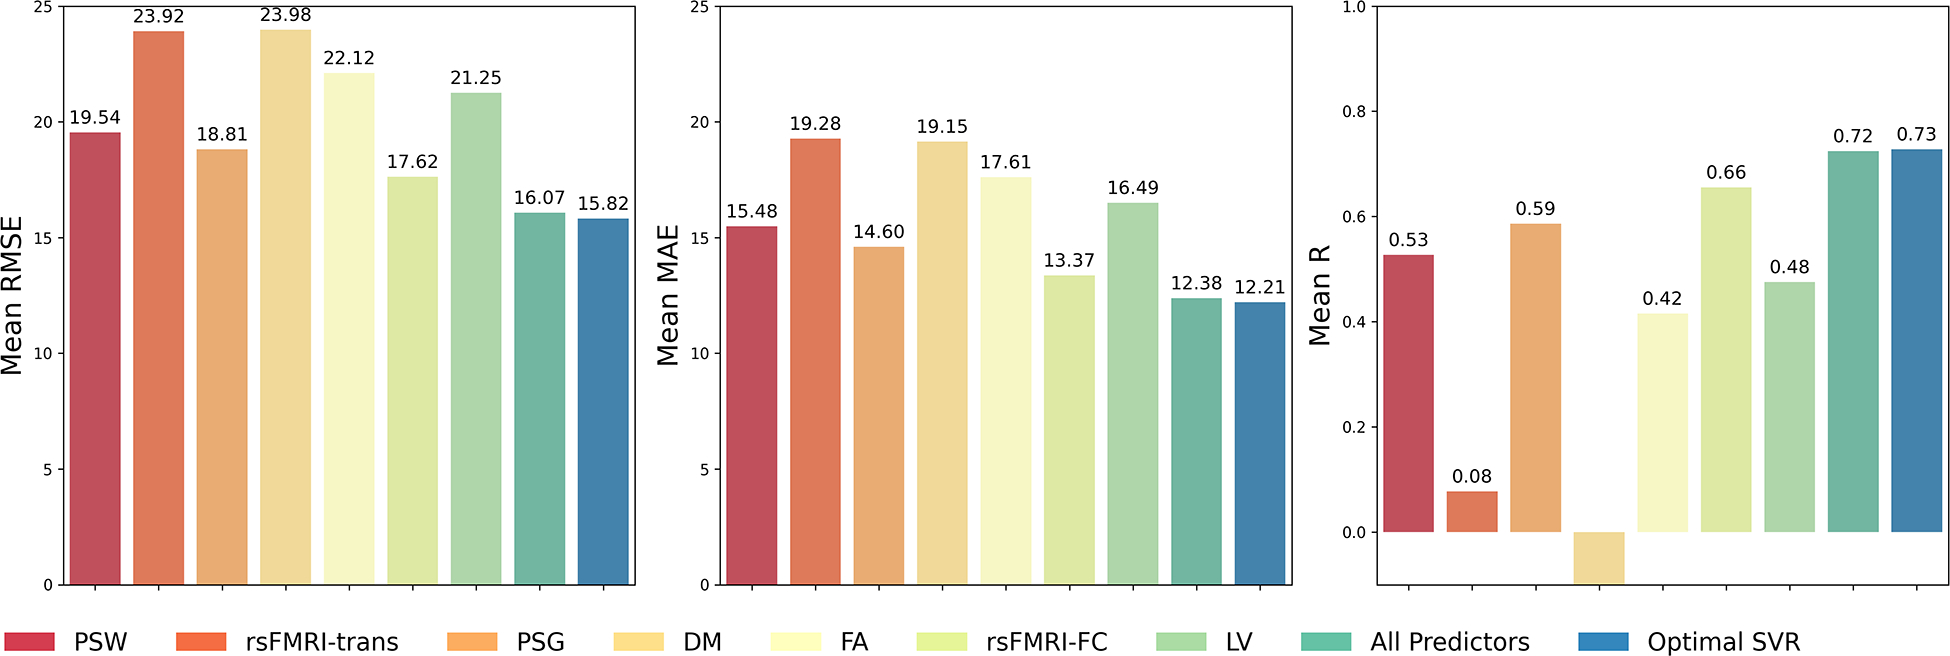
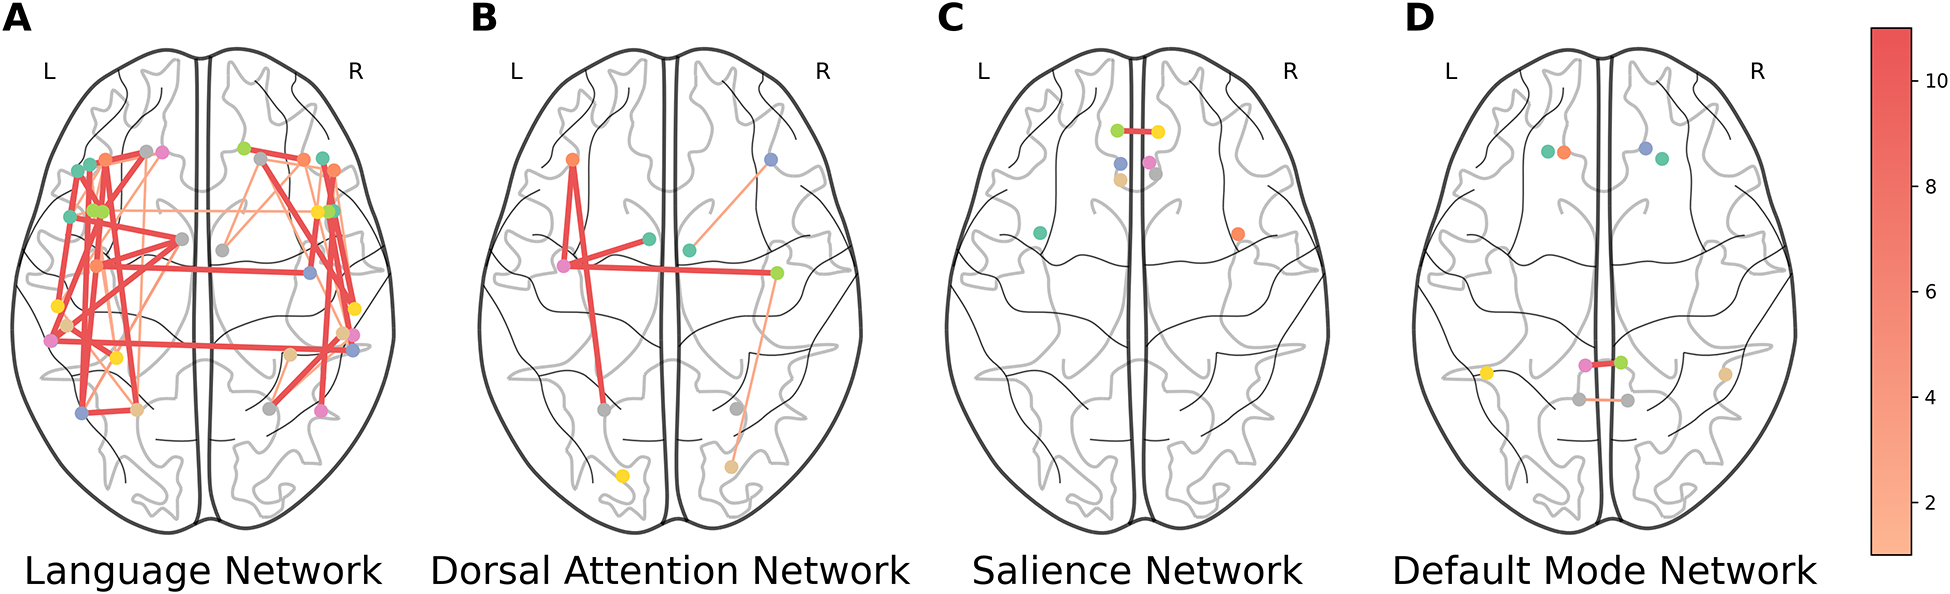
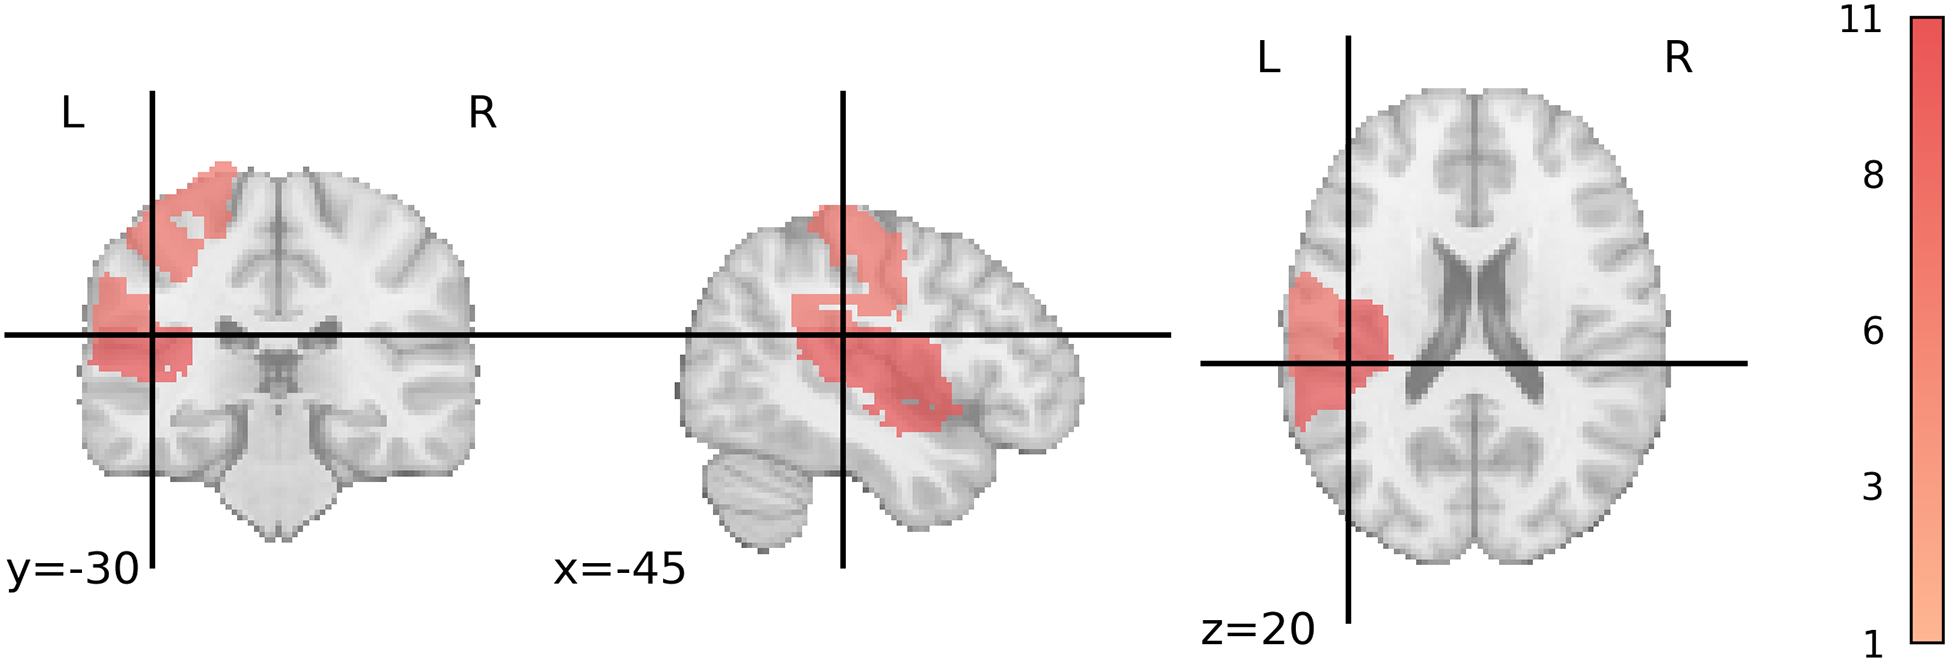
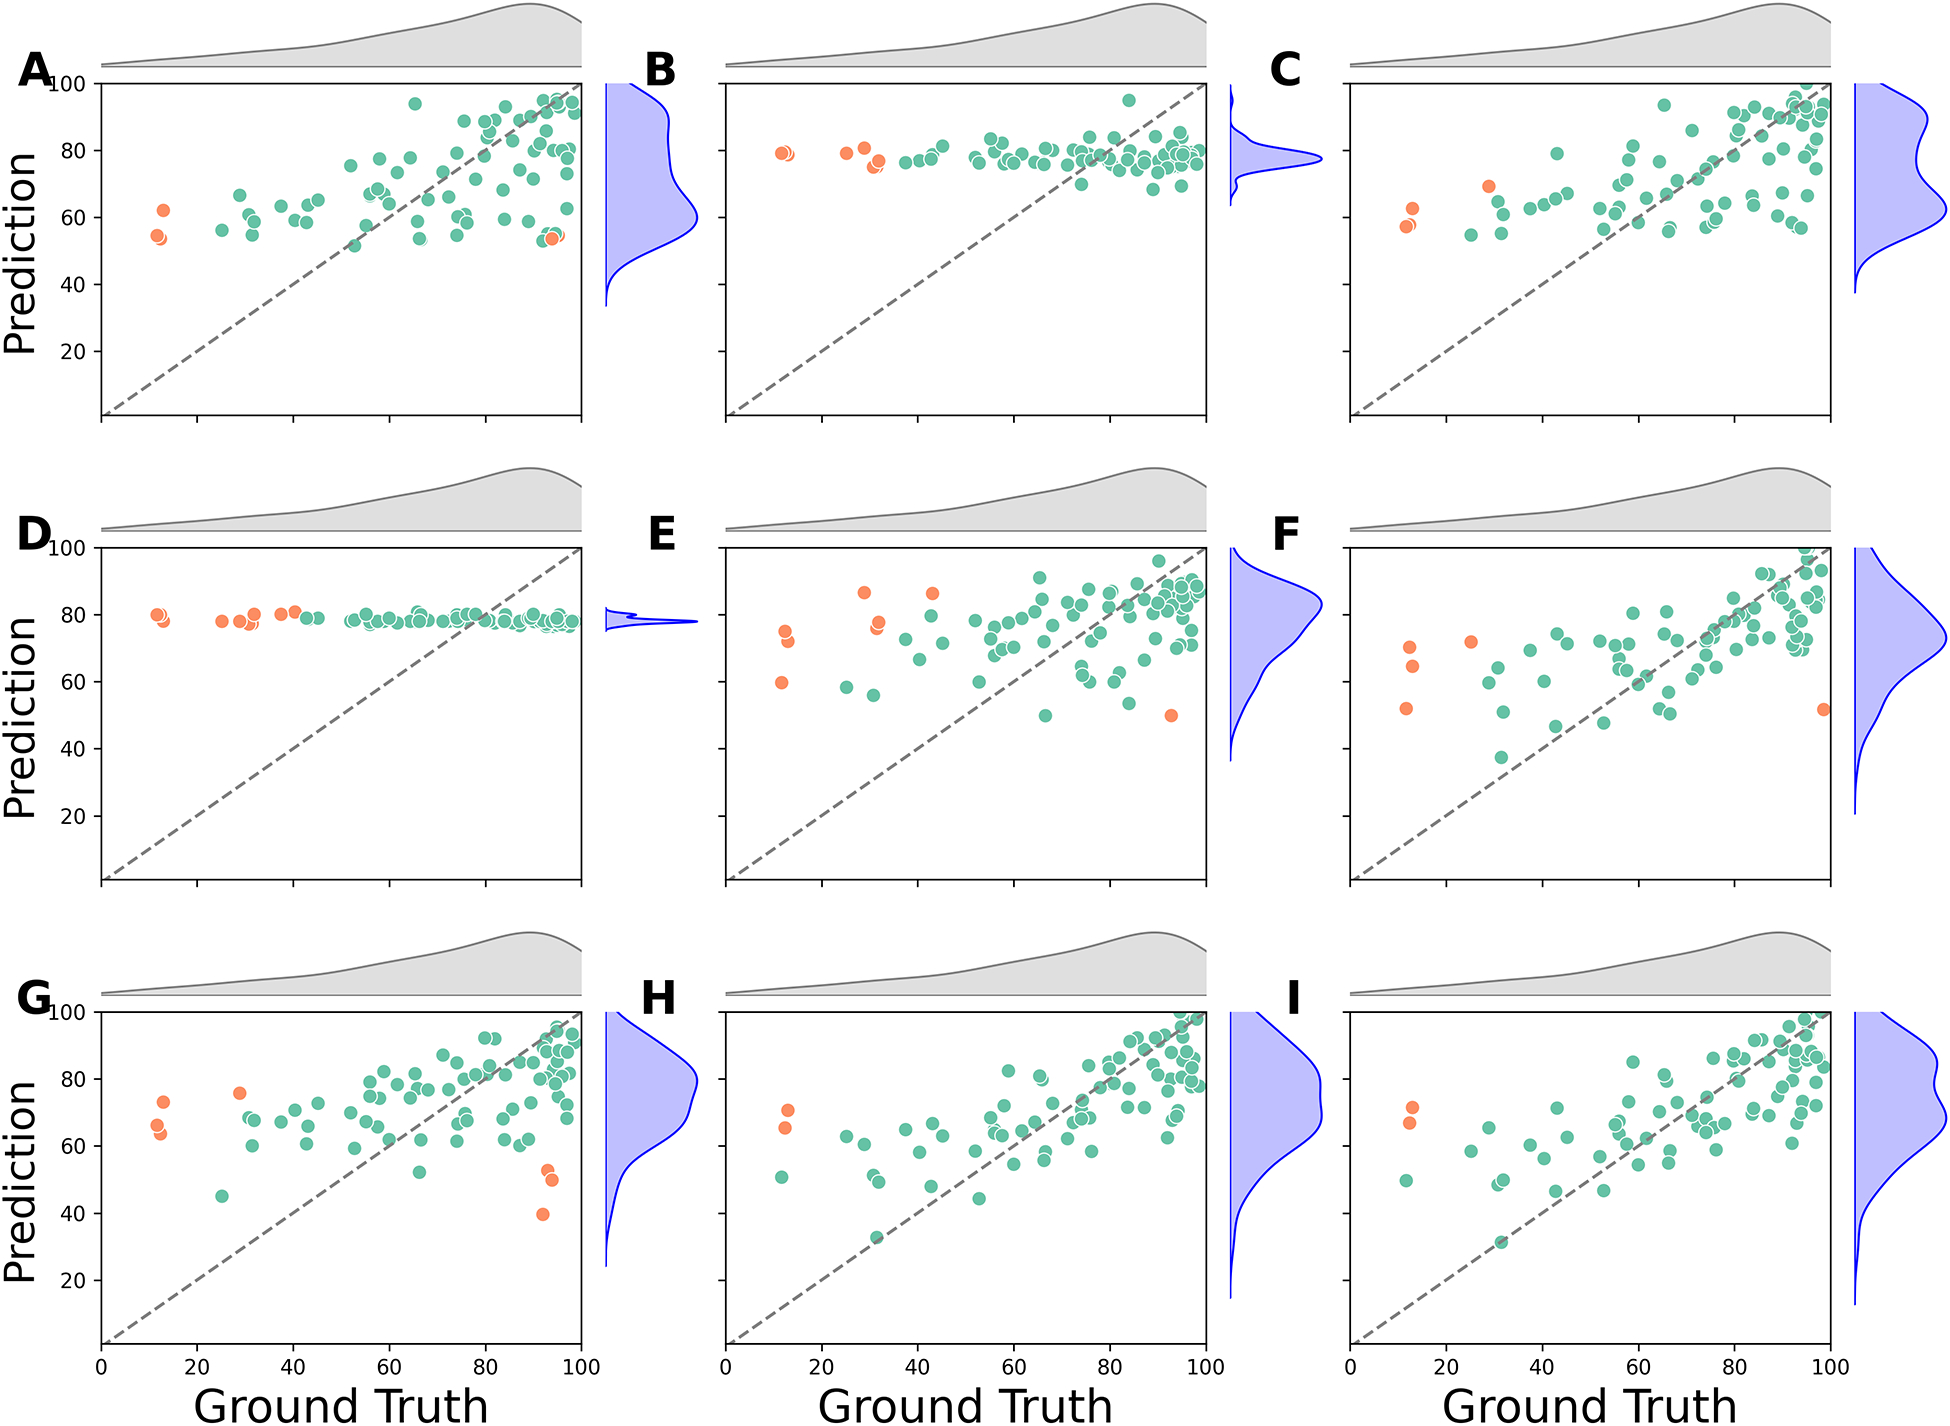
The present study examined an integrated multiple neuroimaging modality (T1 structural, Diffusion Tensor Imaging (DTI), and resting-state FMRI (rsFMRI)) to predict aphasia severity using Western Aphasia Battery-Revised Aphasia Quotient (WAB-R AQ) in 76 individuals with post-stroke aphasia. We employed Support Vector Regression (SVR) and Random Forest (RF) models with supervised feature selection and a stacked feature prediction approach. The SVR model outperformed RF, achieving an average root mean square error (RMSE) of 16.38±5.57, Pearson's correlation coefficient (r) of 0.70±0.13, and mean absolute error (MAE) of 12.67±3.27, compared to RF's RMSE of 18.41±4.34, r of 0.66±0.15, and MAE of 14.64±3.04. Resting-state neural activity and structural integrity emerged as crucial predictors of aphasia severity, appearing in the top 20% of predictor combinations for both SVR and RF. Finally, the feature selection method revealed that functional connectivity in both hemispheres and between homologous language areas is critical for predicting language outcomes in patients with aphasia. The statistically significant difference in performance between the model using only single modality and the optimal multi-modal SVR/RF model (which included both resting-state connectivity and structural information) underscores that aphasia severity is influenced by factors beyond lesion location and volume. These findings suggest that integrating multiple neuroimaging modalities enhances the prediction of language outcomes in aphasia beyond lesion characteristics alone, offering insights that could inform personalized rehabilitation strategies.

Keywords: Aphasia; Aphasia prediction; DTI; MRI; Machine learning; Multi-modal; fMRI.


Conflict of interest statement

Declaration of competing interest The authors declare the following financial interests/personal relationships which may be considered as potential competing interests: Swathi Kiran reports a relationship with Constant Therapy Health that includes: equity or stocks. If there are other authors, they declare that they have no known competing financial interests or personal relationships that could have appeared to influence the work reported in this paper.

Figures

Figure 1:
Figure 1:
Methodological Framework of the Study. A. Demographic and neuroimaging data were collected for all participants. Neuroimaging data were preprocessed, and predictors were extracted from different modalities. Colored boxes indicate the predictors derived from different modalities. The total number of features in each predictor before passing to the feature selection is presented below each box. Boxes marked with an asterisk (*) indicate a subset of features from the original predictors, selected through a supervised feature selection method. For these predictors, the range of features retained after selection across “outer” cross-validation folds is shown below each box. LV: Lesion Volume, PSW: Percent of Spared White Matter, PSG: Percent of Spared Grey Matter, FC: Resting-State Functional Connectivity Matrix, Trans: Transitivity Score, FA: Fractional Anisotropy, and DM: Demographic. B. All combinations (N = 127) of predictors were tested as inputs to the Support Vector Regression (SVR) and Random Forest (RF) models to predict participants’ WAB-R AQ. For each predictor combination, the features from the selected predictors were stacked together to form a single, extended input feature set. Model performance was evaluated using Root-mean-squared-error (RMSE) as the primary metric along with mean-absolute-error (MAE) and correlation (r). Furthermore, Shapley values (SHAP) with RMSE as the characteristic function, are calculated for each predictor.
Figure 2:
Figure 2:
Lesion overlay for the 76 participants in the study.
Figure 3:
Figure 3:
Graphic Illustration of Model Development. The complete dataset is first split randomly into 11 test-training folds. Each “outer” training fold is further divided randomly, ten times, into 10 “inner” Cross-Validation (CV) folds for a total of 100 inner validation-training folds. For each k, Recursive Feature Elimination (RFE) is applied to each of the 100 inner training folds to select the k most important features. The top k most frequently selected features across all 100 inner training folds is then used to train a machine learning (ML) model and tune its hyper-parameters using the same 100 inner validation-training folds. The trained and tuned model with the lowest average validation RMSE across all k values is used to predict the WAB-R AQ of the outer test fold. The final test performance is the average value of the test metric across all 11 outer test folds.
Figure 4:
Figure 4:
Squared Error Distribution Plots. (A) The distribution of squared errors for SVR and RF models. The plot indicates that SVR has a higher density of lower squared error values compared to RF. (B) The squared error distribution for each modality, with RF models represented in red and SVR models in orange. rsFMRI-FC: Resting State Functional Connectivity; rsFMRI-trans: Resting State Transitivity; PSG: Percent Spared Grey Matter; PSW: Percent Spared White Matter; LV: Lesion Volume; FA: Fractional Anisotropy; DM: Demographic; SVR: Support Vector Regression; RF: Random Forest.
Figure 4:
Figure 4:
Squared Error Distribution Plots. (A) The distribution of squared errors for SVR and RF models. The plot indicates that SVR has a higher density of lower squared error values compared to RF. (B) The squared error distribution for each modality, with RF models represented in red and SVR models in orange. rsFMRI-FC: Resting State Functional Connectivity; rsFMRI-trans: Resting State Transitivity; PSG: Percent Spared Grey Matter; PSW: Percent Spared White Matter; LV: Lesion Volume; FA: Fractional Anisotropy; DM: Demographic; SVR: Support Vector Regression; RF: Random Forest.
Figure 5:
Figure 5:
Predictive performance for Support Vector Regression (SVR) and Random Forest (RF) models trained on a single predictor, all predictors, or the optimal combination of predictors. The first column shows the average RMSE across the outer 11-fold cross-validation for all aforementioned types of predictors. The second column shows the average MAE, and the last column shows the mean r score. RMSE: Root Mean Squared Error; MAE: Mean Absolute Error
Figure 5:
Figure 5:
Predictive performance for Support Vector Regression (SVR) and Random Forest (RF) models trained on a single predictor, all predictors, or the optimal combination of predictors. The first column shows the average RMSE across the outer 11-fold cross-validation for all aforementioned types of predictors. The second column shows the average MAE, and the last column shows the mean r score. RMSE: Root Mean Squared Error; MAE: Mean Absolute Error
Figure 6:
Figure 6:
Comparison of RBF Kernel and Linear Kernel Performance. This plot compares the average minimum RMSE achieved by each kernel type across different combined predictor models. The horizontal axis represents the index of the combined predictor model, and the vertical axis represents the RMSE value. The RBF kernel consistently achieved lower RMSE for models that combined rsFMRI-FC with PSW/PSG predictors (rsFMRI-FC: Resting State Functional Connectivity; PSG: Percent Spared Grey Matter; PSW: Percent Spared White Matter; RBF: Radial Basis Function).
Figure 7:
Figure 7:
Scatter plot of mean RMSE for SVR models. The horizontal axis represents model rankings based on mean RMSE, from worst to best (left to right). The vertical axis shows mean RMSE scores. Models that include both rsFMRI-FC and structural information (PSW/PSG) are highlighted by a solid green rectangle. Models excluding rsFMRI-FC and key structural predictors are marked with a solid pink rectangle, indicating poor performance. Dashed horizontal lines represent the mean RMSE of individual rsFMRI-FC (orange) and PSG (gray) models. This plot emphasizes the importance of combining rsFMRI-FC with structural information for optimal SVR performance.
Figure 8:
Figure 8:
Selected rsFMRI-FC pairs for SVR. Thicker and darker lines between two ROIs indicate more frequent selection of functional connectivity between these regions. The color bar indicates the number of times a connection is selected (1–11). rsFMRI-FC: Resting State Functional Connectivity; SVR: Support Vector Regression.
Figure 9:
Figure 9:
Selected PSG regions for SVR. Darker areas indicate more frequent selection of the region. The color bar indicates the number of times a region is selected (1–11). PSG: Percent Spared Grey Matter; SVR: Support Vector Regression.
Figure 10:
Figure 10:
SVR Predictions vs. Ground Truth. The scatter plots compare the ground truth scores (horizontal axis) with the predicted scores (vertical axis). Points with a prediction error greater than 40 points are marked in orange. (A) PSW; (B) rsFMRI-trans; (C) PSG; (D) DM; (E) FA; (F) rsFMRI-FC; (G) LV; (H) Lowest RMSE (DM+PSW+rsFMRI-FC); (I) All predictors. rsFMRI-FC: Resting State Functional Connectivity; rsFMRI-trans: Resting State Transitivity; PSG: Percent Spared Grey Matter; PSW: Percent Spared White Matter; LV: Lesion Volume; FA: Fractional Anisotropy; DM: Demographic; SVR: Support Vector Regression.

Similar articles

Cited by

References

    1. Ashburner J, 2007. A fast diffeomorphic image registration algorithm. Neuroimage 38, 95–113. - PubMed
    1. Ashburner J, Friston KJ, 2005. Unified segmentation. Neuroimage 26, 839–851. - PubMed
    1. Awad M, Khanna R, 2015. Support vector regression, in: Efficient Learning Machines. Apress, Berkeley, CA, pp. 67–80.
    1. Basilakos A, Fillmore PT, Rorden C, Guo D, Bonilha L, Fridriksson J, 2014. Regional White Matter Damage Predicts Speech Fluency in Chronic Post-Stroke Aphasia. Frontiers in Human Neuroscience 8. doi: 10.3389/fnhum.2014.00845. publisher: Frontiers. - DOI - PMC - PubMed
    1. Billot A, Lai S, Varkanitsa M, Braun EJ, Rapp B, Parrish TB, Higgins J, Kurani AS, Caplan D, Thompson CK, Ishwar P, Betke M, Kiran S, 2022. Multimodal Neural and Behavioral Data Predict Response to Rehabilitation in Chronic Poststroke Aphasia. Stroke 53, 1606–1614. doi: 10.1161/STROKEAHA.121.036749. publisher: American Heart Association. - DOI - PMC - PubMed

MeSH terms