The diagnostic potential of resting state functional MRI: Statistical concerns
- PMID: 40554035
- PMCID: PMC12303613
- DOI: 10.1016/j.neuroimage.2025.121334
The diagnostic potential of resting state functional MRI: Statistical concerns
Abstract
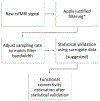
Blood oxygen level-dependent functional magnetic resonance imaging (fMRI) is a widely used, non-invasive method to assess brain hemodynamics. Resting-state fMRI (rsfMRI) estimates functional connectivity (FC) by measuring correlations between the time courses of different brain regions. However, the reliability of rsfMRI FC is fundamentally compromised by statistical artifacts arising from signal cyclicity, autocorrelation, and preprocessing-induced distortions. We discuss how standard rsfMRI preprocessing -particularly the widely used band-pass filters such as 0.009-0.08 Hz and 0.01-0.10 Hz- introduce biases that increase correlation estimates between independent time series. Additionally, filtering without appropriate downsampling further distorts correlation coefficients, inflating statistical significance and increasing the risk of false positives. Under these conditions, commonly used multiple comparison corrections fail to fully control Type I errors, with up to 50-60 % of detected correlations in white noise signals remaining significant after correction depending on the sampling rate, filter and duration. To mitigate these biases, we recommend adjusting sampling rates to align with the analyzed frequency band and employing surrogate data methods that better account for the statistical properties of rsfMRI signals and reduce autocorrelation-driven false positives. Additionally, we show that structured brain states-such as epilepsy and anesthesia-induced burst suppression-impose low-frequency neural activity that further amplifies these biases, distorting FC estimates. These findings indicate that accepted rsfMRI preprocessing pipelines systematically amplify spurious correlations and call for an improved statistical framework. This framework must explicitly account for autocorrelation, cyclicity, and multiple comparison biases, while excluding or correcting for structured neural activity that further distorts connectivity estimates.
Copyright © 2025 The Author(s). Published by Elsevier Inc. All rights reserved.
Conflict of interest statement
Declaration of competing interest The authors declare that they have no known competing financial interests or personal relationships that could have appeared to influence the work reported in this paper.
Figures


Similar articles
-
Short-Term Memory Impairment.2024 Jun 8. In: StatPearls [Internet]. Treasure Island (FL): StatPearls Publishing; 2025 Jan–. 2024 Jun 8. In: StatPearls [Internet]. Treasure Island (FL): StatPearls Publishing; 2025 Jan–. PMID: 31424720 Free Books & Documents.
-
Voxel-Wise or Region-Wise Nuisance Regression for Functional Connectivity Analyses: Does It Matter?Hum Brain Mapp. 2025 Aug 15;46(12):e70323. doi: 10.1002/hbm.70323. Hum Brain Mapp. 2025. PMID: 40838474 Free PMC article.
-
Magnetic resonance perfusion for differentiating low-grade from high-grade gliomas at first presentation.Cochrane Database Syst Rev. 2018 Jan 22;1(1):CD011551. doi: 10.1002/14651858.CD011551.pub2. Cochrane Database Syst Rev. 2018. PMID: 29357120 Free PMC article.
-
The Healthy Brain Network Serial Scanning Initiative: a resource for evaluating inter-individual differences and their reliabilities across scan conditions and sessions.Gigascience. 2017 Feb 1;6(2):1-14. doi: 10.1093/gigascience/giw011. Gigascience. 2017. PMID: 28369458 Free PMC article.
-
Eliciting adverse effects data from participants in clinical trials.Cochrane Database Syst Rev. 2018 Jan 16;1(1):MR000039. doi: 10.1002/14651858.MR000039.pub2. Cochrane Database Syst Rev. 2018. PMID: 29372930 Free PMC article.
References
Further Reading
Publication types
MeSH terms
Grants and funding
LinkOut - more resources
Full Text Sources
Medical
Miscellaneous

