. 2025 Aug:98:102190.
doi: 10.1016/j.molmet.2025.102190. Epub 2025 Jun 18.

Housing matters: Experimental variables shaping metabolism in obese mice

Affiliations

Housing matters: Experimental variables shaping metabolism in obese mice

Béatrice So-Yun Choi et al. Mol Metab. 2025 Aug.

Abstract

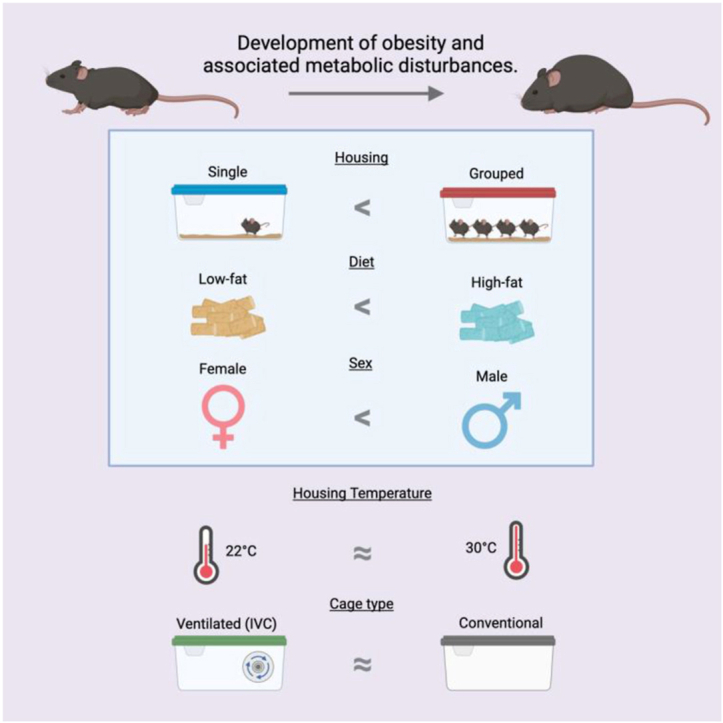
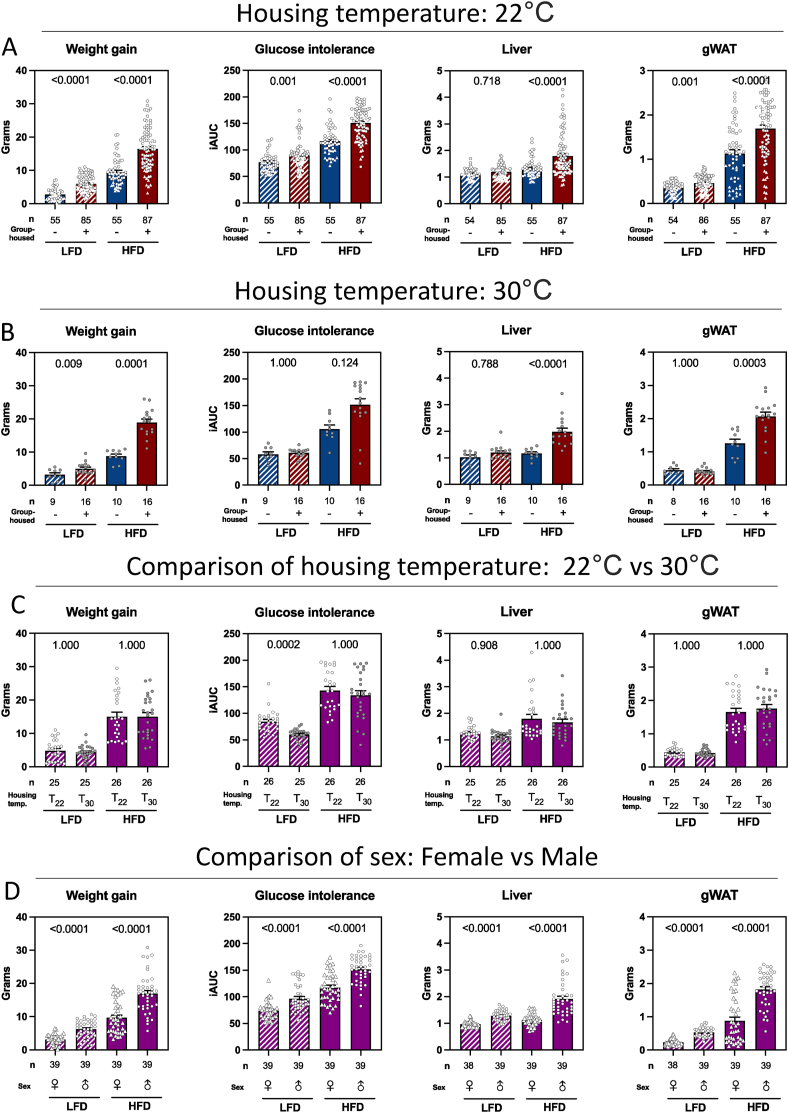
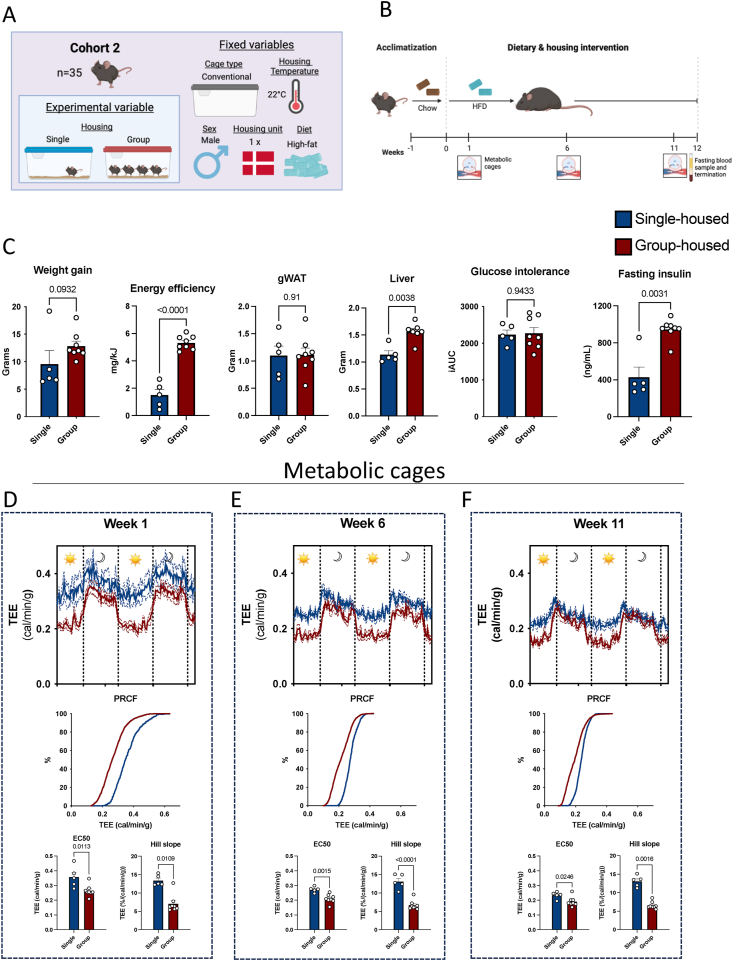
Diet-induced obesity in mice is an important model for investigating host-diet interactions as well as dietary and pharmacological treatments of metabolic diseases. Experimental reproducibility is, however, a recurrent challenge. To determine key controllable experimental drivers of mouse metabolism, we distributed 338C57BL/6JBomTac mice (males and females) into six research units across two countries, divided them into a variety of housing conditions (i.e., diets, cage types, temperatures, group-housing vs. single-housing) and kept 26 reference mice at the vendor. We applied linear mixed models to rank the influence of each variable on metabolic phenotype (i.e., body weight gain, glucose intolerance, liver, and visceral adipose tissue weight). Group-housing was the most potent driver of metabolic dysfunction apart from sex and diet. Accordingly, single-housed mice exhibited reduced weight gain (∼50%), increased energy expenditure, and diminished respiratory exchange ratio concomitant with improved glucose tolerance (∼20%) compared to their group-housed counterparts. Our results may aid in clarifying the impact of experimental design and promote rational, transparent reporting to increase reproducibility.

Keywords: Animal models; High-fat diet; Housing conditions; Reproducibility; Sex differences; Thermoneutrality.


Conflict of interest statement

Declaration of competing interest The authors of this manuscript declare no conflicts of interest.

Figures

Image 1
Graphical abstract
Figure 1
Figure 1
Experimental design and the main effect of experimental variables. A: Visual representation of the different experimental variables and outcomes measured. B: Experimental timeline. Mice were shipped to the six different units simultaneously, with a bag of food from the vendor for acclimatization in each unit. C: Model estimates from linear mixed models as the projected fold change. For housing unit, estimate for the average fold change compared to a typical unit. Each line represents a phenotypic outcome with experimental variables depicted on the x-axis. Circles indicate no significant effect of the variable over the outcome and triangles indicate significance.
Figure 2
Figure 2
Experimental variables differentially impact DIO. A: Weight gain after 12-weeks, glucose intolerance at week 7, liver and gWAT weight at termination, separated in diets and single vs group-housing as indicated. B: As in A but from mice housed at thermoneutrality. C: Male mice housed in conventional cages at either T22 or T30 (2 units, 1 and 2) D: Male and female mice housed at T22 in IVC cages (3 units, 3, 4 and 5). Data shown as individual points, average and SEM. Blue bars represent single-housed mice, red bars group-housed mice, and purple bars represent a combination of single- and group-housed mice. Dashed patterns indicate LFD, and solid bars indicate HFD-fed mice. White dots indicate housing temperature of 22 °C, and grey points represent housing temperature of 30 °C. Round points indicate males, and triangles indicate females A: n = 63–103, B: n = 9–16, C: n = 24–26, D: n = 38–39, per condition as indicated under each bar. iAUC: incremental area under the curve.
Figure 3
Figure 3
Impact of housing on variance, microbiota and stress. A: Intragroup variation on each measured outcome presented by the CV% per condition. Each point represents the variation between mice in a single category in each facility for a total of 28 for weight gain, liver, and gWAT and 26 for glucose intolerance. Data shown as individual points, average and SEM. Each data point per bar represents the CV% from either 8 (group-housed) or 5 (single-housed) mice. Circles = males, Triangles = females, White = T22, Grey = T30, LFD = outer line green and HFD = outer line black. B: Principal Coordinate Analysis (PcoA) unweighted UniFrac colored by either batch shipment (4 batches, n = 18 per shipment) or cage (24 cages, n = 3 per cage). C: Corticosterone in fecal samples. Each point represents a cage, thus, for group-housed cages, each dot is an average for 4 mice whereas for single-housed mice, each dot is a single animal.
Figure 4
Figure 4
Socially deprived mice exhibit altered circadian rhythm and increased energy expenditure A: Visual representation of the different fixed and experimental variables. B: Experimental timeline of the second cohort of mice. C: Body weight gain, energy efficiency, liver and gWAT weight, glucose intolerance (iAUC), and 5 h fasting insulin concentration after 12 weeks of HFD-feeding. Energy expenditure, relative cumulative frequency, and hill slope at weeks D: 1, E: 6, and F: 11 as indicated. EC50 and hill slope were calculated by nonlinear regression of the sigmoidal dose–response curve. Data shown as individual points, average and SEM. Blue represent single-housed mice, red represents group-housed mice. Grey and light areas indicate dark and light periods, blue represents single-housed (n = 5) and red represents group-housed (n = 8). TEE: Total energy expenditure. PRCF: Percent relative cumulative frequency.

Similar articles

References

    1. Lynch S.V., Pedersen O. The human intestinal microbiome in health and disease. N Engl J Med. 2016;375(24):2369–2379. - PubMed
    1. Drucker D.J. Never waste a good crisis: Confronting reproducibility in translational research. Cell Metab. 2016;24(3):348–360. - PubMed
    1. Errington T.M. Building reproducible bridges to cross the “valley of death. J Clin Investig. 2024;134(1) - PMC - PubMed
    1. Freedman L.P., Cockburn I.M., Simcoe T.S. The Economics of reproducibility in preclinical research. PLoS Biol. 2015;13(6) - PMC - PubMed
    1. Dorfman M.D., Krull J.E., Douglass J.D., Fasnacht R., Lara-Lince F., Meek T.H., et al. Sex differences in microglial CX3CR1 signalling determine obesity susceptibility in mice. Nat Commun. 2017;8 - PMC - PubMed