. 2025 Jun 24;23(6):e3003193.
doi: 10.1371/journal.pbio.3003193. eCollection 2025 Jun.

Single-cell and spatiotemporal profile of ovulation in the mouse ovary

Affiliations

Single-cell and spatiotemporal profile of ovulation in the mouse ovary

Ruixu Huang et al. PLoS Biol. .

Abstract

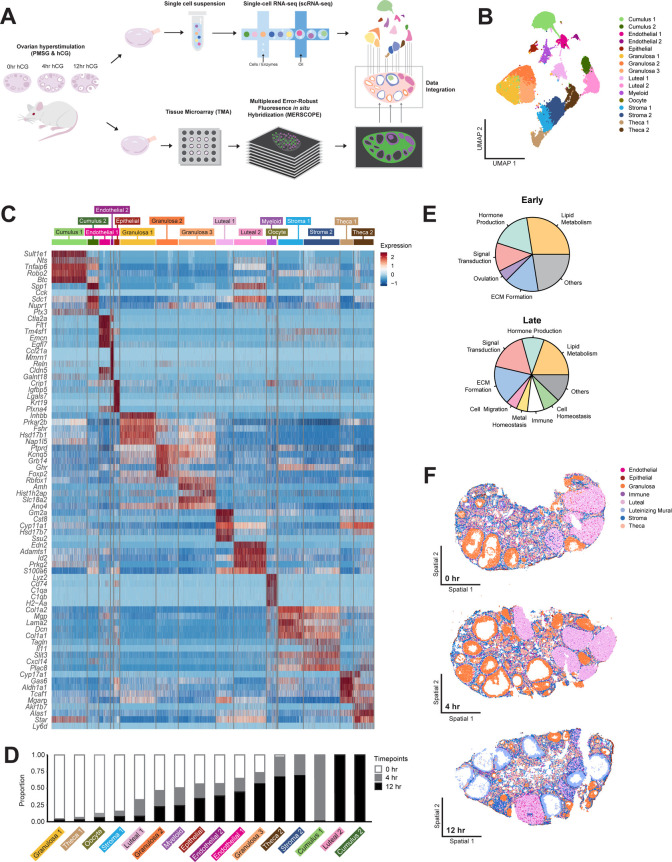
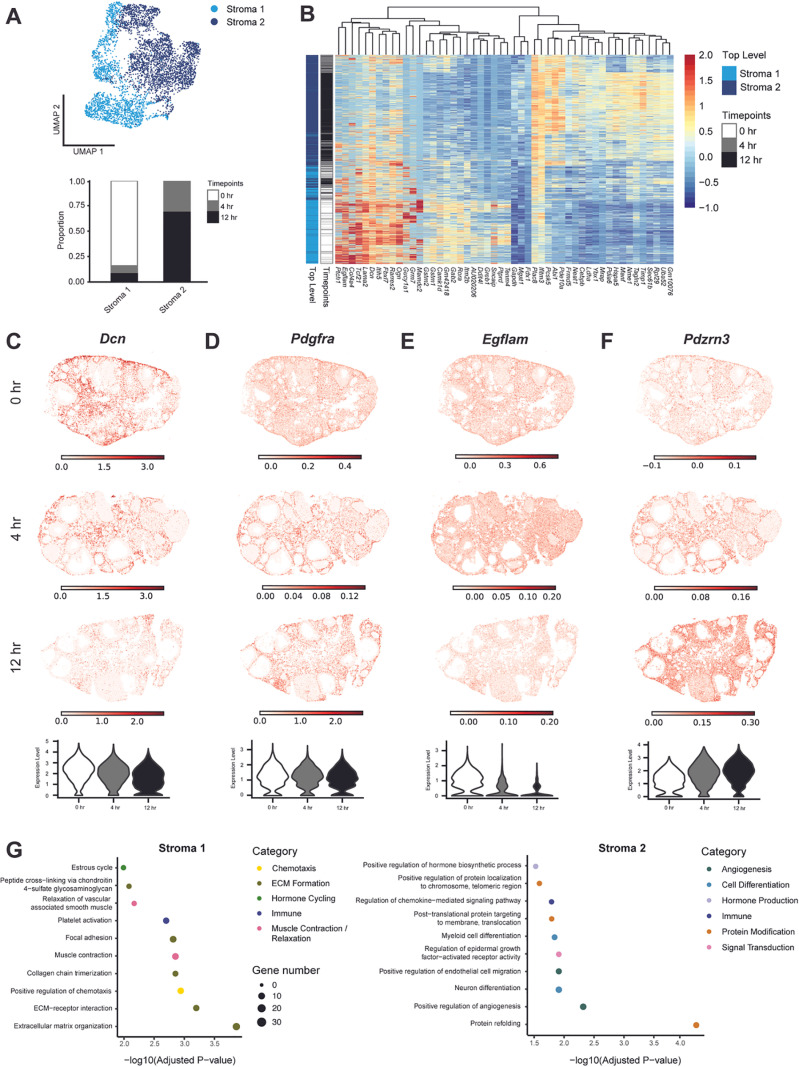
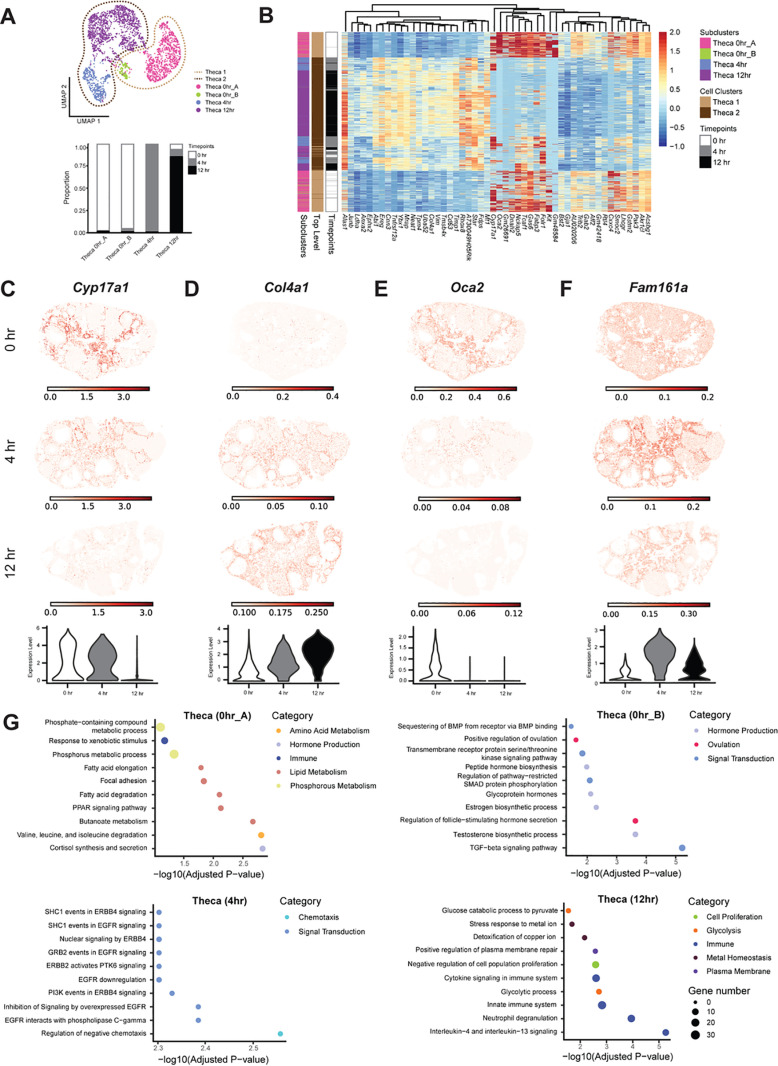
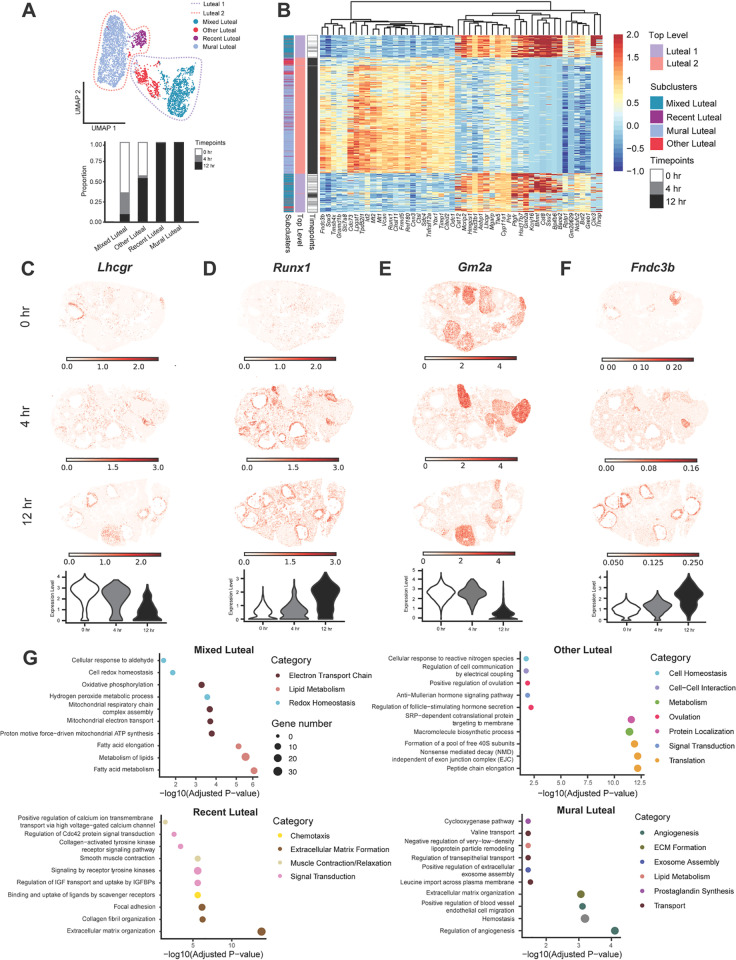
Ovulation is a spatiotemporally coordinated process that involves several tightly controlled events, including oocyte meiotic maturation, cumulus expansion, follicle wall rupture and repair, and ovarian stroma remodeling. To date, no studies have detailed the precise window of ovulation at single-cell resolution. Here, we performed parallel single-cell RNA-seq and spatial transcriptomics on paired mouse ovaries across an ovulation time course to map the spatiotemporal profile of ovarian cell types. We show that major ovarian cell types exhibit time-dependent transcriptional states enriched for distinct functions and have specific localization profiles within the ovary. We also identified gene markers for ovulation-dependent cell states and validated these using orthogonal methods. Finally, we performed cell-cell interaction analyses to identify ligand-receptor pairs that may drive ovulation, revealing previously unappreciated interactions. Taken together, our data provides a rich and comprehensive resource of murine ovulation that can be mined for discovery by the scientific community.


Conflict of interest statement

I have read the journal’s policy and the authors of this manuscript have the following competing interests: A.K.S reports compensation for consulting and/or SAB membership from Honeycomb Biotechnologies, Cellarity, Ochre Bio, Relation Therapeutics, Bio-Rad Laboratories, Passkey Therapeutics, Fog Pharma, Dahlia Biosciences, and intrECate Biotherapeutics. B.A.G., R.H., C.E.K., Y.Z., S.L.F., C.M., A.K.S., F.E.D., H.C.L., L.T.Z., E.Z., and J.N. have filed a patent related to the work described in this study (patent application no. PCT/US24/25824).

Figures

Fig 1
Fig 1. Single-cell and spatial transcriptomic analysis of adult mouse ovaries throughout the time course of ovulation.
(A) Schematic depicts the workflow for single cell and spatial transcriptomic analyses. Mice were hyperstimulated with PMSG and hCG and ovaries were dissected 0 hr, 4 hr, or 12 hr post-hCG injection, processed, and submitted for scRNA-seq or MERFISH analysis. (B) UMAP shows all 16 identified cell type clusters. The cell counts for each cluster were as follows: Cumulus 1 = 2,910, Cumulus 2 = 908, Endothelial 1 = 891, Endothelial 2 = 212, Epithelial = 440, Granulosa 1 = 2,931, Granulosa 2 = 1,781, Granulosa 3 = 3,044, Luteal 1 = 1,421, Luteal 2 = 2,641, Myeloid = 816, Oocyte = 16, Stroma 1 = 2,042, Stroma 2 = 2,970, Theca 1 = 1,051, Theca 2 = 1,640. (C) Heatmap shows five marker genes used to determine the identity of each cell cluster. (D) Stacked bar plot showing the percent of cells in each cluster expressed at each time point. (E) Pie charts showing the categorization of pathways upregulated in early (0 hr) vs. late (12 hr) timepoints. (F) Examples of 0 hr, 4 hr, and 12 hr MERFISH ovary sections with seven major cell types localized. The remaining ovaries can be visualized in S4B Fig. The data underlying this figure is available at the Gene Expression Omnibus (GEO) under accession number GSE294534.
Fig 2
Fig 2. Stroma cells exhibit time-dependent changes in gene expression.
(A) UMAP shows the clustering of stroma cells from scRNA-seq data. A stacked bar plot shows the percent of cells in stromal clusters expressed at each time point. (B) Heatmap depicts differential gene expression in Stroma 1 (early) and Stroma 2 (late) clusters from scRNA-seq data. (C) Inferred expression of Dcn from the integration of scRNA-seq and iST data shows localization to stroma cells. (D) Expression plot of Pdgfra from iST data shows localization to stroma cells. (E) Same with C but with Egflam. (F) Same with C but with Pdzrn3. (G) Dot plots show top processes upregulated in Stroma 1 (left) and Stroma 2 (right). The data underlying this figure is available at the Gene Expression Omnibus (GEO) under accession number GSE294534.
Fig 3
Fig 3. Theca cells exhibit time-dependent changes in gene expression.
(A) UMAP shows the clustering of theca cells at the top-level (dotted line) and the subcluster level (dots) from scRNA-seq data. A stacked bar plot shows the percent in theca subclusters expressed at each time point. (B) Heatmap depicts differential gene expression in Theca 1 (early) and Theca 2 (late) clusters from scRNA-seq data. (C) Expression plot of Cyp17a1 from iST data shows localization to theca cells. (D) Inferred expression of Col4a1 from the integration of scRNA-seq and iST data shows localization to theca cells. (E) Same with D but with Oca2. (F) Same with D but with Fam161a. (G) Dot plots showing top processes upregulated in Theca 0 hr_1 (top left), Theca 0 hr_2 (top right), Theca 4 hr (bottom left), and Theca 12 hr (bottom right). The data underlying this figure is available at the Gene Expression Omnibus (GEO) under accession number GSE294534.
Fig 4
Fig 4. Luteal cells exhibit time-dependent changes in gene expression.
(A) UMAP shows the clustering of luteal cells at the top-level (dotted line) and the subcluster level (dots) from scRNA-seq. A stacked bar plot shows the percent of cells in luteal subclusters expressed at each time point. (B) Heatmap depicts differential gene expression in Recent Luteal and Mixed Luteal subclusters from scRNA-seq. (C) Expression plot of Lhcgr from iST data shows localization to luteal cells. (D) Same with C but with Runx1. (E) Same with C but with Gm2a. (F) Inferred expression of Fndc3b from the integration of scRNA-seq and iST data shows localization to stroma cells. (G) Dot plots show top processes upregulated in Mixed Luteal (top left), Other Luteal (top right), Recent Luteal (bottom right), and Mural Luteal (bottom left) subclusters. The data underlying this figure is available at the Gene Expression Omnibus (GEO) under accession number GSE294534.
Fig 5
Fig 5. Cumulus cells exhibit time-dependent changes in gene expression.
(A) UMAP shows the clustering of cumulus cells from scRNA-seq. A stacked bar plot shows the percent of cells in cumulus clusters expressed at each time point. (B) Heatmap depicting differential gene expression in Cumulus 1 (early) and Cumulus 2 (late) clusters from scRNA-seq. (C–F) RNAscope images show RNA expression of cumulus cell genes of interest, including (C) Sult1e1, (D) Lox, (E) Zpf804a, and (F) Emb. Top: Ovary scans at 20× magnification. Middle: Brightfield images of COCs at 40× magnification. Bottom row: Deconvoluted images of COCs at 40× magnification. (G) Dot plots show top processes upregulated in early (left) and late (right) cumulus cells. The data underlying this figure is available at the Gene Expression Omnibus (GEO) under accession number GSE294534.
Fig 6
Fig 6. Cell–cell interactions between cell types change throughout ovulation.
(A) Circle plots show the change of interactions between various cell types at different timepoints. (B) Scatterplot shows incoming interaction strength and outgoing interaction strength for all cell types present within the 0 hr (left), 4 hr (middle), and 12 hr (right) timepoints. (C) Dot plots show scaled interaction strength between granulosa cells and cumulus cells with upregulated interactions centered at 0 hr (top) and 4 hr (bottom). (D) Dot plots show scaled interaction strength between stroma cells and luteal cells with upregulated interactions centered at 0 hr (top), 4 hr (middle), and 12 hr (bottom). (E) Dot plots show scaled interaction strength between theca cells and luteal cells with upregulated interactions centered at 0 hr (top), 4 hr (middle), and 12 hr (bottom). (F) Dot plots show scaled interaction strength between granulosa cells and luteal cells with upregulated interactions centered at 0 hr (top), 4 hr (middle), and 12 hr (bottom). (G–I) Expression plots show colocalization of (G) Lama2 and Itga9 (0 hr), (H) Fgf2 and Sdc3 (4 hr), and (I) Fgf2 and Sdc4 (12 hr).

Update of

Similar articles

Cited by

References

    1. Tan OL, Fleming JS. Proliferating cell nuclear antigen immunoreactivity in the ovarian surface epithelium of mice of varying ages and total lifetime ovulation number following ovulation. Biol Reprod. 2004;71(5):1501–7. doi: 10.1095/biolreprod.104.030460 . - DOI - PubMed
    1. Duffy DM, Ko C, Jo M, Brannstrom M, Curry TE. Ovulation: parallels with inflammatory processes. Endocr Rev. 2019;40(2):369–416. doi: 10.1210/er.2018-00075 . - DOI - PMC - PubMed
    1. Marik J, Hulka J. Luteinized unruptured follicle syndrome: a subtle cause of infertility. Fertil Steril. 1978;29(3):270–4. doi: 10.1016/s0015-0282(16)43151-1 . - DOI - PubMed
    1. Qublan H, Amarin Z, Nawasreh M, Diab F, Malkawi S, Al-Ahmad N, et al. Luteinized unruptured follicle syndrome: incidence and recurrence rate in infertile women with unexplained infertility undergoing intrauterine insemination. Hum Reprod. 2006;21(8):2110–3. doi: 10.1093/humrep/del113 . - DOI - PubMed
    1. Wang L, Qiao J, Liu P, Lian Y. Effect of luteinized unruptured follicle cycles on clinical outcomes of frozen thawed embryo transfer in Chinese women. J Assist Reprod Genet. 2008;25(6):229–33. doi: 10.1007/s10815-008-9225-2 . - DOI - PMC - PubMed

LinkOut - more resources