

Hederagenin's uric acid-lowering effects in hyperuricemic mice: Mechanistic insights from molecular docking and in vivo analysis
- PMID: 40554493
- PMCID: PMC12186911
- DOI: 10.1371/journal.pone.0326317
Hederagenin's uric acid-lowering effects in hyperuricemic mice: Mechanistic insights from molecular docking and in vivo analysis
Abstract
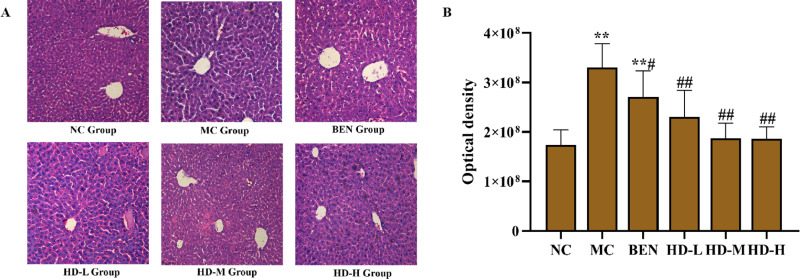
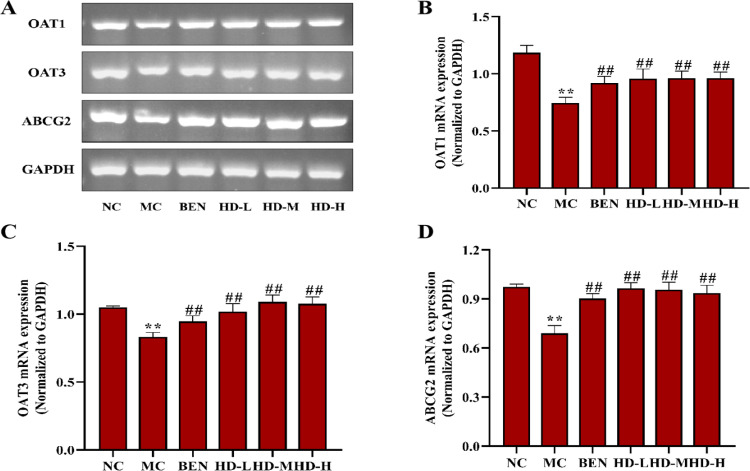
This study explored the uric acid-lowering effects of hederagenin (HD) through molecular docking analysis and a chronic hyperuricemia (HUA) mouse model. Molecular docking was performed to evaluate HD's interactions key urate-regulating proteins, including xanthine oxidase (XOD), ABCG2, OAT1, URAT1, and GLUT9. To establish a chronic HUA model, mice were fed a yeast-adenine diet supplemented with potassium oxonate. The mice were randomly assigned to six groups: normal control, HUA model control, benzbromarone (BEN) group, and three HD treatment groups at doses of 50, 100, and 200 mg/kg. Serum uric acid (UA) levels, liver and kidney function indicators, XOD activity, and oxidative stress markers were assessed. Histopathological analyses of the liver and kidney were also conducted. In addition, gene and protein expression levels of urate transporters and inflammatory markers were assessed using RT-PCR and Western blotting. The results showed that HD interacts with XOD and urate transporters, significantly reducing serum UA levels and inhibiting XOD activity in HUA model. It also modulated the expression of urate transporter to enhance UA excretion. Moreover, HD protected liver and kidney function by reducing pro-inflammatory cytokine levels and inhibiting the TLR4/Myd88/NF-κB and NLRP3 signaling pathways. These findings suggest HD may serve as a promising therapeutic agent for lowing uric acid and preventing organ damage associated with HUA.
Copyright: © 2025 Chen et al. This is an open access article distributed under the terms of the Creative Commons Attribution License, which permits unrestricted use, distribution, and reproduction in any medium, provided the original author and source are credited.
Conflict of interest statement
The authors have declared that no competing interests exist.
Figures


Similar articles
-
Network pharmacology and experimental validation reveal mechanisms of Ilicis Cornutae Folium water extract in treating hyperuricemia.J Ethnopharmacol. 2025 Jul 24;351:120152. doi: 10.1016/j.jep.2025.120152. Epub 2025 Jun 13. J Ethnopharmacol. 2025. PMID: 40517918
-
Secoisolariciresinol diglucoside (SDG) from flaxseed meal alleviates hyperuricemia in mice by regulating uric acid metabolism and intestinal homeostasis.Food Res Int. 2025 Oct;217:116770. doi: 10.1016/j.foodres.2025.116770. Epub 2025 Jun 9. Food Res Int. 2025. PMID: 40597493
-
Rosmarinic acid attenuates hyperuricemia via restoring hyperuricemia-induced renal and intestinal dysfunctions.Phytomedicine. 2025 Sep;145:157084. doi: 10.1016/j.phymed.2025.157084. Epub 2025 Jul 16. Phytomedicine. 2025. PMID: 40684489
-
Urate oxidase for the prevention and treatment of tumour lysis syndrome in children with cancer.Cochrane Database Syst Rev. 2017 Mar 8;3(3):CD006945. doi: 10.1002/14651858.CD006945.pub4. Cochrane Database Syst Rev. 2017. PMID: 28272834 Free PMC article.
-
Protective effects and mechanisms of quercetin in animal models of hyperuricemia: A systematic review and meta-analysis.Pharmacol Res. 2025 Mar;213:107665. doi: 10.1016/j.phrs.2025.107665. Epub 2025 Feb 21. Pharmacol Res. 2025. PMID: 39986664
References
-
- Ren H, Xing A, Ru J. Advances in the intestinal metabolism of uric acid and regulation of gut microbiota for the prevention and treatment of hyperuricemia. Chin J Rheumatol. 2021;25(10):708–11.
-
- Borghi C, Agabiti-Rosei E, Johnson RJ. Hyperuricaemia and gout in cardiovascular, metabolic and kidney disease. Eur J Intern Med. 2020;80:1–11. - PubMed
-
- Ren J, Wei J. Application of molecular docking technology in traditional Chinese medicine research. Chin J Inform Tradit Chin Med. 2014;21(1):123–5.
MeSH terms
Substances
LinkOut - more resources
Full Text Sources
